The Bureau of Land Management and the U.S. Forest Service administer over 60 million acres of this area.
Using ArcView 3.1 and Spatial Analyst for GIS Technology Transfer in the Interior Columbia Basin Ecosystem Management Project (ICBEMP)
Nupur Shankar
Abstract
The Interior Columbia Ecosystem Management Project (ICBEMP) is an inter-agency endeavor by the Bureau of Land Management and U.S. Forest Service to devise a broad-scale management plan for the Columbia River basin. An interdisciplinary group of federal agency employees will act as regional coordinators during the implementation stage of the ICBEMP. Many people in this group do not have strong GIS skills or access to a GIS staff but need to get familiar with and use the ICBEMP GIS data. A CD-ROM containing ArcView projects concentrating on different disciplines was created and distributed to this group. Each project had two versions, one having only vector data and the other having grid and vector data for use with Spatial Analyst. Along with canned views and layout templates, the projects contained linked data, metadata, tutorials, and instructions. Hence, a portable custom training package designed to support a variety of user skills and environments was created, without requiring an investment in a new set of tools.
Background
The Interior Columbia Basin Ecosystem Management Project evolved as a result of a directive to the Forest Service by President Clinton in 1993 to "develop a scientifically sound and ecosystem based strategy for management of eastside forests." The President's direction was part of his plan for ecosystem-based management in the Pacific Northwest. The Bureau of Land Management also joined the effort a little later that year.
The goal of the ICBEMP is to develop a long-term comprehensive strategy for managing
public lands that would adequately address the forest and rangeland health, anadromous fish,
and social and economic issues of the region. The Project's geographic area includes over 140
million acres in the interior Columbia River Basin, the Upper Klamath, and parts of the Great
Basin in the states of Oregon, Washington, Idaho, and Montana.
The Bureau of Land Management and the U.S. Forest Service administer over 60 million acres of this area.
The ICBEMP is divided into two phases. The first includes completion of a scientific assessment, environmental impact statements (EIS) and a record of decision (ROD). The land managers and other field office personnel will be responsible for implementing the direction contained in the ROD in the second phase. A large amount of information will be transferred to the field personnel, enabling them to use the information and data from the broad-scale study to amend their individual land management plans and develop local projects. There needed to be a team that would provide for the transfer of the science information to the field offices and help the personnel in using that information. Hence, an interagency interdisciplinary team called RIST (Regional Implementation Support Team) was chartered in May 1998 by the ICBEMP executive steering committee. The team members include natural resource specialists from regional, state, supervisor, district, and field level offices of the Forest Service and Bureau of Land Management. The RIST members assist multi-agency personnel from five agencies to understand and use the Science Assessment Information in a manner that supports and compliments overall management of lands administered by the Bureau of Land Management and Forest Service. The RIST will have the following roles:
1. Review science and become local expert on their discipline
2. Answer questions from field
3. Understand data for discipline & assist field with its use
4. Identify, plan and participate in workshops/training
5. Interact with EIS team, Implementation Team, and Science Advisory Group
6. Assist with special issues
The RIST ArcView CD Project
Purpose
To serve in many of their roles, the RIST needed to have an understanding of the ICBEMP data. At meetings, scientists working on the ICBEMP had introduced them to some of the data as part of their presentations. At one of the RIST meetings, the ICBEMP Spatial Team demonstrated the project data using GIS (ArcView 3.1). It was the first attempt at showing the RIST how data could be used, manipulated, mapped, and queried. There was an overwhelmingly positive response to the presentation. Even though the data had been available on the ICBEMP web site, presenting the data in context and as canned views was more meaningful and easy to understand. A large number of members of the RIST requested the data as well as the ArcView projects. These requests eventually evolved into the RIST ArcView CD Project.
The RIST Arcview CD project was envisioned as providing the RIST with an easy way to access and gain familiarity with key ICBEMP data. The RIST mostly consist of resource specialists who are not GIS professionals. Some of them do not even have access to GIS staff, so it was necessary to provide RIST members with easy access to the project data and a means to do their own query and analysis. The projects were also meant to assist members of the RIST in understanding the accuracy and limitations of the data at the basin-wide scale; concept of broad-scale vs. mid-scale and fine-scale data; the concept of scale in tiered analyses; and the use of broad scale information to provide context for finer scales.
Why ArcView Projects?
The project had to be put together quickly so writing custom code using MapObjects and Visual Basic was out of the question. Since all field offices for the BLM and Forest Service had access to ArcView, it was felt that this GIS tool would be a good choice. Besides being available, it provided an easy interface for assembling these custom projects and was one of the easiest GIS tools to learn for non-GIS users. Even though it was known that ArcView project files hard coded the pathnames, it was felt that a workaround was possible. Hence, ArcView was selected as the tool of choice for presenting the ICBEMP data to the RIST.
Creating the ArcView Projects
Since the RIST is composed of members with expertise in diverse fields, it was determined that four ArcView projects showcasing the various staff areas (Aquatics, Landscape Ecology, Socio-Economics, Terrestrial) and one project highlighting data of universal interest to the RIST would be created.
First, all the important themes in the ICBEMP database to be included on the CD-ROM were identified. It was essential for the ArcView projects to work on both Unix and PC platforms as some field offices had ArcView on one or the other. A master area for creating all the ArcView projects was created on the Unix workstation. Separate directories called 'master_shape' and 'master_grid' were created for shape/database files and grids, respectively. These directories had subdirectories named after theme groups. Theme groups are logical groupings of themes by the type of data. For example, all the political themes would be found in the Political theme group or all the demographics themes would be part of the Demographics group, and so on. The same groupings are followed on the ICBEMP Spatial Data home page (http://www.icbemp.gov/spatial/).
All the coverages to be included on the CD-ROM were converted into shape files using the ARCSHAPE command in Arc/Info. The attribute and database files were copied into the Attributes and Database subdirectories, respectively under the master_shape directory. Initially the grids were copied into the 'master_grid' directory on the Unix platform but tests on the PC showed that ArcView could not recognize those grids. So grid export files were copied on to the PC and were imported as grids using the ArcView Import 7.1 routine. Once all the themes in a particular theme group had been imported, the complete directory was ready to be copied to the Unix platform. Testing results of grids created in this manner indicated that ArcView was able to recognize them on both platforms.
Another directory called 'Metadata' was created at the same level as the master_shape and
master_grid directories for storing metadata files of all the themes that were to be included on
the CD-ROM. The metadata files in text format were then copied into this directory. Before
creating the projects it was necessary to find ways to provide the end-users with easy access to
the metadata. Ideally, a person would be able to look at the metadata of the active theme on
the screen. After experimenting with some options, the hotlinks button seemed to offer the
desired functionality. But for it to work, the attribute files of each of the themes had to be
edited. A field called metadata was added to all the attribute files and all the records were
populated with the relative pathname of the metadata file. For example, the metadata
pathname for a theme called MVBCRBA would be 'metadata/mvbcrba.met.'
The projects were created at the root level, i.e., at the same level as the master_shape, master_grid, and metadata directories. ICBEMP has a large amount of raster data so each project was created in two different versions of ArcView. While ArcView 2.1 was used to put together projects that did not have views with Grid data, ArcView3.1 with Spatial Analyst was used for projects that also included grid data. ArcView 2.1 was used because there were some field offices that did not have the latest version of ArcView. So if a person had ArcView 3.1 but not Spatial Analyst, they could still use the ArcView 2.1 project.
Each of the projects consisted of a series of canned views having inter-related data in the same view. All the releasable themes were linked to their metadata file through the hotlinks feature, so that a user could determine things like the resolution, description of attributes, etc. A template for creating layouts at the same scale as one of the templates used by the ICBEMP was also created. This was stored as a layout that had to be converted into a template by the end-user.
Once the projects were ready, the .apr files were modified to reference only relative paths
using find and replace utilities in a text editor. A document was prepared that explained the
basics of ArcView, and provided instructions for using the ArcView projects on the CD-ROM.
Another document contained a list of all the themes included on the CD-ROM arranged by
the theme groups. The documents were then converted into Adobe Acrobat format to allow
users without a word processor or a different word processor to view the document without
any need for conversions. Adobe Acrobat readers for different platforms were also
downloaded from the Internet and copied into a folder called 'Readers.' At this point, all of
the materials collected were copied to a CD burner and transferred to CDs. After testing some
of the CD-ROMs, they were ready for distribution.
Organization of the CD
The project (.apr) and instruction files are stored at the root level with all other data stored at least one level below. All of the shape files and grids are divided into theme groups like, Atmospheric, Hydrologic, Political, Physiographic, etc., following the structure used on the ICBEMP Spatial web page (http://www.icbemp.gov/spatial/html/spatialhome.html). The metadata files are stored as text files in a directory called metadata. Another directory called Readers contains Adobe Acrobat readers for various platforms.
Features of the CD
ArcView projects highlighting different disciplines
Each of the discipline specific ArcView projects has views that concentrate on specific aspects of that staff area. For example, in the Aquatics project, one view highlights threatened and endangered species, another shows the status of the key salmonids as separate themes, while a third emphasizes the probability of occurrence of bull trout species.
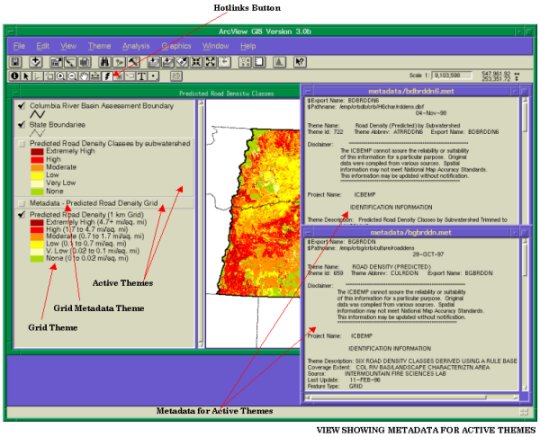
Theme Metadata
If the user needs to look at metadata of a theme, he/she can make that theme active, select the
hotlinks button, and then click on any feature in the display. A window pops up that displays
the metadata of the active theme. The following figure shows the screen as it looks when the
metadata window is opened. If multiple themes are active and features in all the themes are
selected, metadata for all the themes is displayed. When the user is done viewing the metadata,
the window can be closed manually by clicking on the close button on the top right hand
corner of the window.
Layout template
A layout template that duplicates the most popular map template (called the Assessment
template) for ICBEMP page sized maps, was created using the layout tools in ArcView. It was
stored as a layout in each of the ArcView projects. When the end user opens the ArcView
project he/she can store the layout as a template which can then be used to create maps of any
of the views. The instructions document specifies the scale to use for creating the map that can
be overlaid with the ICBEMP maps on the Assessment template.
RIST ArcView Training
As most of the members of RIST were not GIS personnel, an ArcView training session was arranged. At the same training, the RIST CD-ROMs were also handed out along with hard copies of the instructions and exercises.
The first part of the class consisted of basic ArcView training conducted by a certified ArcView trainer who designed his examples using the data available on the RIST CD-ROM. The second part of the training was conducted by the CD author and consisted mostly of hands-on exercises using the ICBEMP data. Four different exercises, based on the various disciplines were created. They were designed to expose the members of the RIST to likely of uses of the data. The exercises started by adding themes to views, using the query builder to limit records, joining tables, creating maps, and running summaries. The first two exercises had step-by-step instructions while the remaining two just stated the problem and the user had to complete the exercises using processes learned in the class. The following examples give a flavor of the types of exercises created for the RIST training.
ArcView Exercises
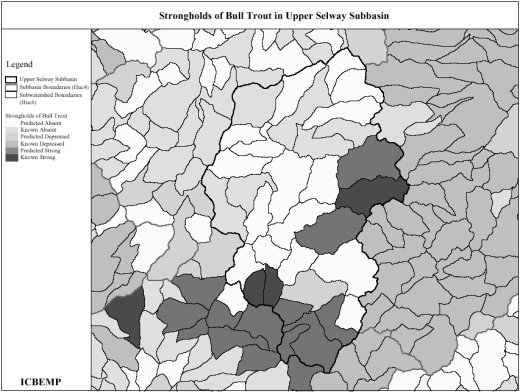
Aquatic 1
Objective: To create a map of the Strongholds of Bull Trout in the Upper Selway Subbasin.
Overview of Process: For creating the map, zoom into the Upper Selway Subbasin and limit the records of the Strongholds of Bull Trout to those that fall only within the Upper Selway Subbasin using a query. Following this, create a layout of the same using the ICBEMP template.
ArcView functions employed: Adding themes into a view, editing the legend, setting the scale of a view, Zooming in, using the Query Builder within the Theme properties dialog box, creating a map layout.
Aquatic 2
Objective: Run summaries of area and percentages of strongholds of bull trout in the Upper Selway Subbasin by each category of stronghold (like, known absent, known depressed, predicted strong, etc.)
Overview of Process: The data for Strongholds of Bull Trout is by subwatershed so, aggregate the data for each category of stronghold to the subbasin level to get areas and percentages for the Upper Selway Subbasin. For example, to calculate area of Known Strongholds, add areas of all the subwatersheds that are classified as 'S.' To calculate percentages divide the total area of the subwatersheds with known strongholds by the total area of the subbasin.
ArcView functions employed: Select by Theme, Sorting records in an attribute table, summarizing records, assigning alias to fields in a table, adding fields to a table, calculating values, statistics, creating reports.
Rangeland
Objectives:
§ To create a layout of the Grazing Allotments that allow grazing in the Spring and/or Summer by Sheep and/or Horse-Mule.
§ To run summaries of area and percentage of the allotments meeting the above criteria to that of all the grazing allotments in the entire basin.
Overview of Process: Run a query to limit the number of records to the two seasons, Spring and Summer, and two types of livestock, sheep and horse-mule. Create a layout at the basin-wide scale. Then add up the area of all the allotments that remain after the query is executed. Divide by the total area of the grazing allotments to get percentage of the allotments that met the criteria.
Economics
Objectives:
§ To create a layout of Timer Dependent Counties.
§ To run summaries of area and percentage of the area that meets the criteria of the total area of counties.
Overview of Process: Using the table 'County Economic Summaries - Evaluation of Alternatives,' select the attribute for Timber Dependence of Counties and display the three categories (Low, Moderate, High) in the view. Use this view to create a layout. Then calculate the area of counties that fall in each of the three categories. Dividing each of them by the total area of counties, gives them as a percentage the total area of counties in the entire basin.
Conclusions
Even though the process of putting together this project was not revolutionary, it enabled non-GIS users to access data efficiently and become familiar with the content of ICBEMP data. The end users learned to use different types of data, like shape files, grids, and database files. They were also able to relate database and attribute files to spatial themes.
The training session was considered extremely useful by all of the participants. It gave them the confidence to start using ArcView and explore the projects. Gradually some of the RIST members have started using the data and projects on the CD-ROM to add new views and do their own analyses. The RIST members have used the CD-ROM to demonstrate the appropriate use of the scientific data to field offices. There have been many requests for the product by people who saw a RIST member using it and considered it an effective tool. Overall, it has been a very successful product as many of the RIST members have adopted the CD-ROM and are using it for their own analyses.
Acknowledgments
I would like to thank Becky Gravenmier for trusting me with this project and letting me develop it in its entirety.
Author Information
Name: Nupur Shankar
Position: GIS/Database Analyst
Organization: Averstar, Inc.
Address: 333 SW 1st Avenue, 4th Floor, ICBEMP, Portland, OR 97204
Phone: (503) 808-2813
Fax: (503) 808-2622
E-mail: nshankar@fs.fed.us