

Using a Geographic Information System, the Global Positioning System and a Relational Database for the Inventory of Abandoned Mines in California
By Michael Tuffly, Gail Newton, Steve Reynolds, Steve Newton-Reed, Eric Miller, Sara Reeves, and Jonathan Mistchenko
Department of Conservation
Office of Mine Reclamation
Abandoned Mine Lands Unit
May 30, 2000
Abstract
Using existing data from the United States Geological Survey coupled with literature, the California Department of Conservation (DOC) embarked on a project to evaluate the magnitude of abandoned mines in California with respect to environmental and human health and safety. The DOC developed a field-sampling regime for two watersheds per bioregion in California. Abandoned mines were sampled for physical and chemical hazards. All mine feature data were coupled with post-processed GPS positions. A relational database was constructed with input forms in Microsoft Access. Spatial analysis with ancillary data was conducted with ArcView.
Introduction
The California Department of Conservation (DOC) conducted an inventory and hazard assessment of abandoned mine sites located in the state, culminating in a report to the Governor and Legislature which details the magnitude and scope of abandoned mine problems in California. Prior to this effort, estimates of the number of abandoned mines varied widely and were based solely on legacy databases. Existing literature and data were collected, input, and spatially analyzed through the implementation of a Geographic Information System (GIS). Data gaps were identified and a field program was implemented to acquire the additional data. Data were collected at selected mine sites, by watershed, in various bioregions throughout the state. Mine features were photographed and precisely located by differentially corrected Global Positioning System (GPS). Field data, in addition to data collected from existing sources, was input into a relational database.
Since the Gold Rush of 1849, tens of thousands of mines have been dug in California. Many of these mines were immediately abandoned when insufficient minerals were found, while others were abandoned later when the economics of the commodity made mining unprofitable. The result is that California�s landscape contains tens of thousands of abandoned mine sites, many of which pose health, public safety, or environmental hazards.
While some information on abandoned mined lands is available from other state, local, or federal agencies, there has not been a statewide clearinghouse for information nor a coordinated statewide effort to address abandoned mine lands in California. The low level of knowledge about the location and impacts of abandoned mines is becoming more evident as the state�s population moves into high-density abandoned mine lands areas such as the Sierran foothills.
Selecting Target Watersheds for Sampling
Due to time constraints (2.75 years), limited financial and staff resources, and the large number of sites, a technique had to be developed to sample a subset of the abandoned mines. Hence, the watersheds became the sampling unit. In order to select "Target Watersheds" to field sample a GIS approach was implemented.
The data sets used to identify our Target Watersheds for sampling are as follows: 1) Jepson Bioregions, 2) Calwater watersheds ver 2.0, and 3) MAS/MILS mineral occurrences. By analyzing all three of these data sets together in a GIS environment 18 watersheds were selected to sample statewide.
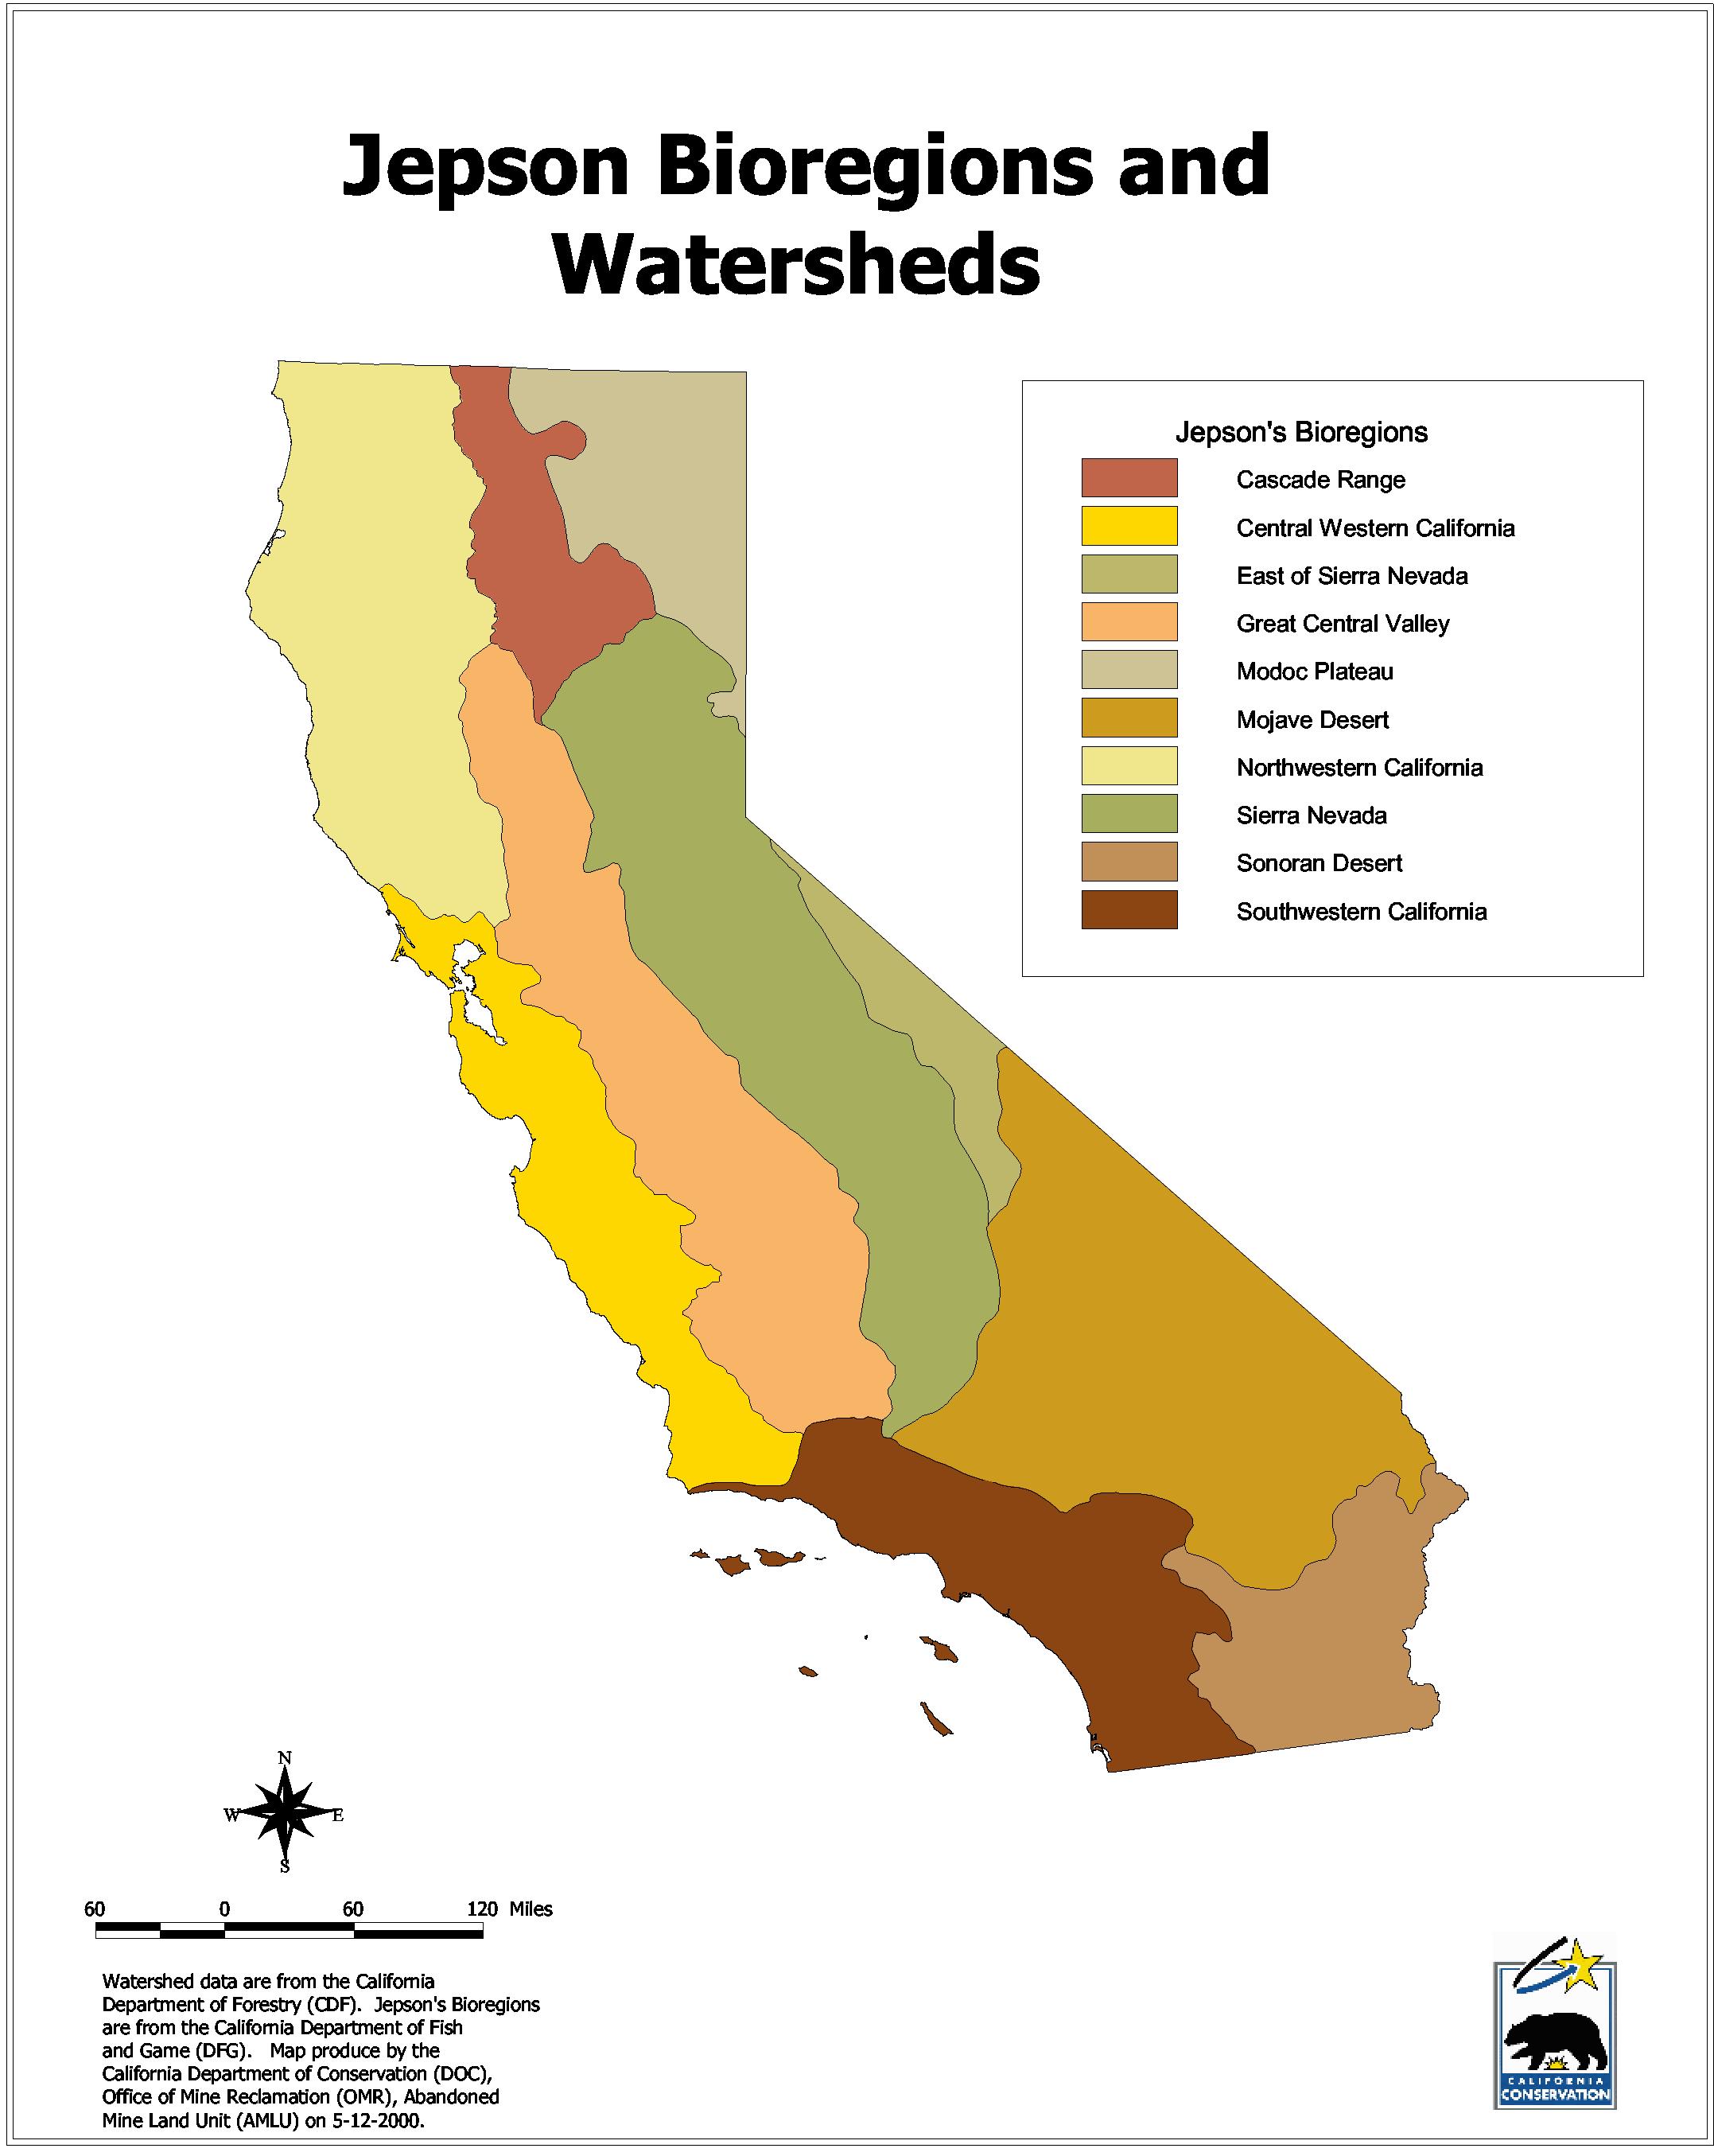
The Jepson Bioregions are partitioned into 10 major units: 1) Central Western California, 2) Cascade Range, 3) Mojave Desert, 4) Sonoran Desert, 5) Great Central Valley, 6) Modoc Plateau, 7) Northernwestern California, 8) Sierra Nevada, 9) East of Sierra Nevada, and 10) Southwestern California (Hickman 1993). The Great Central Valley contains mostly sand and Gravel mining operations, which generally pose few health and safety hazards. Therefore, the Great Central Valley Bioregion was removed from the pool of sampled bioregions; thus, making the total number of Bioregions equal to 9 (Figure 1).
Figure 1
The Calwater watersheds data set depicts 987 unique watersheds or hydrologic regions (HRNAME) for the entire state (Appendix 1). The focus was on a field called Hydrologic Area (HANAME) contained within the Calwater dataset. Each Hydrologic Region is composed of many Hydrologic Areas. There are 519 unique Hydrologic Areas for California. Eliminating all the Hydrologic Areas that were located within the Great Central Valley area reduced the total number of unique Hydrologic Areas for sampling to 511. There are watersheds in the Mojave Desert and the Sonoran Desert Bioregions without a Hydrologic Area name. Hence these unnamed watersheds were named via their hydrologic unit name (HUNAME).
The MAS/MILS data set contains mineral occurrences (Appendix 2). A mineral occurrence can be anything from a major mining operation with scores of openings to a small test pit or mining prospect. There are 29,239 mineral occurrences for California (Figure 2). To ensure that sand and gravel operations, which pose few hazards, did not dominate the selected watersheds, mines for which sand and gravel was their primary commodity were removed. Therefore, 2,187 mineral occurrences were removed from the MAS/MILS dataset that depicted sand and gravel as a primary commodity an additional 1,363 mineral occurrences were remove due to a null values in the commodity field; thus making the total number of mineral occurrences equal to 25,689. For a list of commodities and their frequency that are contained in MAS/MILS see Table 1.
|
Commodity |
Frequency |
|
GOLD |
13994 |
|
STONE |
1669 |
|
COPPER |
1394 |
|
CHROMIUM |
1219 |
|
MANGANESE |
917 |
|
TUNGSTEN |
749 |
|
SILVER |
635 |
|
CLAY |
578 |
|
MERCURY |
534 |
|
CALCIUM |
410 |
|
LEAD |
406 |
|
URANIUM |
282 |
|
IRON |
246 |
|
GEMSTONE |
207 |
|
PUMICE |
197 |
|
TALC |
179 |
|
GYPSUM |
173 |
|
ASBESTOS |
171 |
|
MAGNESIUM |
153 |
|
BARITE |
148 |
|
SILICON |
140 |
|
FELDSPAR |
93 |
|
GEOTHERMAL |
88 |
|
ZINC |
79 |
|
DIATOMITE |
77 |
|
PERLITE |
70 |
|
ANTIMONY |
60 |
|
COAL |
56 |
|
MOLYBDENUM |
55 |
|
TITANIUM |
55 |
|
NICKEL |
53 |
|
BORON |
48 |
|
SODIUM |
48 |
|
BORAX |
46 |
|
GRAPHITE |
43 |
|
FLUORINE |
41 |
|
TIN |
37 |
|
RARE EARTH |
32 |
|
ZEOLITES |
29 |
|
SULFUR |
28 |
|
MICA |
27 |
|
SAND |
24 |
|
QUARTZ CRYSTAL |
23 |
|
ABRASIVE |
21 |
|
WOLLASTONITE |
16 |
|
PLATINUM GROUP |
15 |
|
STRONTIUM |
15 |
|
BERYLLIUM |
13 |
|
ALUMINUM |
12 |
|
KYANITE GROUP |
12 |
|
PETROLEUM |
11 |
|
ARSENIC |
9 |
|
PHOSPHATE |
9 |
|
THORIUM |
9 |
|
NATURAL GAS |
6 |
|
LITHIUM |
5 |
|
POTASH |
4 |
|
NITROGEN |
3 |
|
VERMICULITE |
3 |
|
ZIRCONIUM |
3 |
|
COBALT |
2 |
|
GERMANIUM |
2 |
|
SCANDIUM |
2 |
|
ASH |
1 |
|
BROMINE |
1 |
|
COLUMBIUM |
1 |
|
HAFNIUM |
1 |
|
Total |
25689 |
Figure 2

First, the watersheds were partitioned by the Jepson�s Bioregions. Next, we intersected the Bioregions Watershed dataset with MAS/MILS. Finally, two watersheds per Bioregion that had the highest frequencies of mineral occurrences were chosen for sampling. Therefore, a total of 18 watersheds were select for sampling: 1) Alameda Creek, 2) Hurlong, 3) Lake Shasta Drainage, 4) Lower Owens, 5) Middle Klamath River, 6) North Yuba, 7) Pauline, 8) Point Buchon, 9) Scott River, 10) Shasta Valley, 11) Silurian Hills, 12) South Fork American, 13) Susan River, 14) Upper Owens, 15) Ivanpah, 16) Upper Santa Clara, 17) Lucerne Lake, and 18) Southern Mojave (Figure 3). In addition, Clear Creek, Merced River, and Bear River watersheds were added at requests from stakeholders. The watersheds that were field sampled are listed in Figure 4.
Figure 3

Figure 4

Field Sample Sites
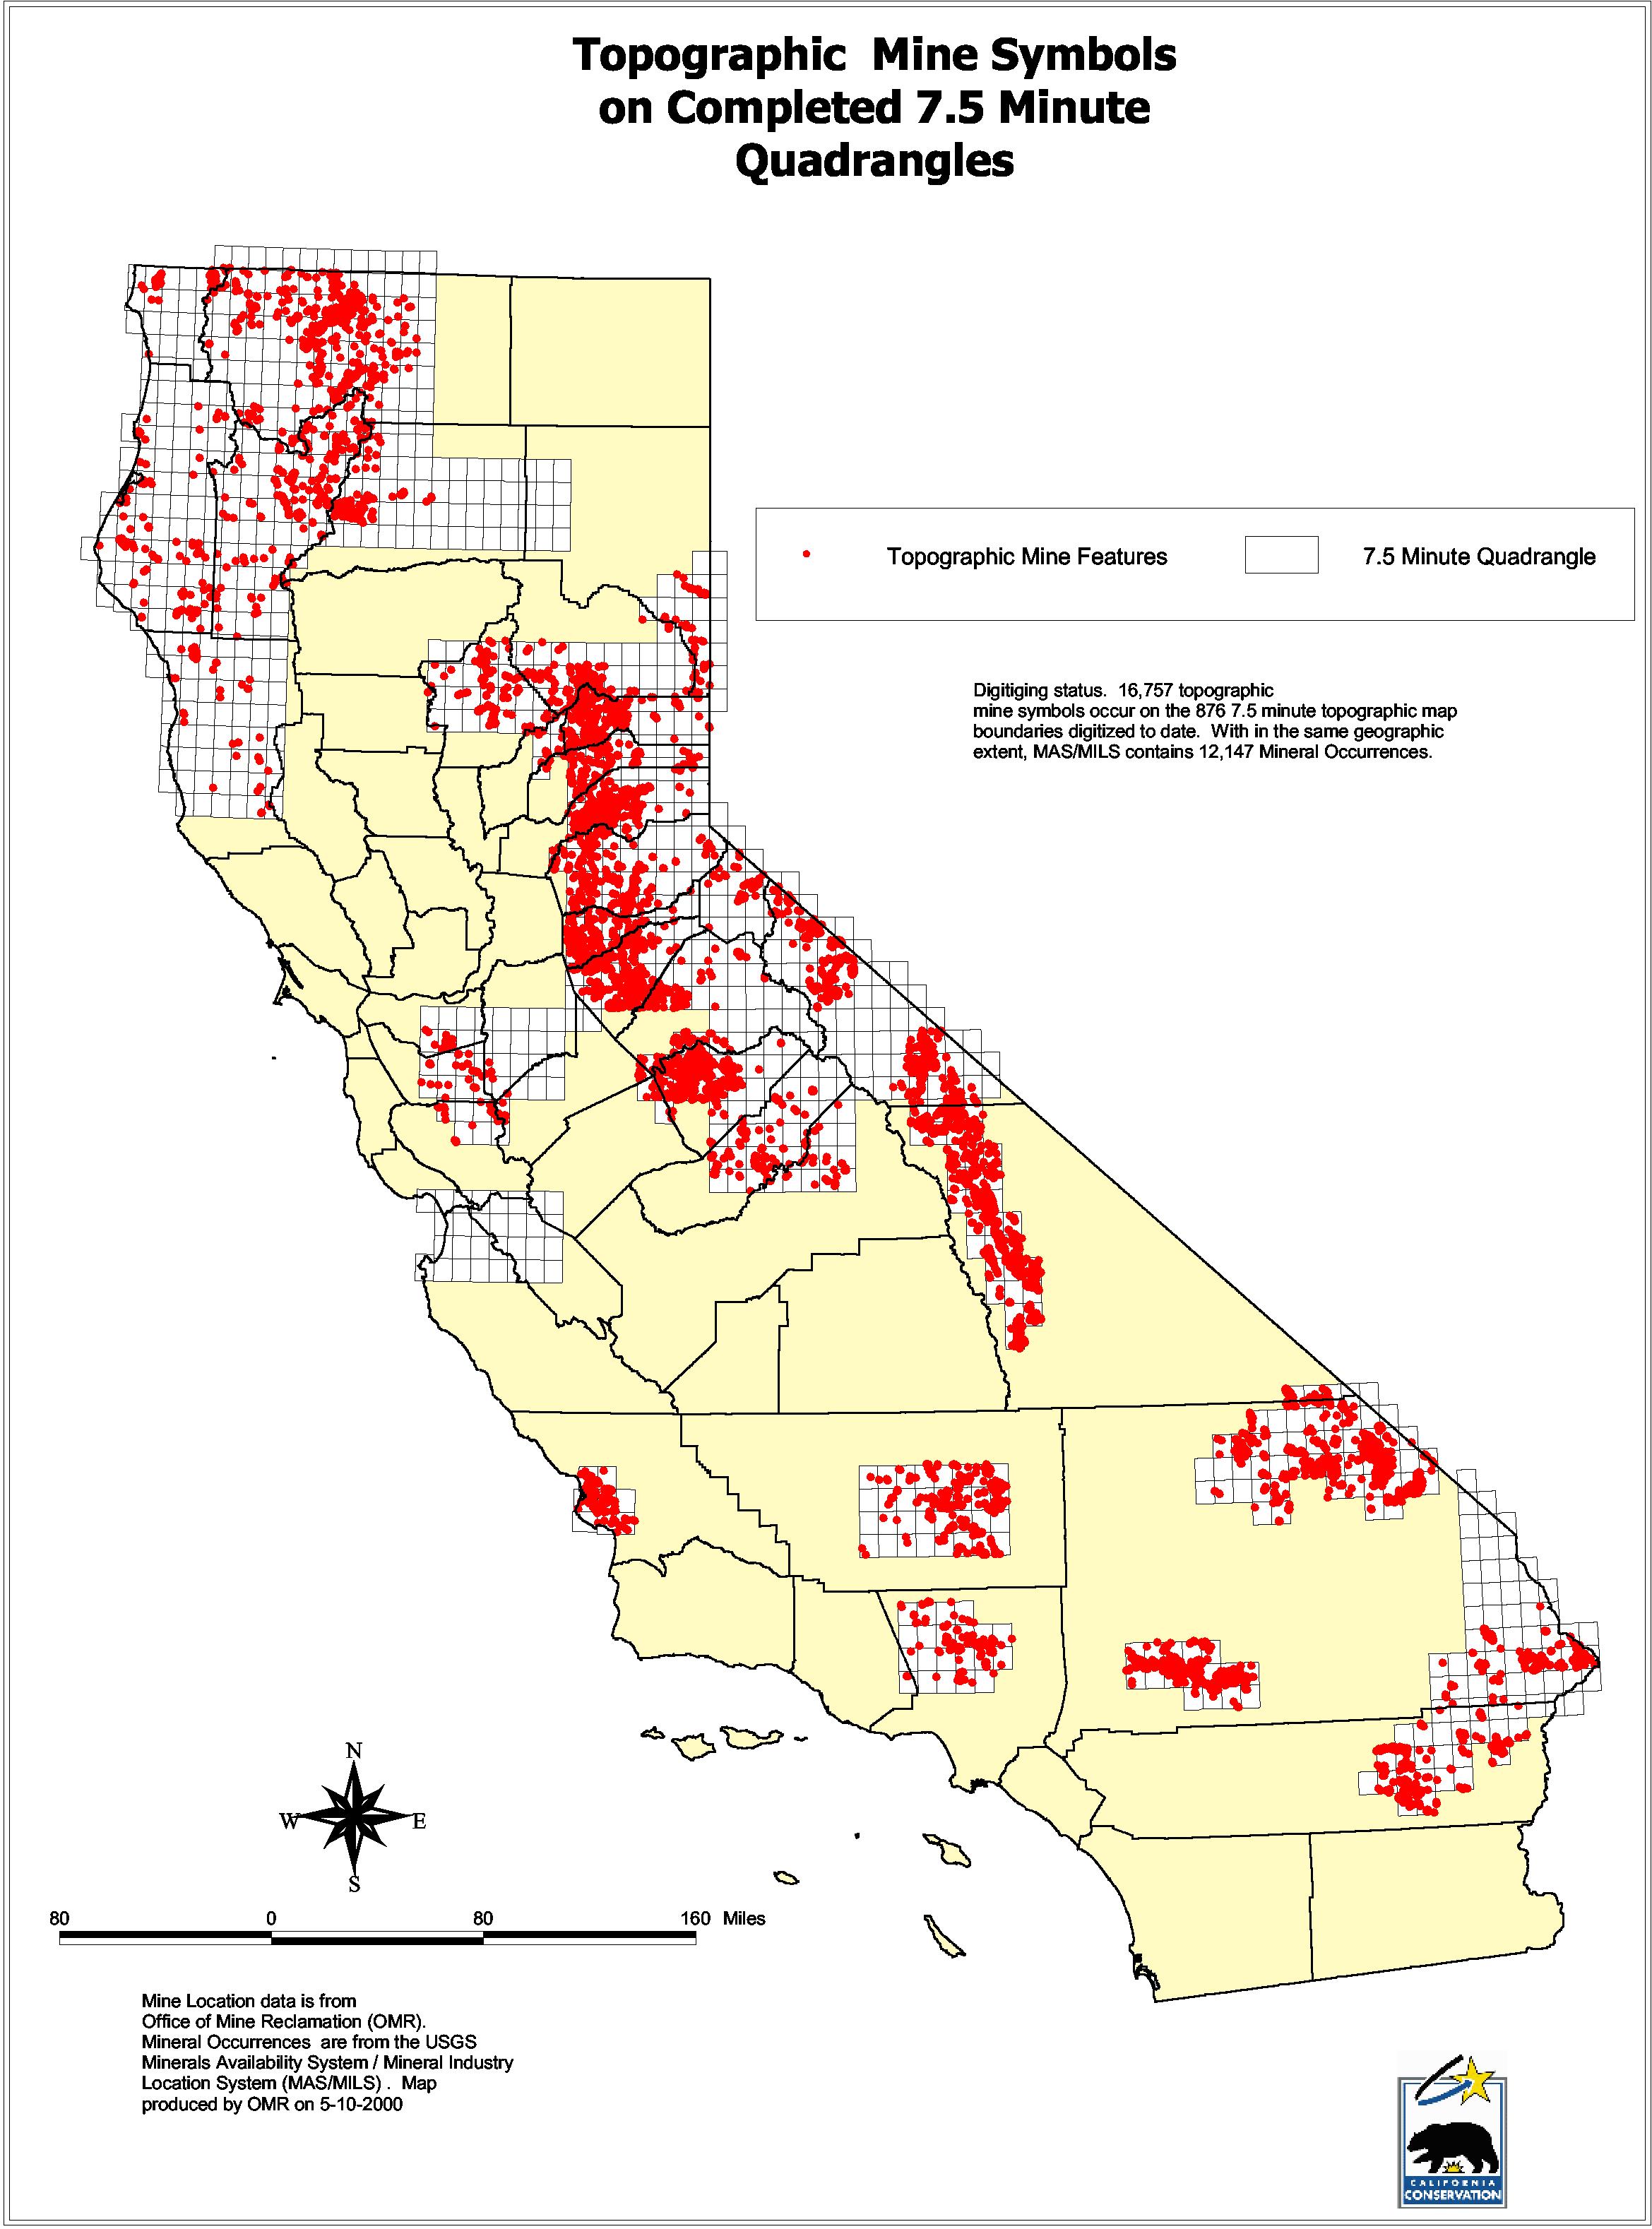
After watersheds were selected, mine sites were chosen for sampling. Due to the generalized site location of MAS/MILS data, a project was started that entailed digitizing and attributing the topographic mine symbols for the selected watersheds, and later the entire state. Preliminary fieldwork indicated that the topographic mine symbols were very reliable with respect to mine location (Figure 5).
Figure 5
A process had to be designed for selection of mine sites to be field sampled. The data sets used for this selection process were 1) topographic mine symbols 2) surface geology, and 3) target watershed. First, the watersheds were stratified by surface geology rocktype. Next, 14 topographic mine symbols per each surface geology rocktype were randomly chosen (Figure 6).
Figure 6

Literature Review
After sample sites were chosen, a literature review of historic mining with the study area was conducted. The type of information sought included dates of operation, types of operation, size of operation, and type of ore processing. Often, no information existed about these mine sites; however, other times detailed information, such as a map of the underground mine workings, existed.
Field Data Collection
A field form was developed and used (Appendix 4) as a guide and data recording tool. In the field, GPS positions were collected for feature location. Digital photographs were taken of each mine feature, and water and soil samples were measured for pH, electrical conductivity, and oxidation-reduction potential. Individual mine features were defined by type, size, and condition.
GPS Data
Two models of GPS units made by Trimble Navigation, Sunnyvale California, were used to collect location data. These models were the GeoExplorer II GPS and the Pro XR. The GeoExplorer II was the "work horse" GPS unit for data collection. The GeoExplorer II and the Pro XR have the following default file naming nomenclature. For example, GPS data collected on May 30th at 4:00 PM, would have the following name R053023A. This GPS file name is broken down as follows: 1) the first character "R" is a GPS unit identifier, 2) the next two numbers "05" are the two digit month, 3) the next two numbers are the two digit day "30", 4) the last two numbers "23" are the time on a 24 clock that is offset by Greenwich Mean Time (GMT) or Universal Coordinate Time (UTC) and 5) the last letter "A" is a file identifier for that first file on that hour. So the second file created in the same hour would be named R053023B. We found that these GPSids had to be unique for each mine feature. Therefore, we concatenated the default GPSids with the 4-digit year and a 4-character user id. This user id consists of the user�s initials for their first, middle, and last name coupled with a sequence number. The sequence number at the end of the user id is there to make sure that no two users have the same user id. The final GPSid now was a 16-character value i.e. R053023A2000MFT1. Trimble Navigation, Pathfinder Office version 2.11 was the software used for downloading, postprocessing, and outputting the GPS data. The output GPS file was an ArcView shapefile that contained 5 fields. The first field was the 16 character unique GPSid. The next four fields were two sets of coordinate data. We used geographic, and a modified Albers equal area conic projection with units in meters as our two coordinate systems (Appendix 3).
GIS
The GIS software used was Environmental Systems Research Institute�s (Esri), in Redlands, California, ArcView ver 3.1. A library subscription of GIS data was purchased from the Stephen P. Teale Data Center in Sacramento, California. The GIS data included watershed boundaries, county boundaries, hydrography and Digital Raster Graphics (DRG�s) 7.5 minute topographic. ArcView extensions and scripts were downloaded, from Esri�s website, to facilitate analysis and data production.
Database
Microsoft Access, Office 97 version, service release 2, was used for the database program (Figure 7). Staff constructed the database data entry forms and a series of related tables. All the data collected from field visits including coordinated data, for point data only, were stored in this database. Database rules were enforced such that a mine feature could not be entered
Figure 7

without having coordinated information associated with the mine feature. Therefore, a function was devised, in the database that would allow the user to copy the coordinated data from the shapefile�s associated database file (dbf) to the database. First, the user enters the GISid into the database via the database form. Next, a file browser is spawned and the user is required to browse to a shapefile�s dbf that contains the same GISid that was previously entered into the database. When the correct dbf is located, and a match on the GISid occurs, the coordinated information in the database is populated. Many more functions, fields and relationships are contained in this database (Figure 8).
Figure 8

Results
After 12 months of fieldwork, 780 mine sites, composed of 3,920 mine features were inventoried from 13 watersheds in 9 Bioregions. California contains 2,869 7.5-minute topographic maps. As of May 2000 over 20,000 mine features on over 1000 7.5-minute topographic maps for mine symbols have been digitized. Preliminary work shows that there are on average three times as many mine features on the ground than the 7.5-minute topographic map depicts; and less than 50% of the abandoned mines are included in the legacy databases.
Conclusion
The exact number and location of all of California�s abandoned mines are not known at this time. During the 12 months allocated to field inventory, 780 mine sites were inventoried and 3,920 mine features recorded.
Storing all the data in the relational database, including the coordinate data, made analysis much easier when compared to using ArcView�s "SQL Connect" function. Using the query capabilities of Microsoft Access allowed users to easily select data, produce an output file, and display the data in ArcView.
The MAS/MILS dataset has many locational discrepancies. However, for statewide analysis MAS/MILS is useful. A map of mine densities for the entire state using MAS/MILS is shown in (Figure 9).
Figure 9

Fieldwork indicates that the 7.5-minute topographic mine symbols are a consistently reliable source of mine location information. Therefore, as soon as all the 2,869 7.5-minute topographic maps for the State are digitized for mine symbols, a more reliable statewide mine density map can be created. However, the 7.5-minute topographic mine symbols have limited use. That is, 7.5-minute topographic mine symbols have no ancillary information such as mined commodity, dates of operation, and size of operation. Once ancillary information from MAS/MILS is linked to the mine symbols database, the combined dataset will be very useful to land managers.
A preliminary relationship exists such that there are approximately three mine features on the ground to each mine feature on the topographic map. In order to get an estimate on number of mine features for California we will need to use this three to one relationship. However, the entire State is not digitized for mine symbols. Therefore, this three to one relationship may change as more maps are digitized. As soon as the entire State is digitized, and more mine sites are field visited, a more reliable statistic for the relationship between the map and the field can be calculated.
The relational database of abandoned mines, linked with data collected from other agencies, has been developed and implemented. Additionally, an abandoned mine GIS has been developed and implemented which allows the spatial and statistical analyses necessary to evaluate abandoned mine sites.
Appendix 1
CALIFORNIA WATERSHED MAP (CALWATER) METADATA ("calw20.txt" 1998.09.21)
ENTER DATA AFTER "::" EXCERPT OF ARC/INFO LOG FILE APPENDED BELOW METADATA
1.0 Identification Information
1.1 Citation Information
1.11 Originator::Interagency California Watershed Mapping Committee
1.12 Title::California Watershed Map (CALWATER 2.0)
1.13 Type of Data::ARC/INFO polygon coverage
Serial Information
1.21 Serial Name::calwater version 2.0
1.22 Issue Identification::calw20
Publication Information
1.23 Publication Place::Sacramento
1.24 Publisher::Interagency California Watershed Mapping Committee (ICWMC)
1.25 Publication Date::1998.09.21 (September 21, 1998)
1.26 Other Citation Details::
The ARC/INFO coverage of CALWATER 2.0 described herein, distributed by the
California Department of Fish and Game (DFG), is called "calw20" and is
dated September 21, 1998 for its boundary data content. This coverage
was received from the State of California Stephen P. Teale Data Center
GIS Lab (Teale). Teale is under contract to the California Department of
Water Resources (DWR) for this project; DFG is an in-kind cooperator.
Previous citations as CALWATER 2.0, December 1996, apply to the ARC/INFO
coverage named "cawastat", the source for hardcopy maps distributed by
Teale for review by the State Water Resources Control Board (SWRCB) and
each of the nine Regional Water Quality Control Boards (RWQCB) statewide.
Cross-referenced federal Hydrologic Unit Codes (HUC) and names, also known
as Cataloging Units (CU) were taken from USGS Water Supply Paper 2294
(USGS 1986) and added to calw20. Details of the cross-referencing process
are given below.
A draft Memorandum of Understanding (MOU) titled "Regarding the Use and
Maintenance of the California Watershed Map" (DWR 3/5/97) has been prepared
for the purpose of promoting the use, management, and maintenance of a
common watershed map of California. MOU signatories include the following
state and federal agencies with water resources, water quality, soils,
forest, watershed, fish, and wildlife habitat responsibilities.
CALWATER 2.0 should not be confused with CALWATER 2.2, in work by the
ICWMC and Teale. Calwater 2.2 will contain subdivided CALWATER 2.0
polygons. See metadata contact below for additional information.
ICWMC Member Agencies:
California Department of Water Resources (DWR)
California Department of Forestry and Fire Protection (CDF)
California Department of Fish and Game (DFG)
California State Water Resources Control Board (SWRCB)
USDA Forest Service (USFS) Pacific Southwest Region (R5)
USDA Natural Resources Conservation Service (NRCS)
USDI Geologic Survey (USGS)
USDI Bureau of Reclamation (USBR)
USDI Bureau of Land Management (BLM)
US Environmental Protection Agency (USEPA) Region IX
Stephen P. Teale Data Center (Teale)
1.3 Data Set Description and Status
Description::
1.31 Abstract ::The California Watershed Map (CALWATER version 2.0)
is a set of standardized watershed boundaries meeting standardized
delineation criteria. The hierarchy of watershed designations consists
of four levels of increasing specificity: Hydrologic Region (HR),
Hydrologic Unit (HU), Hydrologic Area (HA) , and Hydrologic Sub-Area (HSA).
The primary purpose of Calwater is the assignment of a single, unique
code to a specific watershed polygon. While there are 987 polygons in
the ARC/INFO coverage, there are actually fewer watershed codes. This
is due to cases of multiple polygons bearing the same watershed code
(Channel Islands, split polygons due to other boundary integration,
e.g. ground water basins). Another confusing factor is that not all
Hydrologic Units are subdivided into Hydrologic Areas, and not all
Hydrologic Areas are subdivided into Hydrologic Sub-Areas. Therefore,
a nominal count of watershed codes in Calwater 2.0 is:
Hydrologic Regions: 10
Hydrologic Units: 182
Hydrologic Areas: 462
Hydrologic Sub-Areas: 622
1.32 Purpose::Mapping, reporting, and statistical analysis of water
resources, water supply, water quality, wildlands, agriculture, soils,
forests, rangelands, fish habitat, wildlife habitat, cross-referencing
state and federal hydrologic unit or watershed codes and names.
1.33 Supplemental Information::
POLYGON ATTRIBUTE TABLE (.PAT)
COL ITEM NAME WIDTH TYPE N.DEC DESCRIPTION
1 AREA 18 F 5 Area of polygon, square meters
9 PERIMETER 18 F 5 Perimeter of polygon, meters
17 CALW20# 4 B - Polygon Attribute Table record number
21 CALW20-ID 4 B - User-assignable identifier
25 IDNUM 8 N 2 ID NUMber of watershed (SWRCB/RWQCB)
33 HRC 2 C - Hydrologic Region Code (DWR)
35 HBPA 2 C - Hydrologic Basin Planning Area (SWRCB)
37 HR 2 I - Hydrologic Region (1->10)
39 RB 1 I - Regional water qual.cont. Board (1->9)
40 HU 2 I - Hydrologic Unit (00->~80)
42 HA 1 I - Hydrologic Area (0->9)
43 HSA 1 I - Hydrologic Sub-Area (0->9)
44 RBU 5 I - Integer ID of HU: Aggregate HR,RB,HU
49 RBUA 6 I - Integer ID, HA: Aggr. HR,RB,HU,HA
55 RBUAS 7 I - Int. ID, HSA: Aggr. HR,RB,HU,HA,HSA
62 HRNAME 35 C - Hydrologic Region Name
97 HUNAME 35 C - Hydrologic Unit Name
132 HANAME 35 C - Hydrologic Area Name
167 HSANAME 35 C - Hydrologic Sub-Area Name
202 ACRES 4 F 1 Acreage of watershed polygon
206 CU 8 I - Cataloging Unit (Fed. HUC), overlap #1
214 CUNAME 48 C - Cataloging Unit name, overlapping CU #1
262 CU2 8 I - Cataloging Unit, overlapping CU #2
270 CU3 8 I - Cataloging Unit, overlapping CU #3
Projection: Albers conic equal-area, standard Teale parameters
Datum: NAD 27
Projection: Albers
Units: meters
1st Std. Parallel: 34 00 00
2nd Std. Parallel: 40 30 00
Longitude of Origin: -120 00 00
Latitude of Origin: 00 00 00
False Easting (X shift): 0
False Northing (Y shift): -4,000,000
NOTE: This text file is prepended to the standard ARC/INFO log file
calw20/log, which contains the coverage's processing history.
Lookup Table of California Hydrologic Region Names and Codes
Codes for Hydrologic Regions and other administrative entities are
cross-referenced in the table below. Ten Hydrologic Regions are
coded numerically by DWR, whereas there are nine Regional Water Quality
Control Boards, with offices in twelve Hydrologic Basin Planning Areas
(HBPA). DWR identifies three HRs in the Central Valley to SWRCB's one
"Region", and SWRCB identifies three RWQCBs in DWR's one South Coast HR.
The two-letter abbreviations SR and SB both refer to the Sacramento
River basin. Other single-letter codes are used in DWR Bulletin 130-85
"Hydrologic Data 1985", and other DWR publications.
Federal Hydrologic Unit Codes (4-digit HUC) Sub-Region codes and names
are also provided. Note that some state designations map to more than
one federal designation. More detailed HUC designations terminate
with the 8-digit HUC, the Cataloging Unit (CU) (USGS 1986, Water Supply
Paper 2294). Detailed, polygon-by-polygon lookup is also possible with
the CU, CU1, CU2, etc codes in the ARC/INFO Polygon Attribute Table above.
KEY to Table
HR: DWR Hydrologic Region (1->10)
RB: Regional Water Quality Control Board (1->9)
BC: DWR Basin Code (1-letter; Bulletin 130-85; Surface Water data)
AC: DWR Areal Code (1-letter; Areal Designation Map; Climate, Grd.Water)
HRC: DWR Hydrologic Region code (2-letter name abbreviation, var. pubs.)
HBPA: SWRCB Hydrologic Basin Planning Area (2-letter name abbreviation)
SUBR: USGS Hydrologic Unit Code (HUC) Sub-Region; incl. border states.
---
HR RB BC AC HRC DWR HR Name HBPA SWRCB/RB Name SUBR
-- -- -- -- --- ----------------- ---- ----------------- --------------
1 1 F F NC North Coast NC North Coast 1801,1710
2 2 E E SF San Francisco Bay SF San Francisco Bay 1805
3 3 D T CC Central Coast CC Central Coast 1806
4 4 Z U SC South Coast LA Los Angeles 1807
5 5 A A SR Sacramento River SB Sacramento Basin 1802
6 5 B B SJ San Joaquin River SJ San Joaquin 1804
7 5 C C TL Tulare Lake TL Tulare Lake 1803
8 6 G G NL North Lahontan NL North Lahontan 1808,1604,1605
9 6 V W SL South Lahontan SL South Lahontan 1809,1606
10 7 W X CR Colorado River CR Colorado River 1810,1503
- 8 Y Y -- (not defined) SA Santa Ana 1807
- 9 X Z -- (not defined) SD San Diego 1807
HR SUBR Federal HUC Hydrologic Sub-Region Name (Remarks)
-- ---- -------------------------------------------------------------
1 1801 Klamath-Northern California Coastal (incl. upper Klamath, OR)
1 1710 Oregon-Washington Coastal (minor CA portion of OR drainages)
2 1805 San Francisco Bay
3 1806 Central California Coastal
4 1807 Southern California Coastal
5 1802 Sacramento
6 1804 San Joaquin
7 1803 Tulare-Buena Vista Lakes
8 1808 North Lahontan (incl. portions of NV basins draining into CA)
8 1604 Black Rock Desert-Humboldt (minor CA portion of NV basins)
8 1605 Central Lahontan (includes Tahoe basin and portions of NV)
8 1712 Oregon Closed Basins (minor CA portion near Goose Lake)
9 1809 Northern Mojave-Mono Lake (minor NV portions included)
9 1606 Central Nevada Desert Basins (minor CA portion)
10 1810 Southern Mojave-Salton Sea
10 1503 Lower Colorado (includes CA portion west of Colorado River)
Details on the Polygon-by-Polygon Lookup Information by Andy Richardson,
Teale GIS Solutions Group, andy@teale.ca.gov; revised by pveisze.
-- begin details --
IDNUM TO HUC CROSSWALK
The IDNUM to HUC cross-reference was developed with the following rules:
For a given [state] Calwater watershed, overlapping [federal] Hydrologic
Unit Codes (at the 8-digit Cataloging Unit [CU] level) are listed up to
a maximum of 80% of the Calwater watershed OR three CUs, whichever comes
first.
For example:
Where there is only one CU code listed for a given Calwater watershed
code, that CU overlaps at least 80% of the Calwater watershed.
Where there are two CU codes (CU and CU2) listed for a given Calwater
code (only 19 watersheds fit this criterion), the largest CU alone
overlaps less than 80% of the Calwater watershed, but combining CU2
then provides overlap of at least 80% of the Calwater watershed.
Where there are three CU codes (CU, CU2, and CU3) listed for a given
Calwater watershed (only 4 watersheds fit this criterion), the largest
2 CUs together overlap less than 80% of the Calwater watershed; combining
a third CU code produces additional overlap. Complete overlap statistics
are left for calculation by the user.
If a watershed consists of multiple polygons (because it is split by the
groundwater line, the state boundary, or it is comprised of multiple
islands), the total area of the watershed (the sum of all the polygons)
is the value entered in the ACRES item. The individual polygons of a
multi-polygon watershed all have the same watershed code. These cases
are itemized below:
LEGITIMATE DUPLICATE CODES (MULTIPLE POLYGONS FOR A SINGLE WATERSHED)
Count, RBUAS, Name (Remarks) ('' means no name)
5 331610 - San Miguel Island (Channel Islands)
HSANAME = ''
6 440610 - Anacapa Island (Channel Islands)
HSANAME = ''
3 440630 - Santa Barbara Island (Channel Islands)
HSANAME = ''
2 440813 - Point Mugu Lagoon (Has a separation)
HSANAME = Point Mugu Lagoon
6 484515 - Los Angeles / Santa Ana border (county line split)
HSANAME = Central (Split)
2 484562 - Los Angeles / Santa Ana border (county line split)
HSANAME = La Habra (Split)
2 551425 - Below Folsom Lake - groundwater line split
HSANAME = Linda Creek
2 654241 - Split by groundwater line
HSANAME = Unknown
2 960942 - Split by California - Nevada border
HSANAME = Shoshone
Count, RBUA, Name (Remarks)
5 33161 - San Miguel Island (Channel Islands)
HANAME = San Miguel Island
6 44061 - Anacapa Island (Channel Islands)
HANAME = Anacapa Island
3 44063 - Santa Barbara Island (Channel Islands)
HANAME = Santa Barbara Island
6 48451 - Los Angeles / Santa Ana border (county line split)
HANAME = Lower San Gabriel
2 48456 - Los Angeles / Santa Ana border (county line split)
HANAME = Anaheim
2 65424 - Split by groundwater line
HANAME = Panoche Creek
2 96094 - Split by California - Nevada border
HANAME = Amargosa Desert
Count, RBU, Name (Remarks)
2 1102 - Split by California - Oregon border
HUNAME = ROGUE RIVER
7 3316 - San Miguel, Santa Rosa, Santa Cruz Islands (Channel Islands)
HUNAME = SANTA BARBARA CHANNEL ISLANDS
12 4406 - The rest of the Channel Islands
HUNAME = SAN PEDRO CHANNEL ISLANDS
2 4481 - Los Angeles / Santa Ana border (county line split)
HUNAME = SANTA ANA RIVER
2 4845 - Los Angeles / Santa Ana border (county line split)
HUNAME = SAN GABRIEL RIVER
2 6542 - Split by groundwater line
HUNAME = MIDDLE WEST SIDE
Count, RB, Name (Remarks) (RB = Regional Water Quality Control Board)
8 3 - Channel Islands
RBNAME = Central Coast (CC)
13 4 - Channel Islands
RBNAME = Los Angeles (LA)
Count, HR, Name (Remarks) (HR = DWR Hydrologic Region)
8 3 - Channel Islands
HRNAME = Central Coast
13 4 - Channel Islands
HRNAME = South Coast
-- end details --
1.34 Time Period of Content::1978 - 1998.09.21
1.35 Progress::Watershed boundary revisions by Regional Water Quality
Control Boards and the U.S. Forest Service in progress.
See Data Contact below.
1.36 Maintenance and Update Frequency::as needed
1.4 Geographic Content::
1.41 Quads::
1.42 Lat/long::
1.43 Calwater:: self, version 2.0, California, statewide
1.44 County:: all
1.45 Other:: Interagency watershed boundaries
1.5 Keywords::California, water, map, watershed boundaries, hydrologic unit
codes, river basin names, statistics, water quality, planning
1.6 Constraints
1.61 Access Constraints::none
1.62 Use Constraints::none
2.0 Data Quality Information::
The following comments are subjective remarks:
CALWATER boundaries were digitized on a 1:24,000-scale base and thus
very accurately divide surface water features depicted on 1:100,000-scale
Digital Line Graph hydrography. However, CALWATER delineations are
primarily designed to be administrative reporting units, and the
boundaries should not be used to define authoritative drainage area above
a given point as a portion of their definition includes non-physical
boundaries, particularly in valley floor and urbanized coastal regions.
Attribute completeness is good. Compatibility with existing state and
federal watershed delineations is good, except where explicitly different
boundary configurations are applied.
2.1 Scale::1:24,000
3.0 Data Location
3.1 Storage Location::Teale GIS Solutions Group and
Department of Fish and Game
3.2 OnLine Linkage URL::ftp://maphost.dfg.ca.gov/outgoing/itb/calwater
4.0 Metadata Reference Information
4.1 Metadata date::1998.09.21 (September 21, 1998)
4.2 Metadata Contact::Paul Veisze
4.3 Metadata Contacts Organization::California Department of Fish and Game
4.4 Metadata Contacts Address::1416 Ninth Street
City::Sacramento
State::CA
Zip Code::95814
4.5 Metadata Contacts Voice Telephone::916-323-1667
4.6 Metadata Contacts Fax::916-323-1431
4.7 Metadata Contacts Email::pveisze@dfg.ca.gov
4.8 Metadata Standard Name::UC Davis/ICE/CARA
4.9 Metadata Standard Revision::
5.0 Data Contact Information
5.1 Contact Person Primary::Richard Neal
5.2 Contact Organization::California Department of Water Resources
5.3 Contact Address::1416 Ninth Street
City::Sacramento
State::California
Zip Code::95814
5.4 Contact Voice Telephone::916-653-7574
5.5 Contact Fax::916-653-6077
5.6 Contact email::rneal@water.ca.gov
Appendix 2
U.S. DEPARTMENT OF THE INTERIOR
U.S. GEOLOGICAL SURVEY
Active-, inactive-, and abandoned-mine
information and selected geochemical data
for the State of California
by
Jean L. Ryder*
Open-File Report 96-004 Diskette
This report is preliminary and has not been reviewed for conformity with
U.S. Geological Survey editorial standards and stratigraphic nomenclature.
Any use of trade, product, or firm names is for descriptive purposes only
and does not imply endorsement by the U.S. Government.
*U.S. Geological Survey, DFC, Box 25046, MS 973, Denver, CO 80225
1996
CONTENTS
INTRODUCTION . . . . . . . . . . . . . . . . . . . . . . . . . . . . .1
USGS DATABASES . . . . . . . . . . . . . . . . . . . . . . . . . . . .1
RASS and PLUTO . . . .. . . . . . . . . . . . . . . . . . . . .1
MRDS . . . . . . . . .. . . . . . . . . . . . . . . . . . . . .3
MILS . . . . . . . . .. . . . . . . . . . . . . . . . . . . . .4
Acknowledgements . . . . . . . . . . . . . . . . . . . . . . . . . . .4
References Cited . . . . . . . . . . . . . . . . . . . . . . . . . . .4
i
INTRODUCTION
The digital data files presented on this disk comprise selected
information from United States Geological Survey (USGS) databases
related to active and inactive mine locations in the state of California
and may be of use to people involved with environmental remediation and
contamination work.
This report can be downloaded via 'anonymous ftp' from the USGS
system named greenwood.cr.usgs.gov (136.177.48.5). The files are located
in the directory /pub/open-file-reports/ofr-96-0004.
The database manager is: Jean L. Ryder
(303) 236-1191
jryder@helios.cr.usgs.gov
U.S. Geological Survey
Box 25046, Mail Stop 973
Denver, CO 80225-0046
Disclaimers:
The databases, identified as RASS, PLUTO, MRDS, and MILS have been
approved for release and publication by the Director of the USGS.
Although these databases have been subjected to rigorous review and are
substantially complete, the USGS reserves the right to revise the data
pursuant to further analysis and review. Furthermore, it is released on
condition that neither the USGS nor the United States Government may be
held liable for any damages resulting from its authorized or unauthorized use.
Although the program LHA.COM ((c)Yoshizaki,1988-91) was used by the
USGS to archive these files, no warranty, expressed or implied, is made by
the USGS as to the accuracy and operation of the program and related program
material, nor shall the fact of distribution constitute any such warranty,
and no responsibility is assumed by the USGS in connection therewith.
USGS DATABASES
The National Geochemical Database is a collection of geochemical
information maintained by the USGS and consists of five separate databases.
The data retrieved here are from the Rock Analysis Storage System (RASS),
PLUTO, Mineral Resource Data System (MRDS), and Minerals Availability System
(MILS) databases.
MILS
The Minerals Industry Location Systems database provides information on
locations of mines, their operational status, and information about the
minerals at those locations. The California MILS data set contains over
29,000 sites with 64 fields of data. The data on this diskette includes
only the fields consisting of sequence number, name of deposit, deposit type,
current status, location, and point of reference for all 29,096 sites. The
column listed as Sequence Number is composed of ten digits attributed as
follows:
Digits: 1-3 refer to the state code (006 for California)
4-6 refer to the county/province code used by the Department of
Commerce
7-10 designate a unique deposit reference number assigned to
each deposit within the state and county
The Point of Location column lists the point from which the latitude and
longitude were determined. For further information on any of these databases,
contact the database manager listed at the beginning of this report.
Projection Information:
Datum: NAD 27
Projection: Albers
Units: Meters
1st Std. Parallel: 34 00 00 (34.0 degrees N)
2nd Std. Parallel: 40 30 00 (40.5 degrees N)
Longitude of Origin: -120 00 00 (120.0 degrees W)
Latitude of Origin: 00 00 00 (0.0 degrees N)
False Easting (X shift): 0
False Northing (Y shift): -4,000,000
Acknowledgements
The author wishes to thank Baiba Barr, Mary Berger, and David Buckingham
for their invaluable assistance in providing the data retrievals included in
this report.
References Cited
Arbogast, B.F., ed., 1990, Quality assurance manual for the Branch of
Geochemistry, U.S. Geological Survey: U.S.Geological Survey Open-File
Report, 90-668, 184 p.
LHA version 2.12, Copyright (c) Haruyasu Yoshizaki, 1988-91, A High-Performance
File-Compression Program, 3/21/91.
Appendex 3
Projection Information:
Datum: NAD 27
Projection: Albers
Units: Meters
1st Std. Parallel: 34 00 00 (34.0 degrees N)
2nd Std. Parallel: 40 30 00 (40.5 degrees N)
Longitude of Origin: -120 00 00 (120.0 degrees W)
Latitude of Origin: 00 00 00 (0.0 degrees N)
False Easting (X shift): 0
False Northing (Y shift): -4,000,000
Appendix 4
|
|
DEPARTMENT OF CONSERVATION - OFFICE OF MINE RECLAMATION HISTORIC, INACTIVE, AND ABANDONED MINE LANDS FIELD INVENTORY FORM |
|
OMR ID |
|
|
|
Mine Name |
|
|
||||||||
|
County |
|
|
|
District |
|
|
||||||||
|
Date |
|
|
|
AML Status |
|
Abandoned Inactive Active Mitigated Reclaimed Unk |
||||||||
|
Field Crew |
|
|
|
AML Status Notes |
|
|
||||||||
|
GPS User |
|
|
|
|
|
|
||||||||
|
Notetaker |
|
|
|
County Status |
|
Abandoned Inactive Active Mitigated Reclaimed Unk |
||||||||
|
Data Source |
|
|
|
County Status Notes |
|
|
||||||||
|
Photo |
|
|
|
|
|
|
||||||||
|
GIS ID (Site) |
|
|
|
Latitude |
|
|
||||||||
|
GIS Type |
|
Point Line Poly |
|
Longitude |
|
|
||||||||
|
GIS Accuracy |
|
Unk 15' 66' 328' 2700' |
|
Elevation |
|
|
||||||||
|
Quad Code |
|
|
|
Quad Name |
|
|
||||||||
|
Township |
|
|
|
Activity Type |
|
Rec Area Campground Trail Workplace |
||||||||
|
Range |
|
|
|
|
|
Road Dwelling School Town Urban |
||||||||
|
Section |
|
|
|
Activity Distance |
|
|
||||||||
|
Subsection |
|
|
|
Operation Type |
|
Dredge Min Loc/Prospect Pit/Quarry |
||||||||
|
Base Meridian |
|
|
|
|
|
Placer Proc Plant/Mill Underground Unk |
||||||||
|
Ownership |
|
Owner Corp Private |
|
OP Begin Date |
|
|
||||||||
|
|
|
Secondary Agency |
|
OP Ending Date |
|
|
||||||||
|
Commodity (s) |
|
|
||||||||||||
|
Company |
|
|
|||||||||||||||||||||||||||||||||
|
First Name |
|
|
|
Last Name |
|
|
|||||||||||||||||||||||||||||
|
Address Line 1 |
|
|
|||||||||||||||||||||||||||||||||
|
Address Line 2 |
|
|
|||||||||||||||||||||||||||||||||
|
City |
|
|
|
State |
|
|
|
Zip |
|
|
|||||||||||||||||||||||||
|
Phone 1 (W) |
|
|
|
Extension 1 (note) |
|
|
|||||||||||||||||||||||||||||
|
Phone 2 (H) |
|
|
|
Extension 2 (note) |
|
|
|||||||||||||||||||||||||||||
|
FAX |
|
|
|
|
|
|
|||||||||||||||||||||||||||||
|
Watershed |
|
|
|
Rocktype |
|
|
|||||||||||||||||||||||||||||
|
Openings Found |
|
|
|
Hazardous Openings |
|
|
|
USGS Topo Openings |
|
|
|||||||||||||||||||||||||
|
Total Waste Found (yds3) |
|
|
|
USGS Topo Waste Features (yds3) |
|
|
|||||||||||||||||||||||||||||
|
Visitation Type |
|
Random PAMP Site 877 Call Public Concern Non-Random Other |
|||||||||||||||||||||||||||||||||
|
Other Databases (ID Number) |
|
PAMP Found 1 (DMG Hg) GNIS MAS/MILS DMG Minefile |
|||||||||||||||||||||||||||||||||
