Rita Walton, Mike Corlett, Cathy Arthur, Anubhav Bagley
A Subarea Allocation Model for the Phoenix Metropolitan Area
A Subarea Allocation Model (SAM) has been developed to forecast residences,
employment and special population groups by 1500+ Traffic Analysis Zones
for the Phoenix metropolitan area. The TAZ forecasts for 2000–2020 are
currently used by the Maricopa Association of Governments to prepare regional
transportation, environmental and human services plans. SAM can also be
used to design and evaluate alternative land use scenarios. Planners can
interactively alter land use polygons and assess the impact on jobs/housing
balance, infill, and urban form.
Introduction
Planners, developers, real estate brokers, and anyone else whose job
depends on keeping a close watch on real estate development can give you
a pretty good educated guess about what land in a region is likely to be
built, and what land is likely not to be built, based on their knowledge
of land costs, zoning factors, infrastructure availability, water and utility
access, site access and visibility, environmental conditions, city development
review practices, and local market conditions. Or, as they say, there are
three factors that dictate the success of a business: "location, location,
and location."
Quantifying opinions about future growth patterns is certainly impractical
on a massive scale such as in Maricopa County, where there are over a million
parcels covering more than 9,000 square miles and land development forecasts
are needed to place over 1.5 million new people over the next 25 years.
Even if land use forecasts are needed at five year intervals over the next
four decades, urban growth models should still take into consideration
the same factors that interest developers
SAM-IM is a rule-based urban growth model. It simulates both short-term
and long-term urbanization of a region by reacting to any set of factors
and conditions that the planner wishes to express. The model is completely
embedded in a Geographic Information System (GIS) – it runs on ArcView
GIS using the Spatial Analyst extension. The concept of the model is entirely
GIS oriented – all of the data that drives the model, whether it be existing
land use distributions, future market conditions, adopted planned land
use, developments already approved and underway, or local land conditions,
are expressed geographically, in the form of ArcView shape files. Anything
that can be expressed geographically can be taken into consideration in
the model.
This paper describes the SAM-IM suite of modeling applications that
have been developed to support land use forecasting at the Maricopa Association
of Governments, the Metropolitan Planning Organization (MPO) and regional
planning agency for the Phoenix metropolitan area.
GIS at MAG
The Maricopa Association of Governments (MAG) is responsible for regional
land use, transportation, and air quality modeling for the Phoenix metropolitan
area. Like other regional governments with similar MPO responsibilities,
MAG has been seeking to improve the performance of these models, thereby
making the regional planning process more effective. GIS has played a major
role at MAG for the past twelve years. This technology has significantly
enhanced MAG’s ability to manage dozens of planning databases: databases
describing census statistics, employment inventories, land use, general
plans, parcels, building permits, and highway infrastructure – all sharing
one common characteristic -- they are essentially spatial in nature. GIS
helps MAG assume an important responsibility in the region – the role of
regional information agency for public planning.
GIS has capabilities that run far beyond just being a platform for planning
and mapping. In recent years, MAG has been developing new classes of planning
models that run directly on top of GIS. This new class of models works
directly from GIS databases. More importantly, these models tap a wide
variety of powerful spatial analysis methods that are found only in GIS
and can not be even remotely matched by older custom-written programs developed
over the last three decades. In the long term, this new class of GIS-based
models offers the potential for completely replacing older, non-spatial
planning models.
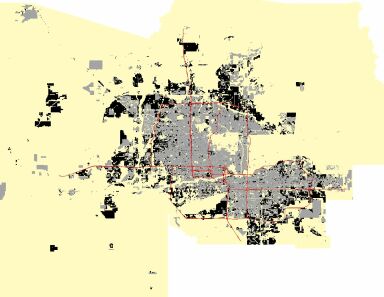
The SAM-IM simulation generated this forecast of growth
and development in Maricopa County over the next 20 years.
Shown in gray are existing "built" uses (in 1995).
Shown in black are new developments projected to occur by the year 2020.
(The proposed 2020 freeway system is also shown).
This paper describes one such model: the Subarea Allocation
Model (SAM), developed and run at the Maricopa Association of Governments.
SAM forecasts land use and development throughout the MAG planning region.
It does this by simulating factors that influence the value of land and
the likelihood that land will be built, based on those factors. It observes
planning policies – general plan designations controlling the use of land
(approved by municipalities in the region), for example, are observed by
the model.
The land use, population and socioeconomic modeling at
MAG is based on a three-tier modeling process. The first tier is a demographic
model that is used to produce county control totals. The second tier involves
using a spatial interaction model to allocate the county control total
population and employment to subregions. The third tier allows for the
allocation of the subregional population to smaller areas drawing upon
GIS representation of land use plans and local policies of MAG member agencies.
The first tier model is a county level model. In accordance
with Executive Order 95-2, the preparation of county and state level population
projections is the responsibility of the Arizona Department of Economic
Security (DES). This model is a demographic model, projecting births, deaths
and net migration in each county for a fifty-year time horizon. This model
incorporates population by age and sex, birth rates, death rates and net
migration trends. The model takes into account short term economic conditions,
but not long-range employment trends.
For the second tier process, MAG is using DRAM/EMPAL.
DRAM and EMPAL are registered trademarks of S.H. Putman Associates. The
two models, DRAM (Disaggregated Residential Allocation Model) and EMPAL
(EMPloyment Allocation Model), forecast household location, and employment
location. These models are being used by a number of major metropolitan
areas. DRAM/EMPAL projects the spatial patterns of households and employment
in the MAG region. The forecasting procedure starts with regional trends,
transportation facility descriptions and data on the current location of
employment by sector. This information is then used to project the future
location of households. The projections are done for five-year intervals.
Each five-year step begins with the EMPAL model to project employment by
sector by zone. DRAM modeling to project households by income category
follows the EMPAL run for that time period.
The third tier Subarea Allocation Model (SAM) allocates
population and employment from Regional Analysis Zones (RAZ) to one acre
grids which are then aggregated to Traffic Analysis Zones (TAZ). SAM generates
simulations of how Phoenix will grow as a region over time. Its current
role is to bridge the gap between the spatial allocation model, DRAM/EMPAL,
and EMME/2, MAG’s transportation model that works on much more detailed
geographies. So, SAM’s official role is an "allocation" model in that it
disaggregates land use forecasts generated by DRAM/EMPAL for large statistical
areas to smaller TAZs that are needed to drive the transportation model.
Model Integration
The sequence of land use models and transportation models
run at MAG is recursive. DRAM/EMPAL requires assumptions
about future travel times between RAZs across the transportation network
in order to generate forecasts of land use. These travel time forecasts
are available from the transportation model. In turn, the EMME/2-based
transportation model requires forecasts of future land use in order to
generate estimates of travel times between RAZs. This has led to the development
of a MAG "feedback loop," whereby the DRAM/EMPAL and EMME/2
model chains are executed a number of times, feeding the results of one
model back into the other, until "closure" is achieved. This is necessary
to assure that the results generated by one model are consistent with the
assumptions made by the other.
SAM-IM provides a bridge between forecasts generated
by DRAM/EMPAL at a relatively coarse geographic
scale to the transportation model EMME/2, which operates
with much greater geographic detail.
From a modeling standpoint, the integration of two independently
built models, DRAM/EMPAL for land use and EMME/2 for transportation, presents
two significant database issues:
-
Geographic Detail: DRAM/EMPAL and EMME/2 operate
at two different levels of geography. With roughly a 10-to-1 ratio between
RAZ and TAZ geographies, the first severe problem that arises is one of
data disaggregation.
-
Secondary or "Derived" Variables: DRAM/EMPAL
does not supply all of the land use variables that are needed by EMME/2.
DRAM/EMPAL generates estimates of households, for example. The EMME/2 transportation
model requires estimates of resident population and dwelling units, as
well as households. So there is need for a mechanism that can supply "secondary"
variables needed by the transportation model. Some of these variables can
be easily derived from the DRAM/EMPAL forecasts themselves (e.g., dwelling
unit estimates can be generated from household estimates based on appropriate
assumptions about vacancy rates). Other variables, such as total enplanements
at Sky Harbor Airport, must come from other secondary forecast sources.
Subarea Allocation Models
The Subarea Allocation Model (SAM) was first posed as
a land use disaggregation model. The objective was to develop an automated
procedure to bridge the geographic gap between DRAM/EMPAL forecasts generated
for 147 RAZs and the needs of the transportation model which is driven
by a 1,549 TAZ system. Also, the automated procedure had to inject other
variables needed by the transportation model, some of which are highly
correlated with DRAM/EMPAL forecasts and therefore should be derived from
them.
Before embarking upon the development of SAM, MAG’s level
of investment in GIS capability was sufficiently advanced to support the
model's requirements. MAG had developed existing land use covers for all
of Maricopa County, and it had assembled and unified the general plan covers
adopted by municipalities throughout Maricopa County. MAG had also mounted
a number of other efforts germane to SAM-type model concepts. For example,
MAG was tracking, on GIS, active developments throughout the region as
well as planned developments in various stages of the approval process.
Retirement communities had been mapped, redevelopment district coverages
were available and MAG had a capability to represent future EMME/2 transportation
networks in GIS. So, in short, the database support needed for a SAM-type
model was already available.
The original SAM model was implemented as a set of ARC/INFO
AMLs running on UNIX, using the ARC/INFO GRID module to convert feature
coverages to grids. Much of the logic associated with allocating growth
capitalized on spatial analysis functions available in ARC/INFO GRID. In
fact, MAG had participated in the development of a grid-based model with
a 40-acre resolution in the late 1980's, but ARC/INFO GRID allowed MAG
to consider modeling at a much finer resolution.
The implementation of SAM was completed in 1996/97 and
was used for the purposes of generating land use forecasts for the region
for five-year intervals, 2000 through 2020. These forecasts were reviewed
with the member governments and were ultimately adopted by the Regional
Council in 1997. Some of the key characteristics associated with the SAM
model are:
-
Growth Model: SAM is a growth model; the entire
forecast is not allocated, only the growth implied with it is allocated.
-
Iterative Model: It is an iterative model;
the forecast generated for a target year (say 2005) is taken as a "given
pre-existing condition" for the purposes of generating a forecast for a
subsequent target year (say 2010). Growth is "accumulative". Consequently,
a forecast generated for a future target year is assured of being consistent
with the forecast already made for an earlier target year.
-
Cell Resolution: SAM is operated County-wide
with a grid cell size of 220 feet, or approximately 1.1 acres.
-
Allocation Variables: The SAM model allocated
households along with the five classes of employment forthcoming from the
DRAM/EMPAL model. In addition, the SAM model allocated a number of other
variables (group quarters, motels, and mobile home sites) to individual
sites within the County directly from Countywide control total forecasts.
-
Site Location Considerations: Different site
location characteristics were employed depending on the allocation variable.
The allocation mechanism for housing and employment classes was represented
by measures of proximity to existing infrastructure (represented by the
future transportation network), proximity to existing development, and
distance from the urban area. The "site location" characteristics for other
types of allocation variables were different. Proximity to freeways, for
example, was found to be a prime determinant of motel/hotel development.
By 1997, Esri had released the Spatial Analyst extension
to ArcView, which provided ArcView with virtually the same desktop capabilities
for raster geographies as does ARC/INFO GRID. When considering the future
development and enhancements to SAM, it became apparent that the entire
model should be re-implemented in ArcView. Many reasons contributed to
this decision, including:
-
ArcView facilitated the migration from a UNIX environment
to a Windows environment; other applications common to Windows environments,
such as spreadsheet and database applications, would be available for analysis
and forecasting work;
-
ArcView already offered an extensive and robust set of menu
items, commands, and functions for managing and mapping land use data sets
that would have otherwise had to be built into SAM in ARC/INFO;
-
ArcView operating in a Windows environment integrates well
with Visual BASIC; so the modeling system could benefit from customized
programs and forms;
-
Avenue, ArcView’s scripting language, appeared to be better
and faster in operation than AML;
-
ArcView offered an excellent graphics user interface (GUI)
which facilitated the operation of the model;
-
ArcView offered improved mapping capabilities for grids.
The new model has been dubbed the Subarea Allocation Model
– Information Manager (SAM-IM). The re-implementation in ArcView provided
the opportunity to significantly enhance the model application itself,
including these features:
-
SAM-IM is "configurable". Users can modify the land use database
structures, and add or delete land use codes to the coding scheme, without
any change to the software. Users can also change the definitions of the
forecast allocation variables themselves.
-
SAM-IM provides the users with land use database editors.
These editors give users an easy way to modify land use data sets, whether
they represent existing land use, planned land use, active development
projects, or whatever land use source data is of interest.
-
A new site-scoring module gives users a battery of utilities
especially designed to create grids that reflect various aspects of site
suitability of land. These menu-driven utilities let users evaluate land
– measure its proximity to roadways and other types of infrastructure,
measure distances from other features, automatically acquire location attributes
from shape files, etc. The module offers features for users to create linear
combinations of site characteristics into aggregate representations of
the overall site suitability to absorb development.
-
The allocation mechanism offers users a variety of allocation
methods. Land absorption for some sectors, such as employment, is clearly
closely related to site characteristics and local markets. Other sectors
of interest to MAG, for example prison populations, do not really observe
site location characteristics and are better prorated to certain user-defined
locations. Yet other sectors, particularly "work-at-home" employment, are
best allocated to lands that have already been allocated -- in this instance,
residential development.
-
The trip generation mechanism is programmable. SAM-IM will
generate a trip generation data set for any TAZ system of interest. SAM-IM
will create trip generation data sets according to any file format defined
by the user. SAM-IM will create estimates for "derived" variables according
to any set of user-defined equations that are interpreted geographically.
(For example, users can automatically generate estimates of population
by combining a residential housing shape file with another shape file representing
household occupancy rates).
The Allocation Mechanism in SAM-IM
SAM-IM simulates the growth of regions by looking for
land that is best suited for absorbing development.
-
Forecast Growth: A set of themes defines the
forecasts for each of the allocation sectors for each forecast year. MAG,
for example, has created such themes for five-year intervals from the year
2000 to 2040. If the forecasts are from DRAM/EMPAL, SAM-IM disaggregates
these from RAZs to TAZs using a RAZ shape file. If the forecasts are known
only county wide, as in the case for allocating growth in seasonal and
transient populations, then the forecasts are associated with a shape file
with one single polygon – the County.
-
Vacant "Developable" Lands: In order to be
considered a candidate to absorb growth, land must be currently undeveloped
or planned for redevelopment. An existing land use shape file, with codes
designating "urban vacant" or "agriculture", describe these conditions
-
"Conforming Use": In order to be considered
a candidate to absorb growth, land must be declared an appropriate use
in the general plan. The shape file describing the General Plan for Maricopa
County is used for this. For example, MAG’s coding scheme defines five
categories of residential use (ranging in density from "rural" to "high
density"). All of these uses are considered eligible to absorb growth.
SAM-IM will not allocate residential growth to lands dedicated to commercial
uses in the general plan, for example.
-
Site Suitability Scores: Candidate sites then
are evaluated with respect to their suitability to absorb growth. This
is accomplished through the assignment of a "site suitability score". Site
suitability scores are generated countywide, so every piece of land in
the county has associated with it a score that reflects its competitive
suitability to attract development of certain type.
-
Growth Allocation: No matter how derived, site
suitability scores drive the allocation. Lands considered to be eligible
for development are "tagged for development" in rank-score order, until
the growth forecast is fully allocated. Lands that are tagged for development
are extracted and moved to a "growth" grid, which accumulates growth associated
with each allocation sector, whether it be residential dwelling units,
employment, hotel rooms, etc.
At the end of the allocation process, run once for each allocation
sector, the growth grid is combined with the then-current existing land
use to represent a projection of "future" land use (for the target year
in question).
All of these computational operations are not actually
carried out on feature themes; instead, land covers and site suitability
evaluations are represented as grids. SAM-IM converts them automatically.
Grid representation is used for a number of reasons.
-
There is no computational geometry necessary. There are no
polygon "intersections" or "unions" that have to be constructed.
-
The method is entirely "zone-less". Growth is represented
by a grid and therefore results can be aggregated upward to any geographic
level. Results can be summarized for any TAZ system or for any polygon
theme, whether it represent TAZs, RAZs, census tracts, zipcodes, municipal
boundaries, water districts, or school districts.
-
The method is unbiased with respect to the way that input
data sets are coded. The basic allocation "land unit" is a small uniform
grid cell.
The planner can set the grid resolution desired for SAM-IM.
Currently, because of ArcView addressing limitations, 220-foot cells (1.11
acres) is the smallest resolution that SAM-IM can handle for the 9,000
square mile Maricopa County. Smaller modeling areas, of course, could be
modeled at much higher resolution.
SAM-IM predicts future growth and urbanization by simulating
development. The allocation mechanism evaluates the
suitability of land to absorb development and chooses
the most appropriate sites in conformance with general plans.
The actual implementation of the allocation mechanism
in SAM-IM offers a number of other add-ons and features not mentioned above.
These include:
-
Subarea Control Totals: A common practice in
land use forecasting is to translate regional forecasts of population and
employment into subareas first, before allocating it to smaller geographic
units (such as TAZs). Regional Analysis Zones (RAZs), the geographic unit
by which DRAM/EMPAL generates forecasts, is a type of subarea. SAM-IM will
observe any kind of subarea control totals that the planner wishes to express.
The user could even express subareas in terms of "sub-markets", for example
distinguishing between "downtown", "airport", and "suburban" office space
demand.
-
Development Size: The allocation mechanism
in SAM-IM involves the "tagging" of grid cells considered to be the most
suitable to absorb development. However residential and commercial developments
do not usually occur one cell at a time. SAM-IM will "bundle" adjacent
cells together during the allocation process so that growth reflects the
development of projects consistent with average development sizes recorded
for the region.
-
Known Projects: As a practical matter, planners
know where much of the growth forecast for a region will go, especially
for the near-term years of a projection series, because these projects
already have to be positioned somewhere in the development approval process
for them to actually arise. MAG maintains databases tracking development
projects throughout the region: their attributes and densities as well
as their likely timing. One of the expectations of a forecast is that it
should reflect the appearance of projects that are underway, and SAM-IM
does this.
-
Prorating Growth: Site location mechanisms
based on the suitability of land to absorb growth are not necessarily the
best way to allocate growth for some sectors. Growth in prison population,
for example, is such a sector. For some sectors, "pro-rating" growth among
a discrete set of known existing sites is the best approach. SAM-IM provides
mechanisms to allocate according to this method.
-
Redevelopment Overrides: SAM-IM requires land
to be "developable" before it considers it eligible to absorb growth. Normally,
this land is currently vacant. SAM-IM will, however, allocate to redevelopment
areas. SAM-IM provides a mechanism by which formally adopted redevelopment
districts are considered eligible for growth and development regardless
of the underlying existing uses.
-
Prohibition Layers: Rivers, flood control channels,
aqueducts, and irrigation canals are all hydrological features that are
normally reflected in land covers assembled in Maricopa County and therefore
SAM-IM can rightfully consider them ineligible for development. Flood plains,
however, are an example of land features that are not normally reflected
in either existing land use or planned land use coverages. Growth prohibitions
imposed by municipalities through policy, although not one that currently
appears in Maricopa County, is another example. SAM-IM provides two different
mechanisms for addressing the suitability of land to absorb development
for factors other than strict land use. One is to reflect these characteristics
in the site suitability evaluation grids; the other is to declare these
areas to be prohibited. SAM-IM lets users create "undevelopable" layers
to restrict development for reasons other than land use.
-
Reallocation Mechanism: A practical reality
in modeling land use is that source data acquired from different sources
or generated by different models can be inconsistent. That is, SAM-IM can
be asked to allocate growth where there is no eligible land, or insufficient
land, to absorb it. Regardless, SAM-IM reports these events, collects "residual"
growth that could not be allocated, and provides a mechanism for allocating
it on some other basis, such as by increasing general plan densities or
by relaxing preset control totals.
Users can define how allocations should be performed
for each of the 14 different forecasting sectors.
SAM-IM provides a variety of methods for allocating
growth, the most sophisticated of which involves an
appraisal of the suitability of land to absorb different
kinds of development.
Site Suitability Evaluation
The growth allocation mechanism in SAM-IM is driven by
the evaluation of site suitability. Growth is allocated to sites (grid
cells) that are considered to be more suitable than their competing neighbors.
This is accomplished by representing the evaluation of land to absorb development
by "site suitability scores". Growth is allocated to land on a rank-order
basis.
The model itself provides this mechanism. It will allocate
according to any "site suitability evaluation" system defined for it, linear
or non-linear, normalized or non-normalized -- the only requirement is
that it must be expressed as a grid. The modeler, however, can create any
kind of site suitability scoring system, reflecting any set of site characteristics
or conditions, for which there is information.
The original site evaluation methodology incorporated
these measures:
-
Highway Proximity: Present day and planned
transportation networks for the future are used to evaluate land access.
They also serve a surrogate for proximity to infrastructure.
-
Proximity to Urban Development: Distance to
other "built" uses is another measure that is used as an indicator of the
availability of local infrastructure and utilities to support development.
-
Neighboring "Built" Uses: The amount of "built"
use in the immediate neighborhood is a measure reflecting infill potential.
Infill projects are favored over those in more remote locations.
-
Development Probability: Planners who were
overseeing the progress of projects that have already initiated the development
review process assessed the potential and likelihood associated with these
developments.
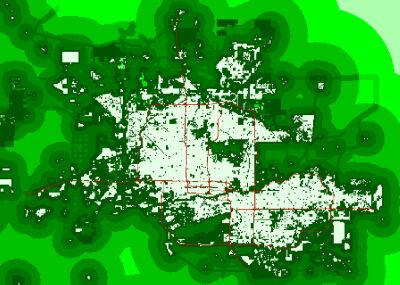
This is a composite image of the overall evaluation
of sites for residential land, with darker shades reflecting
better locations (in areas not already built). SAM-IM
uses this land evaluation theme to target growth.
Calibrating Site Evaluation "Scoring" Equations
The original set of site evaluation measures hypothesized
for Maricopa County has not been formally calibrated. However, this calibration
is scheduled to occur during the summer of 2000. The calibration procedure
will be based on an analysis of land use change between two different points
in time. Development and growth occurring over this time frame can be identified
on a cell-by-cell basis, along with various measures of the features and
characteristics associated with growth cells.
SAM-IM Trip Generation
One of the principal goals of SAM-IM is to provide forecasts
for the 1,549 TAZs required by the transportation model. In addition, though,
MAG’s transportation model requires TAZ-level forecasts for variables other
than those that come from the DRAM/EMPAL and SAM-IM land use modeling environments.
Examples are projections of enrollments at post-high school campuses and
total air traffic embarkations at Sky Harbor Airport. Projections of both
of these variables are geographic-specific but are prepared completely
outside of the land use forecasting environment.
SAM-IM contains a module that provides features for generating
trip generation data sets from SAM-IM forecast land use covers. These features
provide for the estimation of parameters "derived" from the land use forecasts
themselves, as well as for the insertion of forecasts of other independent
variables acquired from other independent sources. The module will assemble
these various sources, will do the necessary computations, and will generate
the results according to any user-specified TAZ geography. Furthermore,
SAM-IM will let the user specify the output format of the data.
Historically, TAZ geographies and data requirements change
with the evolution of the transportation model. Consequently, it is important
for SAM-IM trip generation functions to be programmable.
Similar in concept to Esri’s new "Model Builder" extension
(but predating it), SAM-IM allows users to write "programs" that express
how the trip generation database is to be created. The "program" has these
features:
-
Users can express what transportation model variables should
be drawn directly from the SAM-IM land use allocations;
-
Users can express equations by which "derived" variables
required by the transportation model should be computed;
-
Users can identify different sources of computation parameters
– for example a shape file that describes "persons-per-household" assumptions
for zones;
-
Users can identify different sources of forecasts for other
independent variables – for example a shape file that records independent
forecasts of passenger activity at Sky Harbor Airport;
-
Users can define what the trip generation database should
look like – its field structure (names and data types) as well as its output
format.
The Trip Generation feature of SAM-IM combines variables
drawn from the land use allocation and summarizes
them for any TAZ system required by the transportation
model. In addition, users can write expressions to
generate estimates of any derived variable drawn from
factors represented by other GIS covers.
Implementation Issues
Historically, much of the tedious, labor-intensive work
with land use and transportation databases is driven by the need to operate
models with inherently different geographical zone structures. Furthermore,
much of the source data that is used to generate estimates of many variables
comes from yet other geographies.
Zone system database maintenance is one of the major impediments
to migrating data sets created from one modeling environment to another,
and therefore is a major concern. Historically, much attention was focused
on maintaining a variety of geographic zone structures, making sure that
zone structures are "upwardly" compatible. Changes made in one zone structure
impact all of the others for which compatibility is being maintained. Every
change to zone geography carries with it attendant database issues – households,
employment, resident population, visitor population, and other attributes
all have to be re-estimated for the new zone system, often requiring a
retreat back to the original source data.
Consequently, one of the principal objectives of SAM-IM
was to build a model and a database structure that was fundamentally "zone-less"
in nature -- where land and development, both now and in the future, was
not dependent on any geographic system of zones. Consequently, aggregating
land use information to any zone system that might be needed
to drive a land use or transportation model could be done fully automatically
and routinely.
The best way to represent land use at a micro-level and
on a "zone-less" system is with grid cells ("raster geography"), such as
those inherent to ARC/INFO GRID and the ArcView Spatial Analyst. The finely-grained,
most detailed, level of geography typically possible with conventional
vector (polygon) representation presumably would be the "parcel" level
– but this is not good enough. First, "parcel" coverages are simply too
big – processing a parcel database for Maricopa County of over one million
records is too much for ArcView to perform effectively. Also, parcels themselves
can easily cross zone boundary lines thereby introducing the very same
zone-boundary problem that the model is designed to resolve. And finally,
land use development that is being simulated primarily occurs in undeveloped
and unsubdivided regions – the exact places that the parcel coverage does
not support effectively.
Grid representation also gives the model access to a number
of useful spatial analysis functions that do not exist for conventional
vector geographies. A proximity calculation, for example, cannot be effectively
measured for polygons in an unbiased way because of the variation in size
in polygons. Grid representations of geography, on the other hand, can
treat land based on its specific cell location, regardless of what polygon
it is a part of. Grid representations also offer an entire family of raster
functions and operations, such as "proximity", "neighborhood", "partial
selection", "compute" and "combine" that simply do not exist for vector
geographies.
The SAM-IM allocation mechanism depends heavily on a grid
representation of land use geography. The basic premise of the model would
not even be possible without the capabilities of ArcView Spatial Analyst
or something comparable. This being said, the implementation of the model
using ArcView grid did present us with several technical issues. These
are covered next.
Single Attribute Grid Representation
Much of the grid representation of geography offered by
the ArcView Spatial Analyst seems to have been driven by natural resource
applications, where each grid represents a single specific attribute of
land: for example, soil type, permeability, vegetation classification,
etc. The data structures needed for urban land use modeling are much more
complex – they need to carry a number of different attributes which a single
grid cell can exhibit, including land use code, dwelling unit density,
employment density, and densities associated with any one of a number of
different use characteristics (nursing homes, hotel and motel rooms, housing
classes, etc.). A "single attribute" representation leads to a proliferation
of grid databases and high execution time needed to build and process the
databases. Fortunately, ArcView does provide mechanisms to associate multiple
attributes with a single cell through the "VAT," which is virtually the
same as a standard dBase or INFO table. If land use grids are built based
on a "polygon identification number", then all of the attributes associated
with the original polygon can be migrated to the pertinent grid cell and
the "VAT" of attributes can be manipulated with conventional database management
functions (i.e., fields can be added, deleted, etc.).
Issues with Spatial Analyst
The ArcView Spatial Analyst proved to be sufficiently
stable to support the SAM-IM model, a model that has grown significantly
in computational complexity and sophistication. Still, there are several
aspects associated with the Spatial Analyst that posed serious problems
and limitations. These are:
-
The ArcView Spatial Analyst running in Windows environments
will not reliably delete grid data sets. This is extremely unfortunate
for SAM-IM, because the model generates a large number of "temporary" datasets
that must be deleted throughout the process.
-
Even though the ArcView Spatial Analyst is a "Windows" program,
one of the undocumented aspects of it is that grid names must conform to
the old DOS 8.3 file naming convention. The Spatial Analyst offers no warning
about this – failure to observe the DOS 8.3 naming convention causes ArcView
to behave erratically.
-
The ArcView Spatial Analyst imposes serious limitations on
the sizes of data sets that can be built. Reportedly, the size limitation
is the 32-bit addressing barrier (approximately 2.5 gb). It appears that
some Spatial Analyst functions, particularly "grid combine", generate temporary
grid data sets much larger than are ultimately necessary.
SAM-IM contains large bodies of code to avoid some of these
limitations. Some, however, can not be addressed in application code and
therefore have become limitations and constraints on the model itself.
For example, SAM-IM users are limited when designing site
selection scoring equations or reflecting the results of a statistical
calibration. Our practical experiences at MAG are that site scores have
to be "normalized" within certain restricted numeric ranges, such as integers
between 0 and 100. This is not an absolute rule, but one that applies specifically
to Maricopa County – the size of the grid cell used there, along with the
number of land use and general plan polygons, all conspire to fail due
to size restrictions if the scoring theme has more than 100 individual
scores. The limitation can not be determined in advance – it can only be
determined by trial.
Variable Grid Cell Sizes
MAG’s legal jurisdiction for regional land use, transportation,
and air quality modeling covers all of Maricopa County. Maricopa County,
like other planning areas in the Southwestern United States, is large (9,000+
square miles). And therefore, it is appropriate that the scope of the modeling
area should match it even though a large part of land in Maricopa County
is undeveloped desert.
The ArcView Spatial Analyst requires grids to be uniform
with respect to grid cell size. This seems entirely natural (compute screens
don’t have pixels of variable dimensions), but for land use modeling it
would be helpful if grid cells could be variable in size. The size of grid
cell sizes for representing land use such as SAM-IM is driven by the need
for resolution.
SAM-IM currently runs at grid cell sizes of 220 feet on
a side, or approximately 1.11 acres. This appears to push ArcView to the
very limit of its constraints on grid sizes and yet is insufficient for
densely developed areas, such as downtowns. There are highly developed
uses in downtowns, such as a 20-story building on a half-acre parcel, that
literally "disappear" during the conversion from vector representation
(the land use polygon cover) to grid. A mechanism to exchange higher resolution
in densely developed areas, such as downtowns, for lower resolution in
undeveloped deserts and forests, would be helpful.
Loss in Information During Database Conversions
The normal representation of urban land use is the conventional
vector feature database of polygons – each representing "generalized" land
use (that is, a "shape file"). Land use data is typically digitized this
way and is maintained this way. Therefore, SAM-IM automatically converts
land use data from its normal vector form to grids in order to perform
the growth simulation. Once accomplished, the resulting "growth" grid is
converted back to its vector form.
Land use modelers should expect, though, that there is
a natural loss in information associated with land use through the conversion
process. Anyone who has spent time looking at aerial photographs knows
that you can see things in aerial photo-mosaics shot at sub-meter resolution
(e.g., buildings) that you can not see in imagery shot at higher resolutions
(e.g., 30-meter satellite images). The same holds true for grid representations
– the simple conversion of a land use "shape file" to grid and back again
will not give you the same polygon representation that you started with,
except at very high resolutions.
The problems are:
-
First, it is completely possible that entire land use polygons
will "drop out" of the grid representation during the conversion process.
It is easy to see that quarter-acre parcels, for example, can not be completely
captured by four-acre grid cells. As we mentioned earlier, this is an issue
that arises in downtowns, in particular. Unfortunately, in urban land use
modeling it is completely unacceptable to "lose" 15,000 employees that
work in a single high-rise office building.
-
Also, "area" is not preserved. For example, it is entirely
likely that a 40 acre rectangular parcel to be represented by 44 (or some
other number) 1-acre grid cells. So the "area" of the gridded polygon is
44 acres, not the 40 acres associated with the original polygon from which
they came. The error associated with grid areas is not consistent – it
all depends on the resolution of the grid cell and the location of the
polygon within the grid.
Future Developments
During the next phase of work, a number of enhancements
are planned. These are:
-
Data Enhancement Project: SAM-IM makes use
of land coverages that describe existing land use, planned land use, planned
development project, active development projects, as well as transportation
networks from the forecasting model and other coverages describing retirement
communities and redevelopment communities. These databases all have been
assembled from a variety of disparate sources. One of the issues influencing
the performance of the forecasting series (DRAM/EMPAL and EMME/2, as well
as SAM-IM) has been the consistency of information portrayed among these
datasets. MAG’s Data Enhancement Project, begun in early 2000, is a comprehensive
database enhancement project aimed at updating all of these databases and
bringing them into concurrence.
-
Mixed Use Developments: Historically, the land
use data models embedded in SAM-IM have presumed that land is always "dedicated"
to a single use, whether it be residential, commercial, industrial, or
some type of unbuilt use. Consequently, SAM-IM does not have an effective
way to address mixed use developments, without converting these to single
dedicated uses. A future enhancement target is to fully support mixed use
developments, with variable percentages of other land uses.
-
Densification Mechanism: The allocation mechanism
in the SAM family of models maintained target development densities defined
in the general plan. In fact, general plans are often ambiguous about precise
development densities, which can be higher than the target densities in
the general plan while still being consistent with the plan. Additionally,
densification does tend to increase as the supply of developable land decreases.
One of the enhancement areas targeted for SAM-IM will provide the ability
to increase development densities associated with planned land uses.
-
Development Phasing: MAG tracks development
activity carefully and has assembled data bases that describe these projects
as they unfold, including information about phased approvals of developments.
MAG has developed a "development velocity" concept by which the phased
development activity can be projected in future years. The "development
velocity" concept will be automated in the next version.
-
Redevelopment Activity: As indicated earlier,
SAM-IM allocates growth to lands that are defined to be eligible to absorb
development. Ordinarily, these lands are vacant or are "unbuilt" in some
sense, except in "redevelopment" areas. In formally adopted redevelopment
districts, SAM-IM considers all land, built or otherwise, to be eligible
for "next-generation development". The next version will have a mechanism
to redistribute uses that are replaced.
Current and Future Applications
SAM-IM is becoming an integral part of the forecasting
process at MAG. The predecessor model SAM played a principal role in the
development of the official population and employment projections by TAZ
which were adopted by the MAG Regional Council in June 1997. Data being
collected by the 2000 Census and the ongoing MAG Database Enhancement Project
will be input to SAM-IM to prepare the next set of TAZ projections for
Maricopa County during 2002.
In the meantime MAG is testing a number of land use development
scenarios. For example, during the early part of 2000 MAG applied SAM-IM
to produce alternative population and employment allocations for:
-
a light rail corridor study, based on updated general plans
and known developments;
-
no-build transportation scenarios required in air quality
conformity analyses;
-
out-year (2040) trip generation data consistent with the
adopted TAZ projections to 2020;
-
alternative highway alignments in a subregion which is growing
rapidly.
In these tests, SAM-IM demonstrated the capability to provide
reasonable TAZ-level estimates of population and employment, given updated
GIS coverages of existing land use, general plan land use, and/or known
development projects. It is anticipated that the model will be used to
generate additional land use alternatives during the next year and that
these "tests" will disclose areas of needed improvement. SAM-IM will continue
to be calibrated and refined in preparation for the next official MAG forecasting
cycle in 2002.
Because the model has proven to be both useful and configurable,
next year MAG intends to provide SAM-IM, with appropriate manuals and training,
to its member agencies, i.e. 24 cities and towns and the County, many of
which already use ArcView. It is anticipated that SAM-IM will be used by
these agencies to evaluate the impact of local development policies and
plans. Some may choose to focus the model within their geographical boundaries
and/or use smaller spatial units than TAZs. SAM-IM’s structure will allow
users to tailor the modeling domain, grid-size, and aggregation of model
output to local land use planning needs.
MAG’s experience with SAM over the last five years indicates
that the model’s greatest asset may be its flexibility. It can be used
to prepare socioeconomic forecasts, as well as to analyze alternative development
patterns, perform what-if analyses, at varying spatial scales.
Due to concerns about the impacts of growth on infrastructure
such as roads, utilities, and schools, and the overall quality of life,
the Arizona legislature has recently passed "growing smarter" laws, requiring
jurisdictions to develop new land use plans. This increased emphasis on
accurate and potentially-binding plans, along with the looming possibility
of growth boundaries, is sparking an interest in land use models. Fortunately,
MAG and its member agencies are well-positioned to address future growth
and other regional and local land use issues, thanks to SAM-IM.
Rita Walton
Information Services Manager
Maricopa Association of Governments
302 North 1st Avenue, Suite 300
Phoenix, AZ 85003
rwalton@mag.maricopa.gov