 and has been estimated to have grown 26% since the 1990 census at an average
annual rate of 2.9% per year (Montana Department of Commerce, 2000). Much
of the growth is in areas without city services so that subdivisions are
commonly developed with individual wells and septic systems. The subdivisions
and the septic systems must be reviewed before approval. Currently the
County approves approximately 500 septic systems per year. Review requires
information on soils (flooding, depth to bedrock, ponding, depth to water
table, percolation, filtration, slope, large stones), hydrogeology (hydrogeologic
unit, transmissivity, hydraulic conductivity, ground-water gradient), septic
system location and well location. Without organization into a geographic
information system (GIS) this information is scattered in many locations
and many forms. The soils information is in the offices of the Natural
Resources Conservation Service and the U.S. Forest Service, the hydrogeologic
information is in many reports and studies in a variety of offices, reports
and articles, and the information about wells and septic systems is in
tabular files at the Montana Bureau of Mines and Geology and in the Environmental
Health Services Division of the Gallatin City-County Health Department.
The location of wells and septic systems is also tabulated in the Department
of Revenue CAMA database. In 1997, Gallatin City-County Health Department
asked if the data could be drawn together to more effectively and efficiently
place areas under septic system and subdivision review in context. The
Department identified the Local Water Quality District (Fig. 1) as the
area which most needed this information because this is where most of the
growth is taking place. Spatial data bases were needed which could be queried.
There was also interest in making this information available to the public.
The communication of the databases to many users with different backgrounds,
different questions, and different platforms is an important challenge
which requires more than one approach so that the data are accessible to
the Gallatin County health officials, public, consultants, and planners.
and has been estimated to have grown 26% since the 1990 census at an average
annual rate of 2.9% per year (Montana Department of Commerce, 2000). Much
of the growth is in areas without city services so that subdivisions are
commonly developed with individual wells and septic systems. The subdivisions
and the septic systems must be reviewed before approval. Currently the
County approves approximately 500 septic systems per year. Review requires
information on soils (flooding, depth to bedrock, ponding, depth to water
table, percolation, filtration, slope, large stones), hydrogeology (hydrogeologic
unit, transmissivity, hydraulic conductivity, ground-water gradient), septic
system location and well location. Without organization into a geographic
information system (GIS) this information is scattered in many locations
and many forms. The soils information is in the offices of the Natural
Resources Conservation Service and the U.S. Forest Service, the hydrogeologic
information is in many reports and studies in a variety of offices, reports
and articles, and the information about wells and septic systems is in
tabular files at the Montana Bureau of Mines and Geology and in the Environmental
Health Services Division of the Gallatin City-County Health Department.
The location of wells and septic systems is also tabulated in the Department
of Revenue CAMA database. In 1997, Gallatin City-County Health Department
asked if the data could be drawn together to more effectively and efficiently
place areas under septic system and subdivision review in context. The
Department identified the Local Water Quality District (Fig. 1) as the
area which most needed this information because this is where most of the
growth is taking place. Spatial data bases were needed which could be queried.
There was also interest in making this information available to the public.
The communication of the databases to many users with different backgrounds,
different questions, and different platforms is an important challenge
which requires more than one approach so that the data are accessible to
the Gallatin County health officials, public, consultants, and planners.
http://mapserver.giac.montana.edu/maps/319a/lwqdsepindx.html
http://mapserver.giac.montana.edu/maps/319a/lwqdsepindx.html
and is served from the Geographic Information and Analysis Center at Montana State University. A brief outline of the organization of the web page helps to illustrate how some of the issues outlined above have been addressed. The index page briefly outlines the project objectives, acknowledges funding sources, and provides ArcView project links under the headings of location, a growth animation, soils, ground water, wells, septic systems, wells and septic systems and information about drinking water, waste water and wells. The headings are not hyper linked, but serve to organize the information. The headings wells, septic systems, and wells and septic systems may seem redundant, but are not. The well and septic system point coverages show only points that could be located inside a 30 m radius circle. Points that could not be located to the stated accuracy are missing. Sometimes a septic system is found but a well is not or vic versa. In a majority of cases, if a septic system is present, a well is likely present too. By combining the well and septic point data, a more realistic distribution of the likely location of wells and septic systems is produced. Thus a category of projects that show both wells and septic systems together was added to the web page. This data draws together well locations from the Montana Bureau of Mines and Geology, septic locations from the Gallatin City-County Department of Health, and well and septic utility information from the Montana Department of Revenue (DOR) utility codes. Themes that show well and septic information together are not as data rich as the themes that show wells separately from septic systems because the DOR data have no attribute other than the presence or absence of the system. For example, the well data base shows many well attributes such as depth, water level, specific capacity, transmissivity, but the well and septic data base simply shows wells as a 7, septic systems as an 8, and creates a septic score which is the sum of the well and septic attribute column. A septic score of 15 means both a well and a septic system have been accurately located for that point, a 7 means only a well has been located accurately for that point, and an 8 means only a septic system has been located accurately for that point. Thus, the well and septic coverages show information about wells and septic systems at the point while the well and septic coverage shows information about the presence and absence of a well or septic system but contains no information about the characteristics of the well or septic system.
Underneath each heading on the index page are further categories with hyper links to maps and data of potential interest. When these hyper links are opened, a second structure is present which is designed to communicate different information to different users. There are seven headings including information on how to view the maps, maps, themes, questions the data base might be used to answer, a glossary to help users with technical terms, a section about the data (metadata), and at the end a hyper link to a table of attribute names with an example value and a definition of the attribute. The hyper link which covers how to view the data is needed because two types of maps are served. The first is an interactive link to the server which allows the user to zoom into areas of interest, select specific themes to view, and query the data using identify. This map is identified as MAP 1. The map is served with ARC IMS. Because some of the themes (eg: most limiting soils) are very data rich they load slowly. The speed is controlled by the user's line speed, not the server speed. Given the fact that most Internet users are accustomed to fast response, we also serve map images (image files) which appear on the screen more quickly. These images are hyper linked below MAP 1. The user needs this information to use the web site more efficiently. Thus there are MAPS which are interactive and themes which are noninteractive image files. Possible questions the map or data might answer is provided for users not familiar with the concepts. The hope is that these questions might get the inexperienced user thinking about what they want to know and how the spatial data might help them. A glossary or link to glossary available elsewhere on the web is provided to help those users who do not have a technical background. There is also a section about the data. This section provides interested technical and nontechnical users with metadata. At the end of this section is a list of attributes. This is needed because the attribute table headings must be short and unique. The abbreviation for the headings may not be obvious to the user. The table provides the attribute name, an example value, and a definition of the attribute. This table should be of particular use to those who use the interactive MAPS which show all attributes with the identify button. Use of all the attribute data by all users is unlikely. The most technical information in the section about the data was placed low on the web page for each set of themes. The maps were placed near the top of the page because we anticipate most users will want to see what is there before they explore what the information means.
The interactive maps served with ARC IMS. Many of the commonly used Arc View functions are available from the web, but the web page interactive maps are less robust than those in a fully functional ArcView project. Those who have Arc View can obtain the data and projects from a CD ROM and modify them to suit their needs. While the interactive maps are more functional, they load much more slowly than map objects. Because web users tend to be used to fast loading, static map images served as map objects remain helpful to those first exploring the web site.
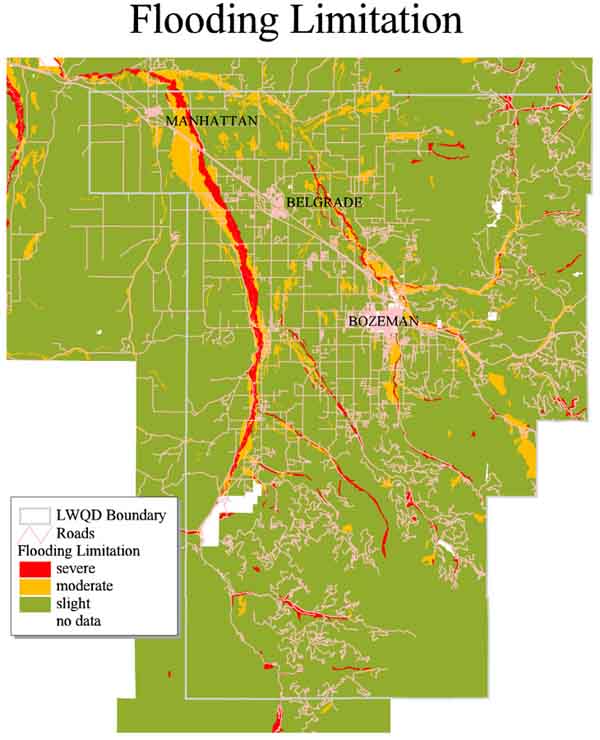 This
map shows two important features. First, at the top of the map is a warning
that the map is "Not a substitute for field-based
site analysis!". This is a reminder that the map is best used for
areas larger than 8 ha (20 acres) when the web page is first opened, and
is reinforced by the fact that one cannot zoom in on the static map. On
the flooding-limitation map, one can generally see where flooding is frequent
and the limitation severe. The red areas represent severe limitation (one
would not want septic systems in areas subject to frequent flooding), the
yellow areas display properties suggesting moderate limitations, and the
green areas have properties suggesting slight limitation. The blank areas
are areas that for one reason or another were not mapped.
This
map shows two important features. First, at the top of the map is a warning
that the map is "Not a substitute for field-based
site analysis!". This is a reminder that the map is best used for
areas larger than 8 ha (20 acres) when the web page is first opened, and
is reinforced by the fact that one cannot zoom in on the static map. On
the flooding-limitation map, one can generally see where flooding is frequent
and the limitation severe. The red areas represent severe limitation (one
would not want septic systems in areas subject to frequent flooding), the
yellow areas display properties suggesting moderate limitations, and the
green areas have properties suggesting slight limitation. The blank areas
are areas that for one reason or another were not mapped.
The transmissivity theme is another example
of a static polygon coverage (Fig. 3). This map was derived from the hydrogeologic unit map. The transmissivity
theme would probably not be understood by the lay public, but professionals
could use the map to estimate hydraulic conductivity since hydraulic conductivity
is the transmissivity divided by thickness. There are at least three ways
to estimate thickness and hence to calculate transmissivity. The choice
depends on a variety of factors. Only transmissivity is portrayed on the
static maps because of the technical issues. Even the word transmissivity
is not commonly known to those who are not familiar with hydrogeology.
The technical nature of the content of this static map reinforces the difficulty
of the communication problem and illustrates an example of a map that can
neither simply be explained to a lay audience nor used by a lay audience.
The map is important to display however, because professionals searching
for information on this parameter who do not have ArcView can use this
static map or the more dynamic map to explore the data in map view. One
solution to the public/professional audience problem is to develop a simplified
web page for educational purposes mounted on a Gallatin County server which
would present only data that the lay public could reasonably be expected
to need and understand or to teach the technical concepts to the public.
The page would have a hyper link to the more technical web page. This strategy
would better help simplify the maps for the public while keeping more technical
content available for the professional audience. This strategy is currently
under development at the Local Water Quality District.
This map was derived from the hydrogeologic unit map. The transmissivity
theme would probably not be understood by the lay public, but professionals
could use the map to estimate hydraulic conductivity since hydraulic conductivity
is the transmissivity divided by thickness. There are at least three ways
to estimate thickness and hence to calculate transmissivity. The choice
depends on a variety of factors. Only transmissivity is portrayed on the
static maps because of the technical issues. Even the word transmissivity
is not commonly known to those who are not familiar with hydrogeology.
The technical nature of the content of this static map reinforces the difficulty
of the communication problem and illustrates an example of a map that can
neither simply be explained to a lay audience nor used by a lay audience.
The map is important to display however, because professionals searching
for information on this parameter who do not have ArcView can use this
static map or the more dynamic map to explore the data in map view. One
solution to the public/professional audience problem is to develop a simplified
web page for educational purposes mounted on a Gallatin County server which
would present only data that the lay public could reasonably be expected
to need and understand or to teach the technical concepts to the public.
The page would have a hyper link to the more technical web page. This strategy
would better help simplify the maps for the public while keeping more technical
content available for the professional audience. This strategy is currently
under development at the Local Water Quality District.
An example of a static point image is the
map of water level (Fig. 4)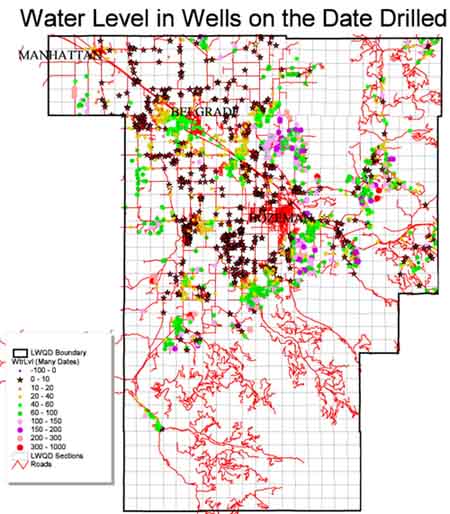 .
Again this map has a warning at the top:
.
Again this map has a warning at the top:
 interactive map of well locations. Notice that the legend frame on the
right warns users not to use the data for characterization of areas smaller
than 8 ha (20 ac). The legend frame also has a link which takes the
user back to the static maps. To use the map and legend effectively,
the new user may need to read the section on how to view the data to learn
how to use the tool bar, turn themes on and off, activate themes for queries
and return to the legend bar. The upper left tool on the tool bar
activates the legend. If one wishes to select a new theme after the
legend is displayed, the upper left legend tool must again be clicked.
If one wishes to find the attributes of a particular point or polygon with
the "i" tool, the theme with the data of interest must be activated on
the theme selection frame which cannot be seen if the theme legend is showing
(compare Fig. 5 and Fig. 6).
interactive map of well locations. Notice that the legend frame on the
right warns users not to use the data for characterization of areas smaller
than 8 ha (20 ac). The legend frame also has a link which takes the
user back to the static maps. To use the map and legend effectively,
the new user may need to read the section on how to view the data to learn
how to use the tool bar, turn themes on and off, activate themes for queries
and return to the legend bar. The upper left tool on the tool bar
activates the legend. If one wishes to select a new theme after the
legend is displayed, the upper left legend tool must again be clicked.
If one wishes to find the attributes of a particular point or polygon with
the "i" tool, the theme with the data of interest must be activated on
the theme selection frame which cannot be seen if the theme legend is showing
(compare Fig. 5 and Fig. 6). 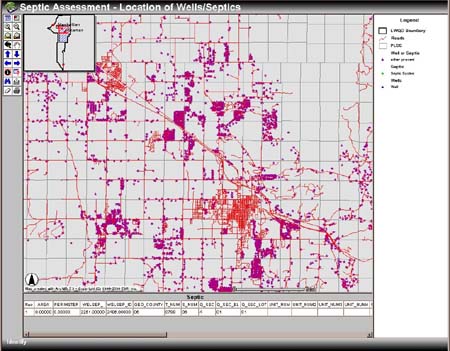 The
attribute definitions are available for each map by going to the end of
the "About the Data" section and clicking on the attribute hyper link.
While such procedures may be obvious to an Arc View or ARC/INFO user they
may not be obvious to a member of the public with no ArcView experience
entering the web page. The interactive web page was served
with Map
Objects Internet Map Server
until very recently. This server produced legends which were out
of order with out "work arounds" and was less functional. With the
new ARC IMS software shipped in June 2000, these problems were eliminated
and a much better presentation with more functionality can be achieved
relatively easily.
The
attribute definitions are available for each map by going to the end of
the "About the Data" section and clicking on the attribute hyper link.
While such procedures may be obvious to an Arc View or ARC/INFO user they
may not be obvious to a member of the public with no ArcView experience
entering the web page. The interactive web page was served
with Map
Objects Internet Map Server
until very recently. This server produced legends which were out
of order with out "work arounds" and was less functional. With the
new ARC IMS software shipped in June 2000, these problems were eliminated
and a much better presentation with more functionality can be achieved
relatively easily.
Dixon, S.A., in preparation, Hydrostratigraphy of the Gallatin Local Water Quality District, Gallatin County, Montana: Master of Science in Earth Sciences Thesis, Montana State University, Bozeman, Montana.
Montana Department of Commerce, 2000, Population
Estimates for Montana and Counties: Annual Time Series (includes revised
April 1, 1990 Population Estimates Base) [Online]:
http://commerce.state.mt.us/ceic/demog/estimate/pop/county/cty99allrank.htm
[accessed on May 18, 2000].
Montana Department of Health and Environmental Sciences Water Quality Bureau, 1997, Information Packet: Implementation of the Non-Degradation Rules, Helena, MT, 37p.
U.S. Natural Resources Conservation Service,
1996, National Soil Survey Handbook, Part 620 NRCS 620-46 Soil Interpretations
Rating Guides, Table 620-17 Septic Tank Absorption Fields
Gretchen Burton
GIS Specialist
Geographic Information and Analysis Center
Montana State University
Bozeman, MT 59717
USA
Phone: 406 994 6921
Fax: 406 994 5122
email: burton@guava.giac.montana.edu