The West Virginia Gap Analysis Project is currently mapping the predicted distribution of native wildlife species in the state. While most species are mapped using land cover maps from remotely sensed imagery, certain reptiles and amphibians rely on wetland or riparian habitat features that cannot be readily mapped from imagery. A separate model of riparian habitats is necessary to map these species. We created a model of these habitats using GRID with stream hydrology, elevation, and slope. Species distributions were modeled in ArcView using scripts that combine the individual species habitat requirement information, the riparian habitat model, and species ranges.
The West Virginia Gap Analysis Project is part of a larger nationwide effort supported by the Biological Resources Division of the U.S. Geological Survey. A primary goal of the National Gap Analysis program is to model and analyze the distribution of elements of biological diversity for each state, with a particular focus on terrestrial wildlife species and their habitats (Scott et al. 1993). As part of this effort, the West Virginia Gap Analysis Project (WV-GAP) has created models of predicted species distribution for terrestrial vertebrates throughout West Virginia. The predicted species distribution maps are created through use of a Geographic Information System (GIS) to combine maps of known species range, maps of potential habitat types, and a database of wildlife species’ habitat relationships (habitats used by each species).
A key element in the Gap Analysis species distribution mapping process is the statewide map of potential habitat types. National Gap program standards have been established for habitat mapping, which is usually performed by classifying Landsat TM satellite imagery to produce a map of vegetation and other land cover types.
Certain amphibians and reptiles rely on the use of small surface water and wetlands features that cannot be adequately captured at the Gap Analysis mapping scale for land cover features. These species may be more strongly associated with surface water features and riparian areas than with any particular land cover type. Riparian habitats are areas along streams and rivers where vegetation and other habitat characteristics are strongly influenced by the presence of the stream. Due to their linear nature, riparian habitats are difficult to capture at the scale of Gap Analysis land cover mapping (Csuti 1994). In order to more accurately model the distributions of wetland or riparian-dependent species, a separate, highly detailed land cover map focused on wetland, riparian, and surface water features has been developed by WV-GAP.
Species that require the use of the wetland/riparian model are determined from the WV-GAP species habitat relationship database. If the database record for a particular species indicates no associations with specific terrestrial cover types (forested, woodland, shrubland, or other), but does include one or more associations with specific wetland or surface water features, the species requires the use of this special land cover model. Although all of these species may not be exclusively aquatic in nature, aquatic features are required for breeding habitat.
A similar rationale was used by the Wyoming Gap Analysis Project (Merrill et al. 1996) to map the distribution of riparian habitats in Wyoming. Merrill et al. mapped riparian habitats by creating buffer zones of varying width around linear stream features. Wider buffer zones were used for higher stream orders. We adapted this idea for West Virginia’s steep valleys and mountains by mapping potential riparian areas based on a combination of stream networks with topography.
Of the 83 amphibians and reptiles that occur in West Virginia (Green and Pauley 1987), 42 rely on the use of small surface water, riparian, or wetlands features (Appendix 1). Some of these wetland/riparian species may be more strongly associated with terrestrial features after they move from breeding habitat (e.g. Mountain dusky salamander (Desmognathus ochrophaeus)), but their distribution was modeled based on the breeding habitat preference only. Species habitat preferences were determined from regional references including Green and Pauley (1987) and Barbour (1971).
Riparian Model Creation
To model the predicted distribution of these 42 species, a wetland/riparian habitat model was created. There were 5 steps in the creation of the riparian habitat model, which was then combined with wetlands data to produce the complete wetland/riparian habitat model.
The first step in assembling the riparian portion of the model was to
assemble the inputs to the model. These inputs include (see Figure
1):
Figure 1. Input data sets for PATHDISTANCE function: stream hydrology (source cells), DEM data, and percent slope.
The next step was to separate the streams by order into three groups:
headwater streams (1st and 2nd order in the River Reach data), small to
medium streams (3rd and 4th order), and larger streams and rivers (5th
order and above). Then, for each stream size group, we used the ARC/INFO
GRID PATHDISTANCE function (Esri 1999) to create a surface of the relative
costs of traveling upslope from the stream. The pathdistance method
computes the relative “cost” or difficulty of moving from source cells
(streams) through adjacent cells while subject to resistance (slope).
Since the surfaces being modeled are not flat, the pathdistance method
also uses elevation data for more accurate cell-to-cell distance (see Figure
2).
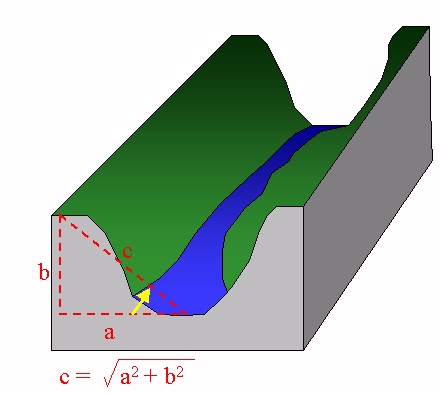
Figure 2. Schematic stream valley cross-section, showing inputs to PATHDISTANCE modeling: distance (c), slope (yellow arrow), and source (stream).
The results of the PATHDISTANCE function are given as a surface
of values indicating the relative costs of moving from the stream cells
up into the stream valley, accounting for slope and elevation change.
The relative cost increases more abruptly in steeper sloped valleys, as
higher costs are associated with areas further from the streams by distance
or elevation. These same areas may also be less likely to support
riparian vegetation and wildlife. In the fourth step, after an examination
of pathdistance results, we chose various pathdistance threshold levels
for the different stream size groups. Areas with computed pathdistances
below these threshold levels were considered to be reasonable approximations
of riparian areas surrounding the streams. Examples of pathdistance
results are shown in Figure 3.
Figure 3. Example of pathdistance results for headwater, small to medium, and large streams.
The final step in the creation of the riparian habitat portion of
the model was to divide the modeled riparian areas into forested and non-forested
streamside habitats. Three species were considered to be limited
to forested stream habitats (Seal salamander (Desmognathus monticola),
Gray treefrog (Hyla versicolor), and Mountain chorus frog (Pseudacris
brachyphona)). Forested status of individual cells was determined
from combination of the riparian areas with forested areas (deciduous,
coniferous, and mixed) as found on the Multi-Resolution Land Characteristics
(MRLC) Consortium’s 30
meter land cover for West Virginia, obtained through the US Geological
Survey’s EROS Data Center.
Final Wetland/Riparian Model
Once the riparian habitat model was complete, we combined this with existing wetlands, springs, and caves data to produce a single map layer of potential wetland and riparian habitats. Wetlands data were obtained from U.S. Fish and Wildlife Service National Wetlands Inventory (NWI) data for West Virginia, at a scale of 1:24,000. Similar efforts report that NWI data are useful in predicting presence of wetland-dependent species (Munger et al. 1998). NWI features were grouped from the NWI classification system (Cowardin et al. 1979) into 6 general categories: riverine, open water, emergent, scrub-shrub, forested, and lacustrine wetlands. These general categories are combinations of Cowardin’s basic wetland systems (Palustrine, Riverine, Lacustrine etc.) and classes (emergent, scrub shrub, etc.). NWI features were buffered by a distance of 30m and incorporated with riparian areas previously described.
Springs were located from latitude/longitude coordinates provided in McColloch (1986). Locations of caves were taken from coordinates provided by Davies (1965). The point location of each spring and cave was buffered by 30m and combined with the riparian and wetland features to create the final wetland/riparian habitat model for amphibians and reptiles.
The habitat model was then converted from raster to vector (polygon) format. Attributes for each riparian habitat polygon included habitat type and whether or not the habitat was forested. An example of the final wetland/riparian habitat model data is shown in Figure 4.
Figure 4. Example of wetland/riparian habitat model used by WV-GAP to model predicted distributions of selected amphibians and reptiles.
Predicting Species Distributions
Our ultimate goal in producing the wetland/riparian habitat model was to use the model to map the predicted distribution of wetland/riparian amphibians and reptiles throughout West Virginia. Species presence/absence within wetland/riparian habitat polygons was determined using standard Gap Analysis methods, described elsewhere in Merrill et al. 1996 and in the WV-GAP final report (in preparation). Predicted distribution maps for each species were created from a combination of the final wetland/riparian habitat map, hexagonal grid-based range data, and habitat association data. For each species, the appropriate habitat polygons (polygons with habitats known to be used by the species) were selected. This selected set was further limited to polygons that intersected the hexagons of occurrence for that species. The final selected set of habitat polygons was then attributed by presence/absence of each wildlife species. Species richness for habitat polygons was determined by calculating the total number of species predicted to be present in each polygon.
The distribution modeling and related GIS operations were performed using customized ArcView scripts written in Avenue code, in order to streamline the process of modeling a total of 42 species.
Accuracy assessment of predicted species distributions was conducted by comparison of lists of species predicted to occur by the modeling with species checklists for locations throughout the state. Errors of omission and commission and overall accuracy rate were calculated for each accuracy assessment location. Complete accuracy assessment information is provided in the WV-GAP final report.
We mapped 13 different wetland/riparian habitat categories. The total area of all mapped wetland/riparian habitats in West Virginia is 759,980 ha (approximately 12.1 % of WV’s total area). The most widespread wetland/riparian habitat is forested headwater streams (246,893 ha), while forested wetlands (1,275 ha) are the most limited (Table 1). Cave and spring habitats were mapped from point locations and are not included in Table 1. Predicted species richness was highest for stream and river habitats along the Ohio River, which forms West Virginia’s western border, in the New River drainage in southeastern West Virginia, and in the far eastern panhandle (Figure 5).
Figure 5. Total predicted wetland/riparian amphibian and reptile species richness in wetland/riparian habitat polygons as modeled by WV-GAP.
| Table 1. Estimated area of modeled wetland/riparian habitats in West Virginia (excluding caves and springs). | ||
| Habitat Type |
Estimated Area (ha)
|
|
| Headwater streams (and riparian areas) | 100,682 | |
| Forested headwater streams | 246,893 | |
| Small to medium streams | 94,141 | |
| Forested small to medium streams | 103,366 | |
| Large streams and rivers |
127,199
|
|
| Forested large streams and rivers |
62,760
|
|
| Lakes |
10,575
|
|
| Open water wetlands |
9,515
|
|
| Herbaceous wetlands |
2,046
|
|
| Shrub wetlands |
1,528
|
|
| Forested wetlands |
1,275
|
|
Although the riparian habitat modeling results have yet to be field-verified, they can be compared with existing aerial photography, such as Digital Orthophoto Quarter Quads (DOQQs) available from USGS.
When WV-GAP predicted species distributions were compared with species
checklists, wetland and riparian herptile accuracy averaged 76.2% across
all sites (Table 2). Error rates are highly subject to various aspects
of the reference checklists, such as checklist date and limited sampling
efforts. Commission errors (species predicted to occur by WV-GAP
but not listed on reference checklists) averaged 21.4% across all sites.
Omission errors (species listed on reference checklists but not predicted
by WV-GAP modeling) averaged 3.1% across all sites.
| Table 2. Accuracy assessment commission errors (CE), omission errors (OE), species correctly modeled (SC), and overall accuracy (SC/N * 100) for wetland/riparian species distribution modeling by WV-GAP. N=42 (total number of species modeled). | ||||||
| Area | CE | %CE | OE | %OE | SC | Overall Accuracy (SC/N) |
| Canaan Valley | 2 | 4.8 | 2 | 4.8 | 38 | 90.5 |
| Cedar Creek State Park | 3 | 7.1 | 5 | 11.9 | 34 | 81.0 |
| Coopers Rock State Forest | 5 | 11.9 | 1 | 2.4 | 36 | 90.5 |
| Harpers Ferry NHP | 15 | 35.7 | 0 | 0.0 | 27 | 64.3 |
| Monroe County Farm Ponds | 10 | 23.8 | 1 | 2.4 | 31 | 73.8 |
| Ohio River Islands NWR | 20 | 47.6 | 0 | 0.0 | 22 | 52.4 |
| Pipestem State Park | 8 | 19.0 | 0 | 0.0 | 34 | 81.0 |
| Average | 9.0 | 21.4 | 1.3 | 3.1 | 29.7 | 76.2 |
The wetland/riparian amphibian and reptile habitat model includes 13 different types of wetland, spring, cave, and riparian habitats. This level of detail (number of different categories) is probably sufficient to capture most of the range of mappable habitats used by wetland or riparian dependent species. Additional habitat categories that could have been considered might include temporary pools, drainage ditches, seeps, and other locations where water may temporarily collect (under logs, leaves, etc.). However, mapping habitats for these categories would have been extremely impractical on a statewide level. Habitat area figures presented should be considered to be conservative.
The wetland/riparian habitat map that forms the basis of the predicted species distribution modeling only captures habitat features present in the source data (NWI, River Reach, etc.) The NWI data were created from interpretation of aerial photography at varying scales. Nationwide, the minimum mapping unit ranges from 0.25 acres (0.10 ha) in open prairie up to 3 acres (1.21 ha) in forested areas, depending on the ability of the interpreter to resolve wetland areas from the aerial photos (USFWS 1995). According to the NWI metadata, areas with dense forest cover (such as portions of West Virginia) may have fewer mapped wetlands. For West Virginia’s NWI data, the average size of a palustrine open water wetland (small pond) is 0.23 ha (0.58 acres), while the smallest open water wetlands in the WV NWI coverage are only 0.003 ha (0.008 acres).
Springs form important habitats for many species modeled using this methodology. The data source used for springs (McColluch 1986) only documents those springs with verified locational information (a total of 1193 springs). Many more springs exist in WV, but have not been documented due to low flows or other reasons. Another related source of habitat that has been potentially overlooked by WV-GAP is abandoned mine locations, many of which are a source of flowing water. Mine discharge locations were not included in WV-GAP habitat mapping efforts, in part because a number of these locations are not suitable for aquatic life due to poor water quality.
The modeling methods presented here are useful for approximating riparian habitats in the absence of more detailed imagery or field sampling data. The wetland/riparian habitat model has helped to refine predictions of amphibian and reptile distribution for WV Gap Analysis. The methodology benefited greatly from the combination of GRID-based modeling techniques, multi-layer GIS operations, and process automation with Avenue programming. Ultimately, we hope that the model and the predicted species distributions can provide useful information to further the conservation of West Virginia’s biological diversity.
Funding for this work was provided by the U.S. Geological Survey, Biological Resources Division through the West Virginia Cooperative Fish and Wildlife Research Unit. WV Gap Analysis Project cooperators include the Nature Conservancy and the West Virginia Division of Natural Resources. GIS work was conducted at the Natural Resource Analysis Center in the College of Agriculture, Forestry and Consumer Sciences at West Virginia University.
Appendix 1. Common names of 42 amphibian and reptile species modeled
using methods described in this report.
| Amphibians | Reptiles |
| Smallmouth salamander | Snapping turtle |
| Streamside salamander | Painted turtle |
| Hellbender | Spotted turtle |
| Dusky salamander | Common map turtle |
| Seal salamander | False map turtle |
| Mountain dusky salamander | Ouachita map turtle |
| Blackbelly salamander | River cooter |
| Northern two-lined salamander | Redbelly turtle |
| Southern two-lined salamander | Slider |
| Longtail salamander | Common musk turtle |
| Cave salamander | Smooth softshell |
| Spring salamander | Spiny softshell |
| Cumberland Plateau salamander | Northern water snake |
| Mud salamander | Queen snake |
| Red salamander | Eastern ribbon snake |
| Mudpuppy | |
| Eastern newt | |
| Northern cricket frog | |
| Gray treefrog | |
| Mountain chorus frog | |
| Western chorus frog | |
| Eastern spadefoot | |
| Bullfrog | |
| Green frog | |
| Pickerel frog | |
| Northern leopard frog |
Cowardin, L.M., V. Carter, F.C. Golet, and E.T LaRoe. 1979. Classification of wetlands and deepwater habitats of the United States. U.S. Fish and Wildlife Service, FWS/OBS-79/31, Washington, DC.
Csuti, B. 1994. Methods for developing terrestrial vertebrate distribution maps for Gap Analysis (version 1). In J.M. Scott and M.D. Jennings, editors. A handbook for Gap Analysis. Idaho Cooperative Fish and Wildlife Research Unit, University of Idaho, Moscow, ID.
Davies, W.E. 1965. Caverns of West Virginia. West Virginia Geological and Economic Survey, Morgantown, West Virginia. 330pp.
Esri 1999. ARC/INFO Version 8.0.1. Environmental Systems Research Institute, Redlands, CA.
Green, N.B. and T.K. Pauley. 1987. Amphibians and reptiles in West Virginia. University of Pittsburgh Press, Pittsburgh, PA. 197pp.
McColloch, J.S. 1986. Springs of West Virginia. West Virginia Geological and Economic Survey, Morgantown, WV. 493 pp.
Merrill, E.H., T.W. Kohley, M.E. Herdendorf, W.A. Reiners, K.L Driese, R.W. Marrs, and S.H. Anderson. 1996. The Wyoming Gap Analysis Project Final Report. Wyoming Cooperative Fish and Wildlife Research Unit, University of Wyoming, Laramie, WY.
Munger, J.C., M. Gerber, K. Madrid, M. Carroll, W. Petersen, and L. Heberger, 1998. U.S. National Wetland Inventory classifications as predictors of the occurrence of Columbia spotted frogs (Rana luteiventris) and Pacific treefrogs (Hyla regilla). Conservation Biology 12(2):320-330.
Scott, J.M., F. Davis, B. Csuti, R. Noss, B. Butterfield, C. Groves, H. Anderson, S. Caicco, F. D'Erchia, T.C. Edwards, Jr., J. Ulliman, and G. Wright. 1993. Gap analysis: A geographic approach to protection of biological diversity. Wildlife Monographs 123.
Strahler, A.N. 1957. Quantitative analysis of watershed geomorphology. Transactions of the American Geophysical Union 35:913-920.
USFWS 1995. Metadata for National Wetlands Inventory Dataset. United States Fish and Wildlife Service, Washington, DC. [ftp://www.nwi.fws.gov/metadata/nwi_meta.txt], accessed 3/1/00.
Jacquelyn M. Strager
Research Coordinator
Natural Resource Analysis Center
West Virginia University
Morgantown, WV 26506-6108
Phone: (304) 293-4832 ext.4455
Fax: (304) 293-3752
Email: jrowe@wvu.edu
Charles B. Yuill
Natural Resource Analysis Center
West Virginia University
Morgantown, WV 26506-6108
Phone: (304) 293-4832 ext.4451
Fax: (304) 293-3752
Email: cyuill@wvu.edu
Petra Bohall Wood
West Virginia Cooperative Fish and Wildlife Research Unit,
Biological Resources Division, U.S. Geological Survey, and
Division of Forestry
West Virginia University
Morgantown, WV 26506-6125
Phone: (304) 293-2941
Fax: (304) 293-2441
Email: pbwood@wvu.edu