The US General Land Office surveyed the country's unsettled territories between 1785 and 1930 to subdivide the land for sale. As they proceded, surveyors noted the location and size of witness trees near each survey post and vegetative information for each mile surveyed. Their notebooks represent an invaluable source of information regarding the pre-European landscape. We extracted ecological information from the notebooks and compiled a statewide tabular database of Wisconsin's presettlement vegetation. The data is related to a GIS coverage of survey points for mapping and spatial analysis. We present an overview of the database and results from several applications.
Between 1832 and 1865, contractors to the United States government surveyed the largely unsettled lands of what today constitute the State of Wisconsin for the purpose of subdividing and selling land to settlers moving west from the eastern states and from Europe. The survey was carried out in a systematic manner, with survey posts set every half mile along a grid of one mile square blocks of land called sections. Although this was a land survey rather than a botanical survey or inventory, the field notes recorded by the surveyors contain abundant vegetative information that represent the most complete picture we have today of how the landscape and flora of Wisconsin appeared before widespread European-American settlement and the accompanying clearing, logging, and agricultural activities.
We reviewed the entire set of field notes for the state of Wisconsin and compiled tabular databases of biological and ecological information contained in the notes. The following paper provides a brief historical overview and description of the US public lands survey system (PLSS), its application to Wisconsin, an outline of our databases and their contents, a review of caveats and limitations to the use of the data, and an example of how the data has been used in the context of natural resources management. The databases we have compiled will be of enormous use to ecologists, foresters, planners, and land managers who are interested in the pre-European landscapes of Wisconsin and the subsequent changes to the land. However, they must be approached with care and a full understanding of the inherent biases contained within the survey that will affect how the data are used.
Cumulatively, the databases contain over 300,000 records with information about 185,000 survey points, 450,000 individual trees, and 23,000 ecological boundaries between ecosystems, all of which can be explored and analyzed using conventional statistical methods. In addition, the Wisconsin Department of Natural Resources has produced a geographic information system (GIS) database of statewide PLSS corners, to which the tabular data can be attached. This then allows for the mapping and spatial analysis of the information.
In 1785 the Continental Congress of the United States enacted the Land Ordinance which described a procedure for subdividing and disposing of the country's unsettled western territories. The federal government wanted to populate these territories and was already carrying a substantial debt from the Revolutionary War that it wished to retire with capital raised through the sale of land. The Surveyor General of the United States was appointed to supervise this survey and report to the Secretary of the Treasury. To further facilitate the survey, Congress established the General Land Office (GLO) within the Department of the Treasury in 1812. A method of rectangular land subdivision known as the public land survey system (PLSS) was developed in eastern Ohio in the late 1700s and applied westward across the country. The lands that are now within the State of Wisconsin were surveyed between 1832 and 1865, with 5 townships in Indian reservations completed in 1872, 1873, and 1891.
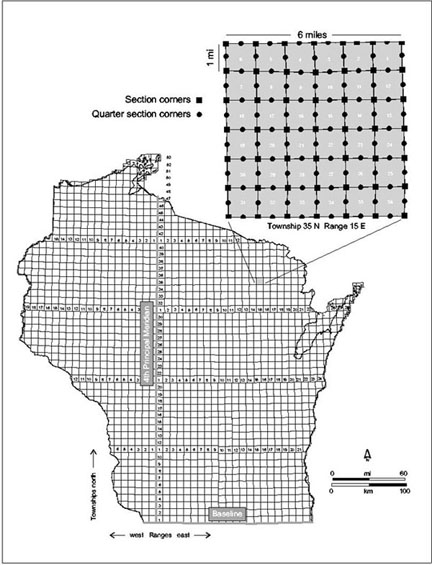
Under the public land survey system, the subdivision of a given area began with the establishment of two surveyed lines: an east-west trending baseline and a north-south trending principal meridian. Land was first divided by surveying east-west township lines parallel to the baseline and north-south range lines parallel to the principal meridian at six mile intervals. This resulted in a grid of square areas called townships, each six miles on a side. Townships were subsequently subdivided into 36 sections, each 1 mile square. The location of a given township is identified as so many townships north or south of the baseline and so many ranges east or west of the principal meridian. The baseline for Wisconsin was established with the survey of the northern boundary of the Illinois territory in 1832. The 4th Principal Meridian, which had been used in the survey of Illinois, was extended north from the baseline to Lake Superior.
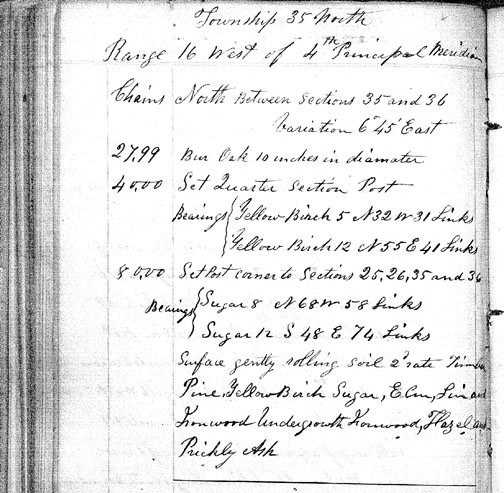
Distances along the survey lines were reported in chains and links. One chain equaled 66 feet (4 rods) and was comprised of 100 links. There were 80 chains or 8000 links to the mile. Survey posts were set along township and section lines every mile at locations designated as section corners. Additional survey posts were set at the midpoints between section corners at locations called quarter section corners. The presence of quarter section corners allowed for the future protraction of sections into quarter sections if desired. At each section and quarter section corner, a survey post was constructed of wood from the forest and set into the ground, and between 2 and 4 trees were identified as witness or bearing trees. The surveyors recorded into their notebooks the location of the corner, the type and diameter of each witness tree, as well as its compass bearing, or azimuth, and distance from the corner. In areas without trees such as prairies and marshes, mounds of earth or stone were constructed to mark the location of the corners.
Where a section line intersected a navigable lake or river, the surveyor set a meander corner on the shore at the point of intersection, surveyed around the water body to the opposite shore along the same section line, set another meander corner, and continued surveying. Meander corners were also established when survey lines intersected boundaries of Indian reservations or preexisting private land claims, although the surveys did not generally extend into these areas. Meander corners resembled section corners: survey posts were set into the ground and witness tree information (species, diameter, azimuth, and distance) was recorded in the notebooks.
The surveyor and his crew recorded other features that they encountered as they walked the section lines. The type and diameter of trees occurring along or very near sections lines, called line or station trees, were noted, as were significant natural and cultural features such as swamps, marshes, ridges, ravines, meadows, thickets, prairies, lakes, ponds, rivers, river bottoms, streams, springs, windfalls, burned areas, homesteads, fields, villages, roads, trails, and many others.
At the end of every mile of survey completed, the surveyor recorded the nature of the land surface (e.g., level, rolling, broken) and soil (first, second, or third rate) as well as the dominant timber and understory species seen along that mile. The field notes for many townships are followed by a general description of the township regarding its current physical characteristics, the presence of settlement or improvements, and its economic potential for agriculture or timber production.
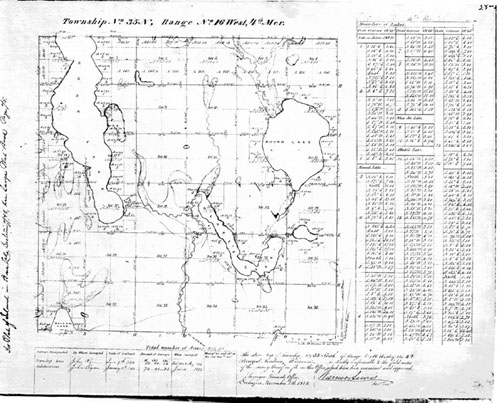
All field notes for the townships covered under a given contract were deposited with the Surveyor General at the district land office upon fulfillment of the contract. For Wisconsin, these offices were first in Cincinnati, Ohio, and later in Dubuque, Iowa. Government scribes and draftsmen in the district offices recompiled the notes into notebooks arranged in columns of townships and drafted accurate plat maps of each township at a scale of 1:63,360 (1 inch = 1 mile). Plat maps show the lengths of all township and section lines, the areas of each section and quarter section available for sale (with the area covered by meanderable bodies of water subtracted), water bodies, and some of the natural and cultural features mentioned in the notes.
More information regarding the General Land Office survey in the United States can be found in Stewart (1935) and White (1983).
We systematically went through microfilms of all the surveyors' notebooks for Wisconsin, extracted vegetation information, and entered it into a tabular database. Entries from the notebooks were assigned to one of four data types: section and quarter section corners, meander corners, line trees, and ecosystem points.
Section and quarter section corners: the section and quarter section corners represent the framework of the land survey and the most signigicant component of the database. There is a record in our database for each section corner and quarter section corner, and all witness tree data (species, diameter, azimuth, and distance) are included in these records. In the absence of witness trees, the codes in the database indicate if a mound or boulder was used instead, if a post was set but no trees were recorded, if the corner falls in a body of water, or if the corner falls in an Indian reservation or preexisting private claim.
Meander corners: the database contains records for all meander corners where posts were set and witness trees identified. Meander corner records contain the type of feature causing the meander (lake, river, claim, reservation, etc), the distance along the survey line where the feature occurs, and the witness tree data (species, diameter, azimuth, and distance).
Line trees: there is a record in the database for each line tree noted, including its type, diameter, and distance along the survey line. This data type is also used to record the location of cultural features encountered on the survey lines such as roads, trails, fences, houses, cabins, and mills.
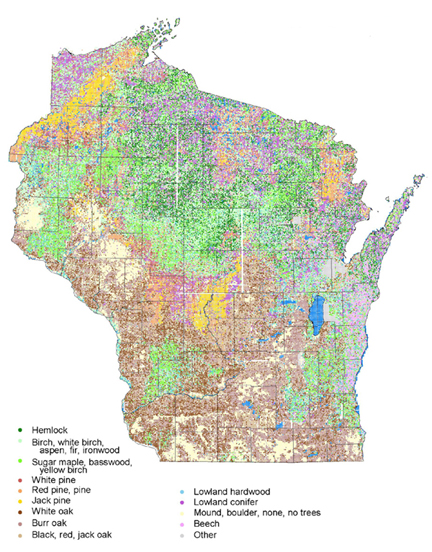
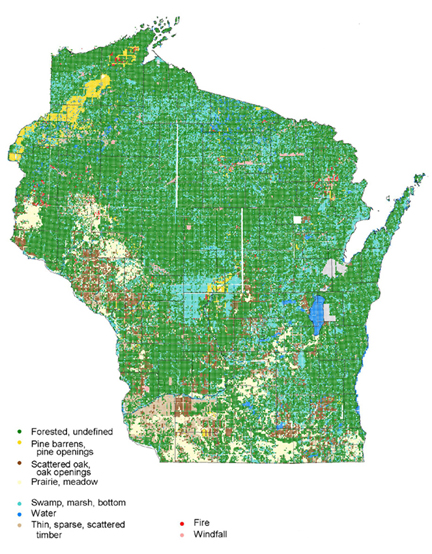
Ecosystem points: much of Wisconsin was forested at the time of the survey, but there were many other types of ecosystems present on the land and recorded in the notebooks. All data points contain a code indicating the type of ecosystem in which the feature occurs. For example, a section corner set in an oak opening in southwestern Wisconsin will have an ecosystem code of O. This is in addition to separate ecosystem points in the database that identify where the surveyor recorded entering and leaving that opening.
Each record contains the township, range, and section corner numbers. In the case of section and quarter section corners, this corresponds to the geographic location of the corner. In the case of the other data types, this corresponds to the corner from which the feature was measured. For example, the record for a line tree encountered 1000 links north of a given corner will contain the township, range, and corner number of that corner. The exact geographic location of the line tree can then be calculated by adding 1000 links (660 feet) to the x-coordinate of the corner from which it was measured.
Upon completion of data entry, 5% of all interior surveys and 5% of all exterior surveys were randomly chosen to quantify error rates. The contents of the database for these townships were printed out and compared to the original field notes, and errors introduced during data entry were tabuled by database field. Error rates for all fields except Ecosystem were less than 2%, and the error rate for Ecosystem field was less than 3%.
There are numerous issues regarding this database that must be taken into account when using the data. There is a great deal of variability seen in the field notes due to the long time period required to complete the survey and the number of individuals who worked on it. It took 34 years to complete the majority of the survey, as all but five townships were surveyed between 1832 and 1865. The basic framework of the survey did not change over time, but the General Land Office issued new sets of instructions to be given to the deputy surveyors in 1833, 1846, 1855, and 1855. Prior to 1855, general instructions were published as circulars and included with all contracts. Special instructions pertaining specifically to that contract may have been included as well. The instructions of 1855 were published as a more formal handbook, The "Manual of United States Surveying", thus standardizing the surveys in all parts of the country. The Manual was then updated and republished periodically, although most of these updates occurred after the completion of the survey of Wisconsin. Changes in the procedures affected the number of witness trees identified at a given section corner, the regularity with which line trees were noted, whether or not the surveyors who were subdividing townships into sections set posts when they reached township boundaries, and other aspects. A review of surveyors' instructions and how the changes affected the survey in Wisconsin can be found in Onsrud (1979).
Over 100 surveyors worked in Wisconsin over the period of the survey. There are many differences in the way individual surveyors conducted their surveys, beyond differences induced by changes in instructions. Many of these differences are obvious from looking at the data. Some surveyors consistently used genus names to identify certain trees (e.g., birch, pine) while most identified trees by species (e.g., yellow birch, red pine). Overall, 79% of birches, 16% of pines, 27% of maples, and less than 1% of oaks were identified in the notes only to the genus level.
The common names used to identify trees varied widely. What is called red pine today (Pinus resinosa) may have been called red, Norway, yellow, or sugar pine in the field notes. It appears that some common names migrated west with the surveyors and were applied to species in Wisconsin that resembled those known in the east. For example, pitch pines are noted throughout the survey although Pinus rigida is not found in Wisconsin. This common name was probably being applied to Pinus banksiana (jack pine), which ranges from New England to Minnesota. Other common names that appear in the notebooks are vague (e.g., yellow wilson, palm willow, blair). It is possible that these represent extremely obscure common names or typographic errors introduced during the transcription process, and overall they are very rare in the database.
Another obvious difference among surveyors is the volume of information they recorded. Some surveyors very regularly included one or two line trees between each section and quarter section corner and described in great detail the different ecosystems through which they passed. Some listed 6, 8, even 10 dominant timber species along a single mile. Others included no line trees, made no mention of changes in ecosystem, and listed one or two dominant timber species, if any. It is possible that these differences are due to real differences seen in the field or to the instructions the surveyors received, but it is equally probable that each surveyor had his own approach to surveying and his own interpretation of the instructions. For example, A. Millard subdivided Township 42 North, Range 9 East in 1861. He noted 20 meander corners and 102 line trees in addition to the 85 interior section and quarter section corners that are found in every township. Four years later J. McBride surveyed the township immediately to the west. He noted 85 section and quarter section corners, 11 meander corners, and no line trees. Clearly these two surveyors had different opinions as to the importance of including line trees in their field notes.
There are also differences between surveyors that are not so apparent from casually looking at the data, but have been identified through statistical analysis. Numerous studies have found biases in the species, diameters, and compass quadrant of the trees chosen as witness trees as well as the distance the trees lay from the survey post (Bourdo, 1956; Delcourt and Delcourt, 1974). Manies (in press) reviewed many of these studies and found statistically significant bias in the species and diameters of witness trees in data contained in this database for northern Wisconsin. Surveyors in her study area favored some species over others and appeared to prefer trees of certain size classes. These biases will certainly affect analysis of forest composition and structure.
Although we extracted presettlement vegetation information from the field notes in order to compile this database, the original survey was not conducted as a biological or botanical inventory. It was primarily a land survey, and the biological content was collected and included in the notebooks to support the survey. For the purposes of the survey, it was secondary to the location of the section corners. It is crucial to remember when using this vegetation data that it was collected by surveyors rather than botanists, and done so neither systematically, consistently, nor objectively.
Early surveyors' records have been used for many years to study pre-European settlement forests and landscapes of North America. The nature of the surveys was quite different between the eastern United States and the territories west of the original 13 colonies. In the former area, metes and bounds surveys commonly followed settlement and were very irregular, whereas in the latter the U.S. General Land Office surveys were conducted prior to widespread settlement. In both areas, the vegetative information contained in the survey records has been of great assistance to ecologists trying to better understand the natural history of the continent and the effects of European settlement on the land (see Siccama, 1971; Russell, 1981; Foster et al., 1998 for work in the eastern states; Bourdo, 1956; Iverson, 1988; Galatowitsch, 1990; for work in the midwestern and western public lands states; Kline and Cottam, 1979; White and Mladenoff, 1994; Radeloff et al., 1998; He et al., 2000 for work in Wisconsin).
Currently the database exists in tabular form and lends itself to statistical analysis. We have developed a procedure to attach the data to a geographic coverage of the section and quarter section corners called Landnet produced by the Wisconsin Department of Natural Resources (WDNR, 1996) in order to display the data on a map, perform spatial analysis on it, or combine it with other geographic data such as soils, geology, landtype associations, or current land cover within a GIS. Landnet contains the point locations for all corners, each uniquely identified by a code called corn-id, which is an 11 digit concatenation of range direction, township, range, section, and corner. For example, the section corner in the southeast corner of Township 35 North Range 15 East, section 36, has a corn-id value of 43515360000. Given the numbering conventions of Landnet outlined in its technical documentation, the identical corn-id values can be calculated for each section corner record in the presettlement vegetation database, and the data can then be attached to the Landnet's attribute table using standard relational database techniques. The x- and y-coordinates of any feature that occurs between section and quarter section corners (meander corners, line trees, and ecosystem points) can be calculated by starting with the coordinates of the corner from which the feature was measured. The distance contained in the Links field of the database (converted first to Landnet's geographic units, most likely meters) is then added or subtracted from the x- or the y-coordinate, depending on the direction from the corner the surveyor was traveling when he encountered the feature. Radeloff et al. (1998), Radeloff et al (1999), and He et al (2000) show examples of how this presettlement data were brought into a GIS and spatially analyzed.
This database development project was primarily funded by the Wisconsin Department of Natural Resources for the purpose of improving their planning process. They, as well as many other land and resource management agencies, are embracing the idea of ecosystem management. Ecosystem management refers to the process of developing plans or groups of integrated plans that account for all species and natural systems. This is in contrast to past practices in which individual agencies developed plans for the few species or resources for which they were responsible. For example, Fish and Wildlife developed a deer management plan, Parks and Recreation developed a recreation plan, Forestry established timber harvest goals and quotas, and the Natural Heritage Program worried about the effects of these programs on a locally threatened species. The concept behind ecosystem management is that these agencies should come together and develop a coordinated plan that allows for a full range of human activities and land use practices while maintaining the health and integrity of the ecosystem and all of its components.
Increasingly, land managers are using an understanding of past ecological conditions to guide the development of management plans. Hollings and Meffe (1996) identified a "Golden Rule" of sustainable natural resource management: "Management should strive to retain critical types and ranges of natural variation in resource systems in order to maintain their resiliency." In other words, a natural system is healthiest when all of its inherent subsystems and components are maintained, and this concept should be a goal of land management. The range of natural variation in this context refers to the historical range of ecological conditions, not just those observed today.
From the perspective both of achieving the desired goals and of cost, management plans will be most effective when they respect the natural variability of the area and work within its boundaries and constraints. For example, the reintroduction of a species to an area in which it once existed is more likely to be successful and less likely to have unexpected and unwanted effects than is the introduction of a historically exotic species. Moreover, if the goal of a plan is to achieve "old growth" conditions, it must be understood what those conditions were. One area may have been characterized by a heterogeneous forest with the giant trees we commonly associate with old growth forests. However, a nearby area with different soils and a different microclimate may have been prone to frequent wild fires, and the "climax" conditions there may have been characterized by a younger, less diverse forest.
Considering historical information about an area in addition to its current observable conditions deepens our understanding of ecological processes and systems. We use this understanding to evaluate the causes of ecological change and predict the consequences of current management practices. We can then develop management plans and set goals for the future with a better understanding of the potential consequences of the proposed plan (Landres et al., 1999).
See the Invited Feature on Uses and limitations of historical variability concepts in managing ecosystems, Ecological Applications 9, 1177-1278, for a thorough discussion of the importance of historical data and natural variability to ecology.
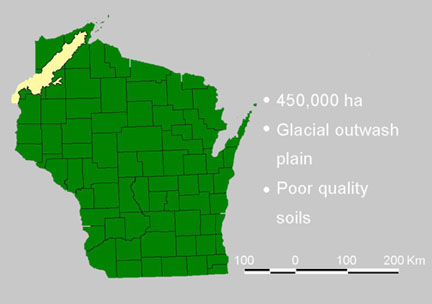
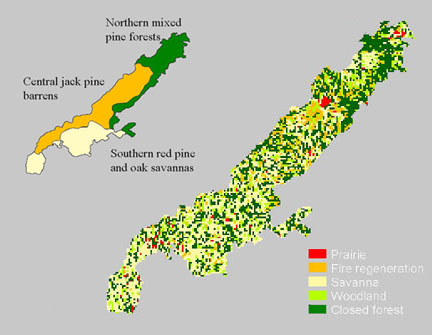
As an example of using the pre-European settlement vegetation database in the context of land management planning, I will briefly review the work and findings of Radeloff et al. (1999), who looked at the Pine Barrens region of northwestern Wisconsin to establish a framework for ecosystem management. The Pine Barrens cover 450,000 hectares of glacial outwash. Current forest cover is predominantly jack pine with lesser amounts of red and white pine; bur, red, and pin oak; and trembling aspen. Soils in the region are marked by coarse, nutrient-poor sands that are prone to drought. Current land ownership classes include national forest, county forest, private industrial forest, and small private holdings. Timber production from the national, county, and private industrial forests is an important economic activity in the region, primarily as pulpwood production from jack and red pine plantations.
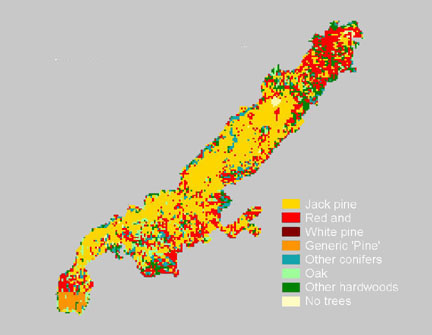
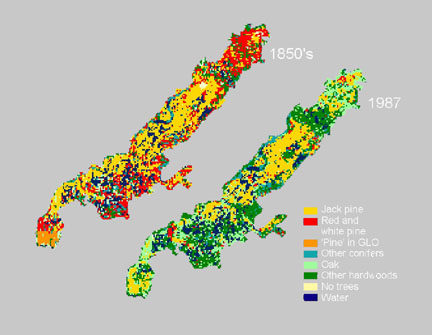
In this study, presettlement vegetation data were used to reconstruct the vegetation cover as it existed in the mid-1800s, which was then compared to the current forest to evaluate land cover change over time. For the presettlement period, the species of the first witness tree that the surveyor noted at each section and quarter section corner was assigned to that corner and converted to a grid. The central and southwestern regions were marked by an almost complete dominance of jack pine. The northern part contained a mix of red and jack pine with lesser amounts of white pine and hardwoods. The southern part contained a heterogeneous mix of the three pine species and oak.
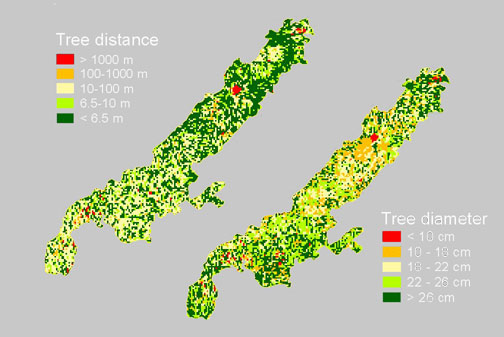
Presettlement forest structure was reconstructed from the witness tree diameter and distance information contained in the database. The distance data show a general trend of densest forests (smallest distances) in the northeast to more open forests (largest distances) in the southwest. Diameter data indicate the smallest trees were found in the central area and larger trees occurred to the north and south. Tree distance and diameter information were then combined to create a vegetation type map that reflects the historical fire patterns of the area.
The central and southwestern Pine Barrens contained jack pine with small diameters at medium to high densities. These areas were probably marked by severe stand-replacing fires to which jack pine is adapted. These fires killed the entire forest while melting the protective resin that covered jack pine cones. The cones then opened and released the seeds, allowing jack pine to quickly recolonize the area. The fires probably returned every 50-100 years, preventing other less fire-tolerant species from out competing jack pine.
The northern barrens contained large trees at high densities, indicating a more mature, closed forest. The presence of jack pine indicates that this area experienced large, high intensity fires, but these occurred less frequently, perhaps every 300-400 years. Jack pine colonized the burned areas immediately following the fire but were eventually replaced by red pine, white pine, or oak.
The southern barrens contained large trees at low densities, indicative of open woodlands and savannas. This area was probably marked by high frequency, low intensity ground fires, to which oaks and red pine are well adapted. Their thick bark is resistant to this type of fire, which would have killed the seedlings of other species and left the oaks and red pine.
Multitemporal satellite imagery from the 1990s was interpreted and classified to represent current forest cover. There is a clear shift in species composition from presettlement to current times. The central region is still dominated by jack pine, most of which is in pulpwood plantations, but the red and white pine in the northern and southern regions have nearly disappeared and been replaced by oak and aspen.
Currently the Wisconsin Department of Natural Resources is developing a process to generate management plans that incorporate the ideas of ecosystem management, and the northwestern Wisconsin Pine Barrens is a region in which the process is being tested. Several specific management issues have been identified from the results of the study outlined above. The first concerns an observed decrease in grassland birds in the area, such as sharp-tailed grouse. These birds live in open areas, and it has been shown that these openings must be of a certain size to support a viable population of birds. In the central barrens, where historically large stand-replacing fires occurred and opened up large areas (thousands of hectares at a time), it has been suggested that the clear cutting of jack pine plantations could be done in such a way as to mimic the pattern of historic fires. Specifically, multiple clear cuts could be carried out on adjacent jack pine stands to create a single large opening, rather that spreading them throughout an area. Furthermore, the reconstruction of the presettlement forest indicates where in the Pine Barrens region this type of activity should occur. While clear cutting does not have the same effects on an area that fire does, this proposed approach is an example of attempting to simultaneously meet the seemingly incompatible goals of timber harvest and wildlife management.
A second management issue raised by this study concerns the pine and oak savannas found in the presettlement forests of the southern barrens. Oak savannas are well known to have occurred throughout southern and western Wisconsin in presettlement times. Organizations such as the Wisconsin Department of Natural Resources and The Nature Conservancy are currently involved in maintaining reserves that contain this type of ecosystem. The existence of red pine savannas however is much less understood, and the results of this study have identified the location and substantial size of these savannas. Keeping in mind the concepts of ecosystem management and natural variability, it is possible that management plans for the Pine Barrens region will include the restoration of this type of ecosystem in the future so that this natural system will be found in the landscape again. And because we know where this ecosystem once existed, restoration efforts will be more successful if they are focused on the red pine savanna's historical range.
We have produced a database of pre-European settlement vegetation information for the state of Wisconsin. The database was compiled in a tabular format but can be attached to a GIS coverage of the public lands survey system section and quarter section corners. This will allow for both statistical and spatial analysis of the data. Development of the database was funded primarily by the Wisconsin Department of Natural Resources to assist with a wide range of planning needs. In addition, the database will be of great interest to ecologists, researchers, and other land management agencies, as they reconstruct past ecological conditions, evaluate and explain changes in the landscape over time, and plan for the future integrity of Wisconsin's environment and economy.
Bourdo, E. A. 1956. A review of the General Land Office survey and of its use in quantitative studies of former forests. Ecology 37, 754-768.
Delcourt, H. R. and P. A. Delcourt. 1974. Primeval magnolia-holly-beech climax in Louisiana. Ecology 55, 638-644.
Foster, D. R., G. Motzkin, and B. Slater. 1998. Land-use history as long-term broad-scale disturbance: regional forest dynamics in central New England. Ecosystem 1, 96-119.
Galatowitsch, S. M. 1980. Using the original land survey notes to reconstruct presettlement landscapes of the American west. Great Basin Naturalist 50, 181-191.
He, H. S., D. J. Mladenoff, T. A. Sickley, and G. R. Guntenspergen. 2000. GIS interpolation of witness tree records (1839-1866) for northern Wisconsin at multiple scales. Journal of Biogeography (in press).
Holling, C. F. and G. K. Meffe. 1996. Command and control and the pathology of natural resource management. Convservation Biology 10, 328-337.
Iverson, L. G. 1988. Land-use changes in Illinois, USA: The influence of landscape attributes on current and historic land use. Landscape Ecology 2, 45-61.
Kline, V. M. and G. Cottam. 1979. Vegetation response to climate and fire in the Driftless Area of Wisconsin. Ecology 60, 861-868.
Landres, P. B., P. Morgan, and F. J. Swanson. 1999. Overview of the use of natural variability concepts in managing ecological systems. Ecological Applications 9, 1179-1188.
Onsrud, H. J. 1979. A manual for resurvey of public land survey corners and sectionalized subdivision boundaries within the state of Wisconsin. MS Thesis, Department of Civil and Environmental Engineering, University of Wisconsin-Madison. 311 pp.
Manies, K. L., D. J. Mladenoff, and E. V. Nordheim. Submitted or in press. Surveyor bias in forest data of the U. S. General Land Office records for northern Wisconsin. Landscape Ecology.
Radeloff, V. C., D. J. Mladenoff, H. S. He, and M. S. Boyce. 1999. Forest landscape change in the northwestern Wisconsin Pine Barrens from pre-European settlement to the present. Canadian Journal of Forest Research 29, 1649-1659.
Radeloff, V. C., D. J. Mladenoff, K. L. Manies, and M. S. Boyce. 1998. Analyzing forest landscape restoration potential: Pre-settlement and current distribution of oak in the northwest Wisconsin Pine Barrens. Transactions of the Wisconsin Academy of Sciences, Arts, and Letters 86, 189-206.
Russell, E. W. B. 1981. Vegetation in nothern New Jersey before European settlement. American Midland Naturalist 105, 1-12.
Siccama, T. G. 1971. Presettlement and present forest vegetation in nothern Vermont with special reference to Chittenden County. American Midland Naturalist 85, 153-172.
Stewart, L. O. 1935. Public land survey. Collegiate Press, Ames, IA. 202 pp.
White, A. C. 1983. A history of the rectangular survey system. Bureau of Land Management, U. S. Department of the Interior. 774 pp.
White, M. A. and D. J. Mladenoff. 1994. Old growth forest landscape transitions from pre-European settlement to present. Landscape Ecology 9, 191-205.
Wisconsin Department of Natural Resources. 1996. 24K Landnet spatial database technical documentation. Bureau of Enterprise Information Technology and Applications, Geographic Services Section. 34 pp.