Disease
Transmission in Cattle and Horses: Spatial Analysis of Landscape Features
Associated with Vesicular Stomatitis
�
Susan A. Maroney and Jerome E. Freier
U.S. Department of Agriculture, Animal and Plant Health Inspection Service
Centers for Epidemiology and Animal Health
Abstract
Three major epidemics of vesicular stomatitis have occurred recently in the southwestern United States. Infection with vesicular stomatitis virus causes lesions to form around the head and hooves, making it difficult for infected animals to feed and results in significant weight losses. This disease can have important economic impacts on both dairy and beef cattle industries in the form of reduced productivity and the prevention of animal exports through international trade restrictions. GIS and spatial analysis methods were applied to individual case sites to establish patterns of clustering and to identify landscape features possibly correlated with disease transmission. Vegetation, terrain, hydrologic, and transportation factors were analyzed. Several spatial features were identified as common to infected animal locations and this information is now being used to predict the possible direction and spread of future outbreaks of this disease.
Introduction
Background
Vesicular stomatitis virus (VSV)� (Family Rhabdovirus, Genus Vesiculovirus) occurs in North and South America. This virus is endemic in Mexico and Central America and occurs sporadically in the U.S. There are two serotypes of VSV: New Jersey and Indiana. Immunity to one serotype does not protect against infection with the other. VSV primarily affects equines and bovines, and manifests itself in fever and blister-like lesions on the lips, tongue, palate, teats, and/or hooves of the affected animal. The result is lethargy, difficulty eating or suckling young, and weight loss. There is no specific treatment, but the disease is self-limiting and resolves itself in about two weeks (Fraser 1991). Animals are quarantined while clinical symptoms are present. The disease can be transmitted by arthropod vectors or by mechanical methods, including direct contact.
There are two reasons for concern about this disease: its similarity to Foot-and-Mouth Disease and its economic impacts. The symptoms of VSV are very similar to those of Foot-and-Mouth Disease, a highly contagious devastating bovine disease eradicated from the U.S. in 1929. In all susceptible animals, ELISA testing is used to confirm that the animal was infected with VSV. VSV causes decreased productivity in beef and dairy cattle and weight loss in cattle and horses. The presence of VSV in a herd triggers export trade restrictions preventing U.S producers from selling animals abroad. Domestically, noninfected states restrict the movement of animals from the infected states (USDA 1996).
Three epidemics of Vesicular Stomatitis Virus (VSV) have occurred in the U.S. in the past five years, in 1995, 1997, and 1998. The focus of this study is the 1995 outbreak. In 1995, the states involved were New Mexico, Colorado, Wyoming, Utah, Texas, and Arizona.� There were 329 confirmed cases in horses, cattle, three sheep, one pig, and one llama. The outbreak consisted entirely of New Jersey strain virus and lasted from May to November 1995. Cases were reported to a USDA emergency operations center. An investigator was sent to collect tissue samples from each suspected case. Geographic coordinates for each case were determined. Cases of the disease have not been reported in the U.S. in the past eighteen months. It is important to note that in all three outbreaks the only animals tested were those that exhibited clinical signs of disease. Unaffected animals on a premises at the time of the veterinarian's visit were not tested. Also, reporting of VSV cases to veterinary health authorities is voluntary. As a result, the true prevalence of this disease in the affected area is unknown.
Current Study
This study focused on the 1995 VSV outbreak consisting of 329 cases occurring in New Mexico, Colorado, Wyoming, Utah, Texas, and Arizona (Figure 1).
Figure 1. Extent of the 1995 VSV Outbreak
�
The mission of the USDA Veterinary Services is to protect and promote animal agriculture in the U.S.� Integral to this mission is tracking of livestock animal diseases. The intent of this study is to create a landscape epidemiology model, which relates disease occurrence to environmental factors. In such a model, spatial features like terrain, vegetation, and hydrology that are characteristic of the disease areas, are defined and used to identify areas at risk for new outbreaks.
Little is known about the method of transmission for VSV.� Insects as a vector of transmission is suspected, perhaps black flies (Diptera: Simuliidae) or phlebotomine sand flies (Diptera: Pyschodidae). Distributions and densities of vectors are difficult to obtain. These vectors usually live on a wide range of host animals including horses, prairie dogs, and wood rats. Mechanical means of transmission include transportation of infected animals and by fomites. The disease spreads rapidly with animal-to-animal contact.
With the cessation of new cases coinciding with the onset of cold weather, it appears that outbreaks are seasonal. This is indicative of a vector-borne disease. The first cases in a year are typically seen in late May and the last ones diagnosed in early November. These months coincide with the end and then the onset of cold weather in the Southwest.
Data Collection
Case and Cluster Definitions
Cases were identified from reports to veterinarians by owners of sick animals. The premises were located by the coordinates of the front gate. Case locations were documented at the time of the veterinarian's visit with a GPS receiver, or with a digital atlas after the fact. Coordinates collected with a GPS receiver were not differentially corrected. Polygon fitting was used to identify clusters from the complete data set of case points. Three case clusters were identified using a minimum polygon method (Figure 2). The minimum polygon algorithm of polygon fitting is a parametric statistical method for �connecting the dots.�� It draws line segments to connect the outermost dots, after defining outliers and setting a maximum line segment length.�� The three case clusters identified (called the Rio Grande Cluster, the Grand Junction Cluster, and the Cortez Cluster) are the basis for the remainder of the data gathering. The Rio Grande cluster contains 173 cases, the Grand Junction 104 cases, and the Cortez cluster 21 cases.�
Figure 2. Clusters of cases in
the 1995 VSV outbreak
Vegetation
Normalized Difference Vegetation Index (NDVI) Biweekly Composite images derived from Advanced Very High Resolution Radiometer (AVHRR) data were acquired from the USGS for March-December 1995. Brightness values, indicative of vegetation biomass, are calculated every two weeks from the visible band and the near infrared band to create the NDVIs.� The brightness value for each case location in each cluster is extracted from each NDVI for the period March - December 1995 and exported to a database table. The resolution of NDVIs is 1.1 kilometers. Although small scale for environmental analysis, NDVIs can give an idea of biomass changes in the area around each case over the months in question.
Hydrology
For each cluster a hydrology data layer was imported from Bureau of the Census TIGER/Line files for the counties containing VSV cases. ArcView's Geoprocessing Wizard was used to calculate distance from each case in the cluster to the nearest water feature.� Many of the TIGER water features are identified as ditches or canals, as differentiated from rivers and streams. This distinction is important in locating potential vector habitats; difference in velocity of water flow and vegetation on the banks create suitable habitat for different vectors.
Terrain
Terrain features include elevation, slope, and aspect of each case in the three clusters. USGS digital elevation model (DEM) data were acquired for each cluster.� They were mosaicked using the Mosaic GRID Themes extension for ArcView found on the Esri web site.� These 10-meter resolution data layers provide point elevation data for each case in a cluster. The elevation value of the cell under each case was exported to a table. In addition, slope and aspect for the cell under each case location were calculated and exported to a table in preparation for spatial analysis.
Spatial Statistical Analysis
The data layers described above were all compiled into several database tables for use as input to statistical analysis. Preliminary statistics have been completed to date; detailed analysis and comparison with other outbreaks are continuing. Tools used include ArcView with Spatial Analyst, S+ for ArcView, Lotus Approach, and EpiInfo (a database and statistics program for epidemiology).
�
Temporal Analysis
Figure 3 reveals a temporal aspect to the cases. In this figure, the cases in all three clusters are graphed against quarantine date. Note how the early cases (June and July 1995) appear at lower latitudes (more southerly) and the later cases (September and October 1995) occur further north. This northward movement of the virus as the warm season progresses holds true for the 1997 and 1998 outbreaks.
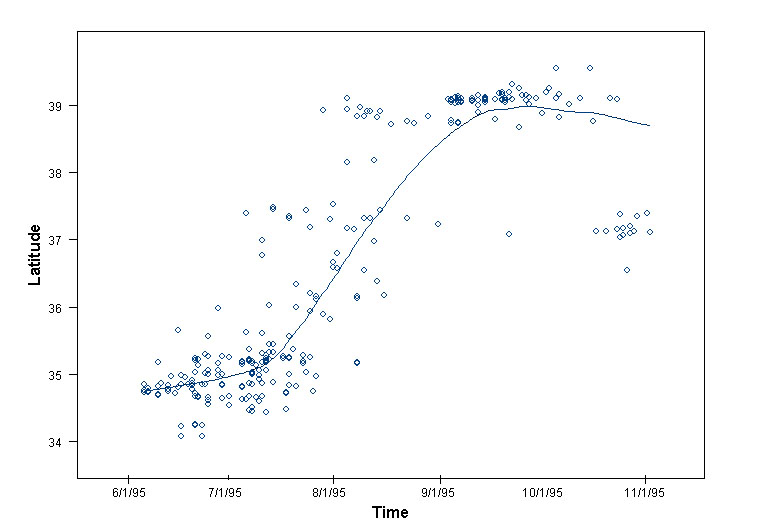
Figure 3. Comparison of latitude
and quarantine date
Vegetation
The incubation period for VSV is approximately two to eight days, or more (Fraser, 1991).� The NDVI value for each two-week time period that included a quarantine date for a case was extracted from the NDVI data for the Southwest for March-December 1995.� To cover the incubation period, the value for the two-week NDVI period immediately before the one containing in the quarantine date was also extracted.�� A histogram of these two NDVI periods for the Rio Grande cluster is shown in Figure 4. Note that the NDVI values have been scaled; instead of �1 to 0 to +1, they have been scaled to 0 to 100 to 200.� The values from 100 to 200 represent the vegetated pixels.