Loudoun County Virginia is the fourth fastest growing county in the United States. To preserve farmland and openspace, the Loudoun County Board of Supervisors directed a subcommittee to create a purchase of development rights program and gave them three months in which to do it. A team was assembled that included staff from several County departments, including the Office of Mapping and Geographic Information, to develop and build a model that was flexible due to the short time frame and the unknown outcome. Discussion of this process will cover data collection, compilation, modeling in ArcInfo and Arcview, analysis, and results.
Loudoun County, Virginia is one of the fastest growing counties in the nation. In an effort to protect the rural economy from rapid growth, the Loudoun County Board of Supervisors appointed a committee to investigate the feasibility of instituting a program to purchase the development rights of eligible parcels. Under a tight deadline, the study drew participation from many County government departments, including the Office of Mapping and Geographic Information. The initial request for assistance eventually led the department to update and create new data, build a model capable of ranking property eligibility based on changing criteria, and produce over 50 maps.
Loudoun County, Virginia is approximately 25 miles northwest of Washington D.C. The area’s rural character began to change in the 1960s with both the construction of Washington Dulles International Airport and the re-zoning of most of the County to one dwelling unit per three acres, which promoted the creation of subdivisions to house new workers. In more recent years, Loudoun has become a center of technology, drawing the likes of America Online and MCI Worldcom. Recently bumped from third to fourth fastest growing U.S. county by a growth spurt in tiny Sussex County, Virginia, Loudoun continues to add over 1000 new residents monthly. The population has doubled in the last decade, rising from 86,000 to an estimated 172,000.
As the County’s rapid growth sparks controversy between pro-development and anti-sprawl advocates, one thing has become very clear: Loudoun’s rural economy is at risk. Residential and commercial construction has created increased land values, forcing many farmers to sell to the highest offeror, usually a developer. In addition to effecting the agricultural, livestock, and horticultural economy, which produced combined revenue of 53.4 million in 1998, rising land values endanger historic properties and scenic viewsheds. Tourism is ultimately effected as well.
Recognizing the need to take action, the Board of Supervisors assigned the Rural Economic Task Force to examine the problem. In addition to many other suggestions, a purchase of development rights program was proposed.
Property ownership typically includes several rights, including the right to develop. In a purchase of development rights program, the right of development is separated from the land. The owner retains the ability to sell, lease, use, build on it (within the constraints of the development rights purchase agreement), mine, bequeath, or borrow against it. In exchange, the landowner receives a cash amount, as well as the benefit of lower taxes due to the decreased value of the land. Development rights may be permanently separated from the land, or the landowner may have the right to re-purchase at a later date (the City of Virginia Beach, VA. allows the re-purchase after fifty years). Some programs allow the transfer of development rights (TDR) – developers in other parts of the jurisdiction purchase rights for purposes of increasing build out density on a different property (i.e. a developer with land zoned one dwelling unit per acre may purchase rights to change zoning to five units per acre).
After hearing the task force report, the Board of Supervisors assigned the Open Space Advisory Board Committee (OSAC) to study the feasibility of establishing a purchase of development rights program in Loudoun County. OSAC formed a subcommittee, which also included members of the Rural Economic Development Task Force, the Agricultural Advisory Committee, the Council of Loudoun Towns, and two individuals representing urban interests. At a July 1999 meeting, the Board of Supervisors agreed with the subcommittee’s recommendations that in order for the program to be successful, it should involve the permanent separation of development rights, be eligible to all County parcels, and be implemented as soon as possible. The subcommittee was directed to design a program, the results of which were to be presented before the end of the term of the current board – less than six months away. Several departments, including County Administration, the County Attorney’s Office, the Budget Office, the Department of Planning, and the Office of Mapping and Geographic Information, were directed to assist.
Although the Office of Mapping and Geographic Information (OMAGI) was not officially formed until 1994, Loudoun County’s GIS had a much earlier start. In 1978, a hardcopy base map for environmental planning was developed. A more efficient method of dealing with geographic data in the growing county was needed, however, and in 1986, the Board of Supervisors approved the development of a property GIS. Address maintenance began on the GIS the next year; environmental data, such as soils, floodplain, watersheds, and drainage were digitally captured as well. Initially a part of the Environmental Resources department, the GIS was put at risk in the early 1990’s, when the pro-growth board voiced concerns that environmental regulation might hinder development. While the Environmental Resources department was eliminated, the GIS continued to update and create core data sets as an office under the County Administrator. The benefits of a GIS were soon recognized, and in 1994 the Office of Mapping and Geographic Information was established as an independent department.
The mission of the department is to improve efficiency of Loudoun County government through programs that maintain, distribute, and facilitate the use of land related information. Base map data layers are updated through yearly aerial photography and site plans; other data sets such as parcels, addresses, zoning, street centerline, geology, and soils are maintained by the data owners. The owners may be another County department, such as the Building and Development Department, who own soils and floodplains, or another jurisdiction, such as the Town of Leesburg, who own town address and zoning data. County addresses and parcel data are maintained daily by OMAGI through record plat submission.
In the last few years, OMAGI has worked with the Department of Information Technology, Financial Services, and several other departments to create LMIS – the Land Management Information System. LMIS consolidates the formerly independent databases of permits, inspections, and land development applications into one database. The tables are linked by parcel identification numbers, which are updated in LMIS through data feeds from OMAGI. The front end of the system is a user friendly interface that allows for standard queries on the data and for customized queries developed by the user. LMIS gives all County staff the ability to query on a wealth of County data including spatially derived characteristics from the GIS.
OMAGI also develops and offers courses to other County employees on ArcView, LOGIS (an in-house written AML access interface to the GIS), and basic GIS. OMAGI had previously successfully collaborated with other departments to perform geographic analyses and create maps for a variety of special projects for the board of supervisors and its commissions. OMAGI also maintains a relationship with the public, through access of GIS layers via LOGIS, a public counter staffed with knowledgeable information specialists, and maps and data distributed at cost of reproduction.
After much debate and review of other programs, the committee developed a list of information they wanted to review to support the development of a potential purchase of development rights program. Because concern that the more highly subdivided and developed eastern part of the County would be excluded from the program, criteria were broken down into two categories: farmland (agricultural) and openspace (non-agricultural). This breakdown insured that openspace and parcels of historic importance in the eastern portion of the County would be given equal consideration for program eligibility. OMAGI staff supported the committee’s weekly meetings and translated the information needs into data requirements of the spatial model.
The categories of data under review included parcel based information, such as parcel size and contiguity, existing subdivisions, houses, and openspace easements; environmental factors such as wetlands, floodplains, soils, and forests; existing County programs such as the land use value taxation program, agricultural districts, special zoning districts, and historic districts; existing commercial practices such as specialty farming, farm type, and location of farm related business; and cultural factors such as utilities, historic sites, reservoirs, trails, recreational facilities, and existing openspace. The complete inventory of data required to support the criteria is listed in Appendix A.
Much of the base data were located in Loudoun County GIS data libraries (using the ArcInfo Librarian module), stored in both multi-tiled libraries (such as parcels, environment, and planimetric base map data) and single-tiled libraries which encompass the entire county. The attribute data in the library layers alone, however, were not enough to generate the information the subcommittee required. For example, parcel data in the GIS contains the Parcel Identification Number (PIN), generated for each new parcel in the county. The data also contains information related to the plat, such as deed book and page, legal acreage, GIS computed acreage, the plat number, and a code that denotes the source of the digital data. In order to determine parcel contiguity, it was necessary to join ownership information to parcel data. Other data sources maintained by the County that were referenced were LMIS and the tax assessment database (CARAT).
Some data in the libraries did not exist in a usable format. Forests had historically been captured as line features for cartographic base-mapping purposes, not polygons. This meant OMAGI had no easy way to determine the number of acres of forest on a parcel. Although an effort to convert the forest lines into polygon features was initiated, concern that the tight schedule would not leave time to complete the conversion led OMAGI staff to focus the effort on areas of steep topography. This addressed the need to assist in an improved delineation of the Mountainside Protection District, which include areas comprised of steep slopes, elevation, forests, unstable soils, and groundwater recharge areas. Staff used information gleaned at the Nineteenth Annual Esri International User Conference in 1999 to obtain Landsat landcover data, which was used to quickly create a forest cover layer while the conversion of base map forest cover progressed.
Other information was needed that was not maintained by the County and therefore not available on the County GIS or in County databases. Historic sites maintained by the County planning department on hardcopy on USGS quadrangles existed, but the effort to digitize and verify the information was considered too time consuming. The planning department provided a list of National Registered Historic Sites, which were located by address. Civil War battlefields in Loudoun had been independently researched by a subcommittee member, who gave what information he had to OMAGI. Historic districts, which were maintained on the GIS, were incorporated. From the combined data, the subcommittee was able to generally discern the historic significance of areas within the County.
Other sources of information used to develop products included the U.S. Fish & Wildlife Service World Wide Web site used for the National Wetlands Inventory, the local planning district (NVPDC) map of existing openspace, and the U.S. Geological Survey study of geology specific to Loudoun County.
While data collection was ongoing, criteria were being defined by the subcommittee to clarify PDR program participation requirements. For example, the soil layer might be the support data required to locate good farmland, but the criteria to be examined were primary and secondary agricultural soils, slope and septic suitability. Identification of parcels in the Land Use Value Taxation Program established base data, but total acreage and possible land value had to be determined to meet criteria. Some data, however, such as trails or recreational facilities, were self- explanatory and additional criteria were not required for program evaluation. Other data, such as wildlife habitats or scenic vistas, were simply non-existent, and it was not possible to generate or acquire it in the timeframe.
Weekly meetings of Mapping Office staff helped to clarify and communicate the needs of the committee and the status of the project within the mapping office. Technical notes from these meetings and any other documents generated by mapping staff were stored in a shared directory on the County’s network server. This system of document storage helped with data dissemination and accessibility.
Technical notes defined what was reviewed at each meeting, data sources and status, project organization, timelines, assignments, and documented system issues.
A workflow model was generated and used to illustrate the decision tree in map compilation (figure 1).
Figure 1. Workflow Model Diagram
To assist in organization of the project a directory structure was established on the GIS server to catalogue and organize the information (figure 2). Readme files were generated for each data folder.
Figure 2. Directory Structure
Directories were created to store data elements that were common to various products and to compartmentalize data into project folders.
The directory /tables contained definitions and descriptions of criteria in the form of database tables, such as ArcInfo lookup tables, ASCII files, and ArcView .dbf’s.
The directory /maptools contained files that could be used on each map, such as a map template and a shapefile of all parcel records for the County. The use of a common shapefile saved system resources by having to create and store one shapefile from the library coverage, increased speed of ArcView by accessing a shapefile versus real-time library data, and gave the many products some consistency in base information, especially given the frequency of updates.
The directory /finalplots was the source for final mapped information. Staff would generate a draft product in the working directory and move it to this directory when it was a final.
Organizing the project in this manner provided better management of the many data compilations that were occurring simultaneously.
Two modeling methods were considered for PDR program data: parcel-based and resource-based. The first step in either process is to rank the data based upon criteria created by the subcommittee. For example, the PDR committee decided parcels adjacent to designated scenic rivers, byways, or ridgelines are more desirable for program consideration than non-adjacent parcels. Adjacent parcels were assigned the highest ranking, parcels within Ľ mile of features of interest received a lower ranking, and all other parcels were not ranked. Data layers are rasterized, which converts the assigned values of polygons, points, or arcs to grid cells.
In parcel-based modeling, the results are dependent upon parcel boundaries. Data layers are combined with the rasterized property boundaries layer, resulting in the assignment of a single value to each parcel. Parcels with the highest ranking are considered the most desirable for PDR program participation.
Resource based spatial modeling calculates the importance of an area dependent upon a grid. Vector data are assigned a ranking based upon criteria value. The data layers are then summed into a final grid, which assigns a single value to each grid cell. The assigned value of an area is then evaluated independent of the relationship with property boundaries. The property boundary layer can then be added to the data, and parcels that contain the greatest concentration of resources are considered for the program. Unlike with parcel-based modeling, however, values are not calculated based on parcel boundaries (i.e. the final number is not an average of all values within a parcel). Variations within parcels are more apparent.
Although either process may be used to predict the land most desirable to preserve based on specific criteria, the results will vary. In parcel based modeling, results are dependent upon the non-random location of property boundary lines. If a parcel boundary is altered, the results of the model will change (for example, if a parcel adjacent to a designated scenic river, byway, or ridgeline is subdivided and the new parcel looses adjacency to the desirable features, then the parcel ranking will be lowered, making the parcel less likely to be considered for PDR program participation). Parcel-based modeling, however, may ultimately make for easier development rights purchase. Resource based spatial modeling results are less likely to change, although results can vary depending on selected grid size. Because criteria values are not averaged over the entire area of the parcel, this method of evaluation increases the likelihood of identifying "hot spots" deemed important by PDR program criteria, which could allow selection of parcels based on particular features.
The resource modeling method may allow for more efficient detection of resources that are desirable to preserve, but the list of requirements for eligibility in the PDR program was created with a parcel-based approach in mind, as are most PDR and TDR (transfer) programs. This was the modeling method selected to analyze data for development of a Loudoun County PDR program. The concept of processing data, whether resource or parcel based, is illustrated by figure 3.
Figure 3. Model Flow: By Mike Fauss and Scott Sizer
The model specifications defined by the committee were defined as the Parcel Ranking System (PRS). The PRS used factors and criteria descriptive of the parcel. Each criterion was assigned a rank relative to its importance in comparison with other criteria (see Appendix B). The values of all criteria were summed, and properties with the highest score were given acquisition priority.
Grids defined by resource and parcel criteria were created and summed based on the criteria, then merged into a grid of final ranking. The final grid would allow for summation of all codes and the creation of a table containing parcel identification numbers and total score. The table was then used with the County’s parcel data to create a vector map of the results.
In order to consider parcels from both the larger rural western portion of the County and the more developed eastern part, two categories of criteria were established. Sixty-percent of program funds were allocated for parcels that are agricultural in character. Criteria were weighted seventy-five percent towards agricultural characteristics, while twenty-five percent were directed at natural, historic, and scenic resources, as well as character of urban development. The non-agricultural resource category aimed at the eastern portion of the County garnered forty-percent of the funds. These parcels were evaluated for natural, historic, scenic resources, or character of urban development characteristics.
Some parcels were eliminated from consideration because of pre-existing openspace uses such as parks. Also, incorporated towns that lacked zoning information in digital format or lots less than 1/6 of an acre were excluded. As a final caveat, it was acknowledged that it was not possible to capture some data digitally. Therefore, the corresponding eligibility criteria were not included in the final model and the final outcome could potentially change as a result.
The idea of using ArcInfo Grid was established early in the project as a fast and efficient means to model criteria. Grid was used to classify, merge, and summarize the data by the PRS. AML’s were used to automate repetitive processing.
Some thought was given to providing the subcommittee with an interactive tool that would allow modeling on the fly so the results of criteria manipulation might immediately be seen. Due to timeline and workload constraints of the subcommittee, however, this option was not pursued.
Grid was used to convert data from vector to raster using a cell size of 10 feet. A master grid of the County boundary was created. The area out of the boundary was assigned a value of NO DATA, and the grid was then used to set the window and mask of the analysis environment to ensure that features out of the boundary would not be processed. Polygon coverages were converted using POLYGRID; likewise, arc coverages were converted with LINEGRID and point coverages with POINTGRID. Lookup tables were used to define grid cell codes. Related data sets were combined with MERGE. When it became necessary to assign values based on parcel contiguity, some grids were processed first with the EUCDISTANCE command. This command calculated the distance for each cell to the closest source. A distance of 2000 feet was used to cap the calculation.
Grids were subsequently processed using the command RECLASS to change the cell value based on the distance calculation using tables appended with ".lut". RECLASS was again used to convert the distance derived cell value to the subcommittee-defined weights, using tables appended by ".val". The command MAX was used to determine the maximum value of the cells based on the weights of multiple grids within a set of criteria. COMBINE was used to derive the values of both input grids while retaining the value of the source grids. (See Appendix C: GRID Code Sample).
Processing of parcel based resources and the table of final ranking were dependent on the unique parcel number assigned for each parcel. The parcel number is defined in the parcel database as a nine integer field with values ranging from 1,000,000 to 701,000,000. There are over 68,000 parcels in the County. Since the range of numbers and the number of records for the parcel number exceeded the limits of the Value Attribute Table (VAT), a lookup table was created that assigned a smaller unique number for each parcel number.
Parcel grid creation included multiplication of this unique value by one hundred. When grids were merged, the new parcel values were summed with the other grid weighted values. Post processing resulted in a table of the original unique parcel values and weighted results. Weights were summed or averaged, depending on the defined criteria, to arrive at a total score per parcel. The unique value was linked back to the parcel number and the results were mapped.
In many circumstances throughout the PDR program development, the questions asked by the subcommittee were answered in the form of a map. All maps produced for the program fell within one of two categories: resource or model maps.
In order to educate the subcommittee as to available geographic resources, OMAGI produced over 25 resource maps. The resource maps were strictly representational of data; i.e. no analysis was performed. Some examples of resource maps were Existing Landuse, Historic and Scenic Sites, Expiration of Agricultural Districts, and Parcels by Size (see figure 4).
Figure 4: Resource Map
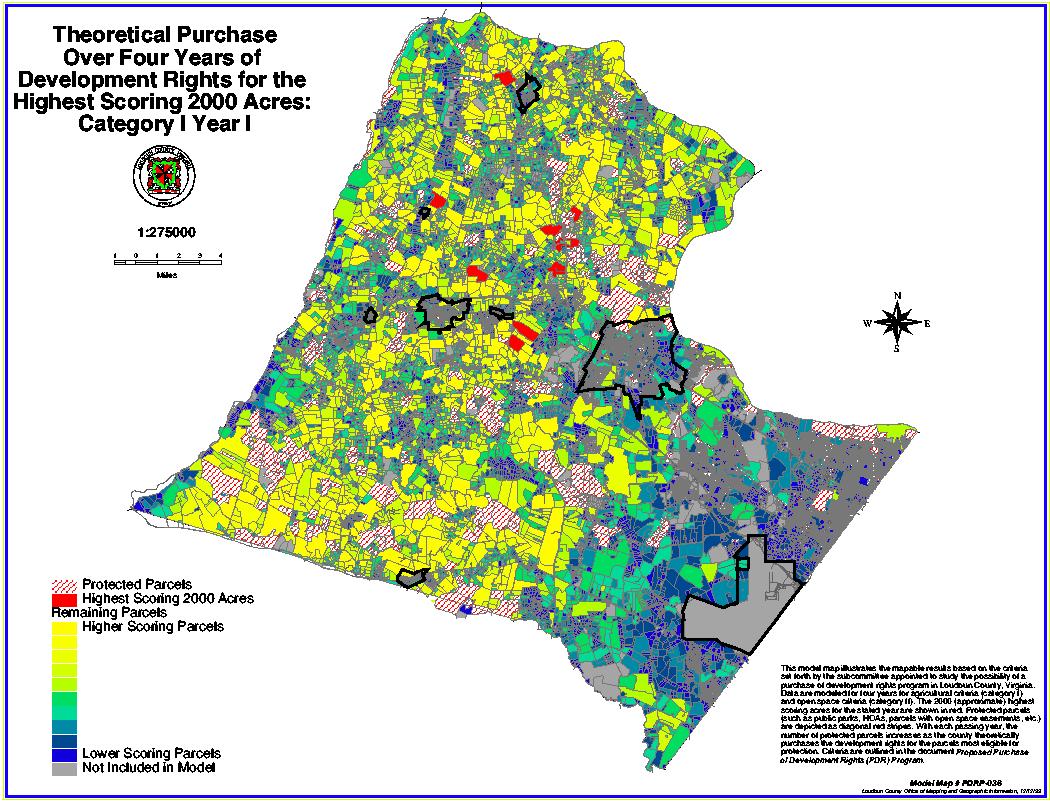
The data on the model maps, however, were dependent on the criteria established by the subcommittee. Changes in criteria resulted in changes on the model maps. In some circumstances, the data were not only dependent upon criteria values, but upon data results from other model maps. For example, the result maps represented the total purchases of land over a four year period; each progressive map was dependent upon the results of the previous year (see figure 5). Some examples of data that appeared in the model maps were availability of water, steep slopes, active farms, and proximity to urban growth areas and traditional villages.
Figure 5: Sample Results Map
To maintain map consistency, a generic map was created in ArcView. When a cartographer was assigned a map, she or he copied that project file to a new working directory and used it as a reference template. Model maps were distinguished from resource maps by a slightly different neat line around the border and by an identifying tag line next to the map number. Two different map scales were created: 1:75,000 and 1:275,000. The larger size allowed for easy viewing in subcommittee meetings and at public hearings, while the smaller size fit within the subcommittee final report.
After six months of mapping and modeling support from OMAGI, the committee completed the project by the Board’s deadline. At the December board meeting, supervisors unanimously agreed to postpone presentation of the findings until the new board took office. In a January 2000 meeting, the new board voted to establish a purchase of development rights program, which was funded at $4,000,000 per year over four years.
In addition to the successful adoption of the program, several data sets were improved in both quality and quantity. Additionally, the capabilities of GIS were demonstrated to a wide and influential audience, resulting in expanded access and use of the system.
The PDR project involved staff from many offices of Loudoun County government without whom this project would not have been a success. As the Office of Mapping played a key role in the project our thanks to them and in helping to make this paper possible, especially Larry Stipek, Director; Mike Fauss, Analyst; and Scott Sizer, Technician.
Data Collection to Support
Purchase of Development Rights Program Development
Data: Source: Criteria
-soils: environment.soils: Primary agricultural soils, Secondary agricultural soils, Septic suitability
-parcel size & contiguity: parcels.parcels, LMIS: legal-acre, owner
-considerations for specialty farming: environmental, soils: elevation, slope, etc.
-existing subdivisions & houses: parcels.subdivisions, parcels.address, buildout coverage: legal acre
-utilities: pctbase.sewer, pctbase.water, Loudoun.towns
-UGA: loudoun.uga
-existing farms by type/Century Farms: CARAT/LMIS:LU type, ag type
-land use value program: CARAT/LMIS: program participation, acreage, value
-value of land (isopleth of MCPI points?): CARAT/LMIS
-location of farm related business: agricultural extension, business licenses
-agricultural districts: parcels.agdist
-zoning: parcels.zoning: ag zoning, non-ag zoning
-leased vs. owned farms
-existing open space easements: parcels.openspace
-existing openspace: parks coverage, NVPDC map, LMIS ownership
-trails and recreational facilities: parks and recreation dept.
-forest: environment.forest
-wetlands: NWI-US Fish&Wildlife, hydric soils
-floodplain: environment.floodplains
-reservoirs: environment.water
-aquifers: environment.soils, geology (USGS)
-recharge: environment.soils
-native plant communities:VA Dept of Conservation
-Wildlife habitat (NA)
-Watersheds: loudoun.majsheds
-scenic vistas (NA)
-conservation easements
-scenic rivers
-mountainside overlay
-karst
-parcel size and contiguity
-historic and archaeological resources: VA Dept of Historic Resources
-historic roads, bridges, fences
-scenic byways: VDOT, BOS
-historic districts: parcels.historic
-land use change: Landsat 1988/1996
|
CATEGORY 1: AGRICULTURAL RESOURCES |
|
Agricultural Criteria (worth 75% of total score based on total points) |
|
1. Proximity to protected (eased) property, agricultural/forestal districts and/or public parkland |
|
|
24 Points 19 Points 10 Points |
2. Availability of water |
|
|
(a) Contains a major stream draining more than 640 acres (b) Contains a minor stream draining between 100 and 640 acres (c) Contains a stream draining less than 100 acres or a year round spring or pond |
24 Points 19 Points 10 Points |
|
3. Type of soil |
|
|
(a) Primary cropland (0.25 points per 1% of primary cropland up to 100%) (b) Secondary cropland (0.12 points per 1% of secondary cropland up to 100%) |
Up to 25 Points Up to 12 Points |
|
4. Size of parcel(s) offered for easement (in gross acres) |
|
|
(a) 200 acres or more (b) 100 to 199.99 acres (c) 25 to 99.99 acres |
20 Points 15 Points 10 Points |
|
5. Entire farm to be placed under easement 20 Points |
|
|
|
|
|
6. Amount of property with active cropland, pastureland, or woodland uses |
|
(0.24 points per 1% of active cropland, pastureland, or woodland uses up to 100 %) |
Up to 24 Points |
7. Farm infrastructure |
|
|
20 Points
15 Points |
|
8. Estimated carrying capacity (based on County Zoning and Soils Model) |
|
|
(a) Average estimated lot size less than 4.0 acres (b) Average estimated lot size between 4.0 and 9.9 acres (c) Average estimated lot size over 10.0 acres |
20 Points 10 Points 5 Points |
9. Purchase price is leveraged using other funding sources including but not limited to state, federal, foundation funding, or private donations |
|
(0.5 points for each one percent of purchase price leveraged up to 50%)
|
Up to 25 Points |
10. Purchase price is below market value |
|
(0.5 points for each one percent below market value up to 50%)
|
Up to 25 Points |
Non-Agricultural Criteria (worth 25% of total score based on total points) |
|
11. Proximity to any of the following critical environmental areas: wetlands, major floodplains, steep slopes, woodlands, stream headwaters, and/or mountainside areas (critical elevation). |
|
|
(a) Property contains critical environmental area (b) Property is within Ľ mile of critical environmental area
|
7 Points 4 Points |
12. Proximity to special natural habitat |
|
|
(a) Property contains or is contiguous to endangered or threatened species habitat or is part of a designated wildlife refuge or corridor (b) Within Ľ mile of such areas
|
6 Points
3 Points |
|
13. Amount of property with high ground water recharge potential |
|
(0.06 points per one percent of property with high ground water recharge potential up to 100%) |
Up to 6 Points |
14. Provides buffer between distinct communities. 6 Points |
|
|
|
|
15. Property affords an opportunity to link open space or recreation resources. 7 Points |
|
|
|
|
16. Property is associated with an important historic place, event, person, or activity |
|
|
(a) National, state, county or local significance (b) Property is adjacent to such areas
|
7 Points 4 Points |
17. Property contains an archaeological site |
|
|
(b) Archaeological site eligible for designation
|
6 Points 3 Points |
18. Property is an established or familiar visual feature that is part of an historic landscape. |
|
|
(a) Symbol of the County’s identity or reflects the County’s settlement or development patterns (b) Symbol of a community or local area.
|
6 Points
3 Points |
19. Proximity to designated scenic byway, river, and/or ridgeline (as defined in the General Plan) |
|
|
(a) Includes frontage along designated scenic byway, and/or portion of a scenic ridgeline or river. (b) Is located within Ľ mile or adjacent to the buffer of a designated scenic byway, ridgeline, or river.
|
7 Points
4 Points
|
open fields, waterways, hedgerows, stone fences, etc. 6 Points |
|
|
|
|
21. Proximity to UGA, town, or traditional village boundary |
|
|
(a) Contiguous with UGA, town, or traditional village boundary (b) Within Ľ mile of UGA, town, or traditional village boundary |
6 Points 4 Points |
22. Located in an Urban Growth Area (UGA) 3 Points |
|
|
|
|
CATEGORY 2. NON-AGRICULTURAL RESOURCES (NATURAL, HISTORIC, & SCENIC RESOURCES, AND CHARACTER OF URBAN DEVELOPMENT) |
|
1. Proximity to any of the following critical environmental areas: wetlands, major floodplains, steep slopes, woodlands, stream headwaters, and/or mountainside areas (critical elevation). |
|
|
(a) Property contains critical environmental area (b) Property is within Ľ mile of critical environmental area
|
7 Points 4 Points |
2. Proximity to special natural habitat |
|
|
(a) Property contains or is contiguous to endangered or threatened species habitat or is part of a designated wildlife refuge or corridor (b) Within Ľ mile of such areas
|
6 Points
3 Points |
|
3. Amount of property with high ground water recharge potential. |
|
(0.06 points per 1% of property with high ground water recharge potential up to 100%). |
Up to 6 Points |
4. Provides buffer between distinct communities. |
|
|
6 Points |
|
5. Property affords an opportunity to link open space or recreation resources. |
|
|
7 Points |
|
6. Property is associated with an important historic place, event, person, or activity |
|
|
(a) National, state, county or local significance (b) Property is adjacent to such areas
|
7 Points 4 Points |
7. Property contains an archaeological site |
|
|
(a) Designated archaeological site (b) Archaeological site eligible for designation
|
6 Points 3 Points |
8. Property is an established or familiar visual feature that is part of an historic landscape. |
|
|
(a) Symbol of the County’s identity or reflects the County’s settlement or development patterns (b) Symbol of the community or local area.
|
6 Points
3 Points |
9. Proximity to designated scenic byway, river, and/or ridgeline (as defined in the General Plan) |
|
|
(a) Includes frontage along designated scenic byway, and/or portion of a scenic ridgeline or river. (b) Is located within Ľ mile or adjacent to the buffer of a designated scenic byway, ridgeline, or river.
|
7 Points
4 Points
|
10. Property contains distinct scenic resource such as mature forest, stands of trees, open fields, waterways, hedgerows, stone fences, etc. |
|
|
|
6 Points |
11. Purchase price is leveraged using other funding sources including but not limited to state, federal, foundation funding, or private donations |
|
(0.12 points for each one percent of purchase price leveraged, up to 50%)
|
Up to 6 Points |
12. Purchase price is below market value |
|
(0.12 points for each one percent below market value up to 50%)
|
Up to 6 Points |
13. Located within an Urban Growth Area (UGA) |
|
|
|
18 Points |
14. Proximity to UGA, town, or traditional village boundary |
|
|
(a) Contiguous with UGA, town, or traditional village boundary (b) Within Ľ mile of UGA, town, or traditional village boundary |
6 Points 4 Points |
Source: Loudoun County, Virginia, Proposed Purchase of Development Rights Program, Jan 2000, The PDR Design Subcommittee of the Open Space Advisory Committee.
/* setup
GRID
setcell 10
setwindow GRID_county
setmask GRID_county
/*convert to GRID
g_parks = polyGRID(park)
g_open = polyGRID(openspace-out)
/* merge the GRIDs
g_eased = merge(g_open, g_parks)
/* calculate euclidean distance values
g_park_dist = eucdistance(g_eased, # , #, 2000, #)
/* reclassify the values
g_park_d_cl = reclass(g_park_dist, /proj/pdr/tables/park_distance.lut, DATA)
where the park_distance.lut =
/* this table establishes the classes for part of the contiguity w/eased stuff
/* class 1 = it is a property with an openspace easement or parkland, 0 – 9 ft.
/* class 2 = it is contiguous with an openspace easement or parkland, 10 - 50ft
/* class 3 = within 1/4 mile of an openspace easement or parkland, 50 – 1320 ft
/* class 4 = over 1/4 mile away, 1320 – 999999999 ft
0 9 : 1
10 50 : 2
50 1320 : 3
1320 999999999 : 4
/* reclassify based on weights
g_park_d_wt = reclass(g_park_d_cl, /proj/pdr/tables/park_distance.val, DATA)
where the park_distance.val =
/* this table establishes the weights for the classes determined in the park_distace.lut
/* class 1 = an openspace easement or park
/* class 2 = contiguous with and openspace easement or park
/* class 3 = within 1/4 of an openspace easement or park
/* class 4 = over 1/4 mile away from and openspace easement or park
/* class: weight
1 : 0
2 : 19
3 : 10
4 : 0
The PDR Design Subcommittee of the Open Space Advisory Committee (January 2000), Loudoun County, Virginia, Proposed Purchase of Development Rights Program.