Abstract:
In 1997, Delaware County entered into a partnership with the Bureau of Census by participating in the Local Update of Census Addresses (LUCA) Program. After reviewing the Bureau’s Master Address File (MAF) in 1998, 1999, and 2000, the county’s GIS office submitted over 11,000 (almost 39% of the total) missing addresses to the Census Bureau. A comprehensive database including the road centerline populated with address ranges, an Address Point coverage (GPS’d points), several external address files, and a conflated copy of the 1990 TIGER Block coverage were utilized in this project. This paper will explain the process that resulted in identifying the missing addresses; geo-coding various address files; and the use of Avenue and a C++ program written for conflating the 1990 Block and the 2000 Collection Block coverage. The county is currently is using the conflated coverage not only for Census 2000 related projects, but also for a variety of other applications such as creation of Voting Precinct coverage and conducting demographic analysis at the parcel level.
Delaware County is located in central Ohio and is the fastest growing county in the state. The county has experienced an estimated 64 percent growth rate over the past decade. This can be attributed to the close proximity to the Columbus Metropolitan area in the south, and the plethora of natural and agricultural areas dispersed throughout the county.
In 1994, the Delaware County Auditor established the Delaware Appraisal Land Information System (DALIS) Project to primarily deal with this growth and to create a comprehensive GIS database to achieve a more equitable appraisal system. The system however, due to its robust structure has played a crucial role in a variety of applications including all of the Census 2000 related programs and especially in LUCA and LUCA related programs.
In December 1990, as part of the post-census appeal process, the preliminary housing unit counts were published and sent to all jurisdictions throughout the United States. Each entity was given 2 weeks to respond and, if necessary, challenge these figures by providing detailed data to the Census Bureau. In Delaware County, although the local officials found the figures extremely low, they didn’t have the necessary tools such as a comprehensive GIS, an adequate staff, or enough time to submit any detailed documents. As a result, Delaware County remained one of the undercounted entities in the nation.
The local elected officials and specifically the County Auditor were fully aware of the significance of an accurate count for the county. They knew that an accurate count would mean more federal and state funds and grants and a more precise reapportionment and representation. The latter was especially vital since the county was at a border line (close to 100,000 population) to send its own representative to the Ohio House of Representatives, which is currently shared with two other counties.
Therefore, in 1997, when the Census Bureau announced LUCA as the primary solution to overcome the undercount, Delaware County did not hesitate to participate in every stage of that program. Since then, the DALIS staff has spearheaded the effort in the hopes of achieving a more accurate address file and, as a result, a more accurate count for the Census 2000. Later that year, the Census Bureau also announced that unlike the 1990 census, the post census appeal process will be eliminated and entities that do not participate in LUCA will lose the opportunity to challenge the housing counts. This announcement further solidified the county’s commitment to continue acting as an active participant.
The primary purpose of the LUCA program(s) was to provide an opportunity to local governments to review the Census Bureau’s MAF. The MAF was a combination of the Census Bureau’s 1990 Address Control File (ACF) and the US Postal Delivery Sequence File (DSF). Two distinct LUCA Programs existed, LUCA 98 and LUCA 99. LUCA 98 participants included local governments with city-style addresses (i.e. 123 Main St.). These entities received an address file (MAF) from the Bureau and were asked to revise that file and return it to the Bureau. LUCA 99 participants included entities with non-city-style addresses (i.e. P. O. Boxes or rural addresses) and unlike LUCA 98 participants, they were asked to submit total housing units in each 2000 Collection Block (submission of individual addresses were not required as part of this program).
Delaware County participated in both the LUCA 98 and the LUCA 99 since the county includes a mix of city-style and non-city style addresses. In preparation for both of these programs, the DALIS staff not only utilized its existing database, but also acquired and created additional coverages, which enabled them to effectively respond to every stage of the program and do it in a timely manner. Before explaining the details of each program and the final results, the relevant components of the DALIS database will be described:
DALIS Project’s database consists of several coverages. The following is a list of some of those coverages utilized in the LUCA and LUCA related programs:
- Countywide Digital Orthophotos. The photos were taken in 1997 and are in MrSID format, in two, one, and half foot resolution (in scales of 1”:100’, 1”:200’, & 1”:400’)
- Political boundaries (municipalities and townships)
- Subdivision boundaries and major hydrology
- Parcels and Road Right of Ways
Political boundaries, subdivisions, major hydrology, parcels, and road right of ways were originally digitized (between 91 and 93) from hard copy mylars. These coverages, after an exhaustive deed research on every parcel of land in the county, were manuscripted (hand-drawn) on mylars with conventional orthophotos (captured in 1991 at various scales of 1”:100’ and 1”:200’ and 1:”400’) as a backdrop.
- Road Centerline
The county was re-flown in 1997 and the road centerline coverage was complied from those digital orthophotos. However, originally the centerline coverage only included road names, road types, pre-type, prefix, and suffix attributes. In order to conduct the necessary geo-coding for the LUCA program, address ranges in the road centerline were needed. Therefore, we started examining TIGER’s road centerline coverage and very soon it became apparent that the coverage lacked the new roads and even when the roads existed, in many cases they were not populated with address ranges. Lacking new roads and/or missing address ranges was obviously a major problem since Delaware County is and was the fastest growing county in the state of Ohio. That’s when a decision to populate DALIS’s newly compiled road centerline with several additional attributes including, a unique identification number for each segment, address ranges from and to, on the left and right side of each segment was made.
Later in 1997, the DALIS staff started the very tedious task of populating each road segment with the above attributes. An additional task included flipping the direction of road segments (arcs) to match the ascending address ranges. The Appraisal database (parcels coverage) became the main source for populating the address range attributes for single-family dwellings. It took the staff approximately 650 hours to accomplish the above tasks. The Figure 1 demonstrates the structure of the Arc Attribute Table (AAT) for the road centerline.
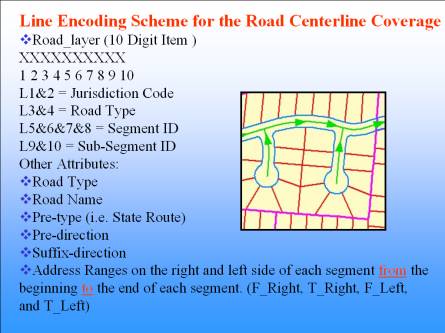
Figure 1: The structure of the Arc Attribute Table (AAT) for the road centerline coverage.
- An Address Point coverage (GPS’d points) and digital images
Towards the end of 1998, it became apparent that addresses of multi-family units, mobile homes and apartments were not obtainable from the parcel coverage and nor was it easily available from any other data sources. At that time, the county decided to enter into a contract with a company to drive the entire county and create a point coverage including a variety of attributes such as the address of each structure (parsed out into individual fields) and also capture pictures of the front façade of each structure. The project provided the DALIS Staff with a point coverage that included addresses for all structures in the county which played an immense role in the Quality Control (QC) of the Census Bureau’s Master Address File. The coverage also included the x and y coordinate of the location of each structure which was captured by a GPS receiver on the board of the Van. Figure 2 is a snap shot of the contents of the Point Attribute Table (PAT), an Orthophoto overlaid with the point coverage, and a digital picture of one of the structures .
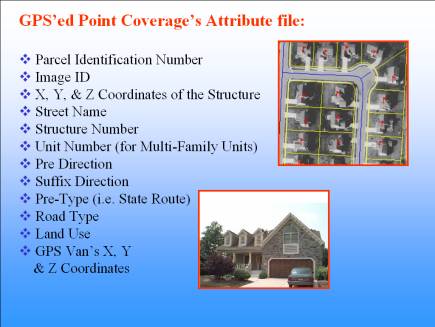
Figure 2: Contents of the Point Coverage’s Attribute File.
A variety of address files including the Census Bureau’s MAF, the county voter registration, the electric company, and various municipality’s building permits were all geo-coded in an attempt to further cleanse the MAF and provide the Bureau with more accurate data.
- Census Blocks, Tracts, Block Groups, Roads, and 2000 Collection Blocks
These coverages were converted to Arc/Info and utilized at various stages of this project. One of the Bureau’s requirements for submitting additional addresses to MAF was including the 2000 Collection Block for each of the new addresses. Due to a significant difference between the TIGER and DALIS Projects geography, we decided to conflate the Census 1990 Block coverage to the DALIS base. The 2000 Collection Block coverage was then created from this conflated Block coverage. Figure 3. demonstrates the before and after effect of the conflation process. A total of 100 hours was spent generating the final 2000 Collection Block coverage.

Figure 3: The 2000 Collection Block boundaries before (in Red) and after (in Blue) Conflation.
After investigating the available options for Conflation, Alan Saalfeld, an Assistant Professor at The Ohio State University’s Department of Geodetic Science was contacted He had worked for many years on various conflation related programs with the Census Bureau and he suggested that we work with one of his PhD students to accomplish this task. The County then entered into a contract with Hoseok Kang who wrote a program in C++ as well as several Avenue scripts (to mainly perform data QC and editing) in 1999. The following is an explanation of how the program was designed and worked.
As spatial data resources become more abundant, it becomes more important to be able to effectively relate these data sources with other valuable attribute information files such as census attribute data. However, in order to accomplish this task, the geography of the census tracts, block groups, or blocks must closely match the local, more accurate sources which are typically from digital photography and/or road centerline coverages. Map conflation can be defined as combining two or more map data sets from different sources to form a new spatial data set with a unique representation and consistency. Automated map conflation has been implemented since Alan Saalfeld suggested automated map conflation in his dissertation (Saalfeld, 1993). Different versions of map conflation can be listed as follows:
1) When combining the same type layers of the same region (conflict).
2) When combining the different type layers of the same region (overlay).
3) When combining the same type layers of neighboring regions (edge matching).
Delaware County’s primary interest in conflating the census block boundaries to its GIS base was to create the 2000 Collection Block coverage (from the 1990 Block coverage). The 2000 Collection Block coverage was then utilized for populating every additional address with the appropriate Block 2000 code (a requirement). The second advantage of the 1990 Block coverage conflation was that it enabled us to link the block level demographic data to the parcel level data.
There were multiple reasons for the extensive difference between the geography of the Census block boundaries and Delaware County’s GIS base. The first reason had to do with the scale that each coverage was originally created at. While Census block boundaries were created from 1”:100,000” scale paper maps, the digital orthophotos were captured at three scales of 1”: 1,200”,2,400”, and 4,800” as was the road centerline and other county coverages used in the conflation process. The second reason related to generalization. Since the real world is too complex for our immediate and direct understanding and there is a limited space on a paper map, generalization must be applied when a paper map is created. The generalization process (McMaster, 1992) consists of ten spatial transformations (simplification, merging, etc.). It is an ill posed problem to recover the original feature from the generalized one without extra information. This can be described as a conflict between analog and digital based data. These two factors make map conflation complex and not easily defined. Since map conflation is an ill posed problem, it is extremely difficult to find fully automated solutions. Delaware county census block conflation stages are based on Alan Saalfeld's method without iteration and implemented using C++ and Avenue programming languages.
Another important goal of Delaware county map conflation project was to match the census block boundaries to a more accurate geography and at the same time preserving each block’s attribute data. The main reference frames used were digital orthophotos and the road centerline coverage. The hydrology coverage was used for visual check only since this coverage was compiled from USGS maps and at a different scale (1”:24,000”). Map conflation processes are so complex that it is necessary to provide visualization tools to make them understandable and to make errors detectable. Even though ArcView (out-of-the-box) does not contain geometry and topology tools that can be used in map conflation processes, the combination of Avenue and built-in functions of object-oriented languages enabled us to accomplish the map conflation processes and at the same time to take advantage of ArcView's visualization capabilities. The data sources used for Delaware County census block conflation are as follows.
Source Map:
- 1990 Tiger Block coverage (in ArcView shape file format)
Reference Frames:
- DALIS Project’s Digital Orthophotos, Road Center Line, Townships, Municipalities, and Subdivision coverages.
- USGS’s Railroad and Hydrographic (Polygon and Arc) Coverages
One main concept of map conflation is that if we know some points and their destination location, other related points can be transformed based on piecewise-linear rubber-sheeting transformations using simplicial coordinates. The map conflation operations of matching and alignment can be alternately applied until no further matches are identifiable. The first system of map conflation was developed by the Bureau of Census to update USGS line-work files (no attributes) using their own digital cartographic files (which included attribute information such as name, street type, etc.). The goals were to (1) identify and resolve differences, and to (2) transfer names, address ranges, and other feature attribute information to the USGS files (Saalfeld, 1993). In this prototype map conflation system, conflict type map conflation was accomplished. In the case of overlay type map conflation, the same approach may not be applied because reference data may not exist in some areas, which are needed for finding matching points. The proposed map conflation for Delaware County census block uses a semi-automatic quality control process to ensure that all areas are covered by matching points.
Control points are defined as well distinguished points such as intersection and turning points so that we can automatically and easily define them in the digital map. Finding matching points in the reference map is one of the difficulties in automated map conflation. A matching strategy may be based on proximity between two points and the geometry and topology of neighbors. There is no sense selecting control points where reference data do not exist. If we try to pick control points that are not connected to reference data, then we have no way to define the relationship between reference data and control points (no matching points). Surveying control points by fieldwork is expensive and time-consuming. However, digital orthophotos offer some advantages over independent source control points because they provide high relative geometric accuracy, inexpensive feature problem resolution, and fast processing. If there was no reference data available, manual and visual match on digital orthophotos would have been implemented. Initial matching generated about 5500 point pairs using the C++ program’s built-in-function. Among those points, 4500 pairs were accepted after the quality control. Most unaccepted point pairs were from hydrographic areas. The quality control process consists of a control point table, a candidate check dialog, and a visualization window, all built in Avenue scripts. The quality control process is strongly dependent upon visualization and human interaction. In urban areas, it is relatively easy to recognize correct matches, unlike hydrographic areas where making a decision can be difficult. In order to speed up the quality control process, an Avenue script was written to provide point-and-click workspace without the need for traversing several menus in ArcView (Figure 4). On average, it took an hour to quality control 200 points in this workspace.
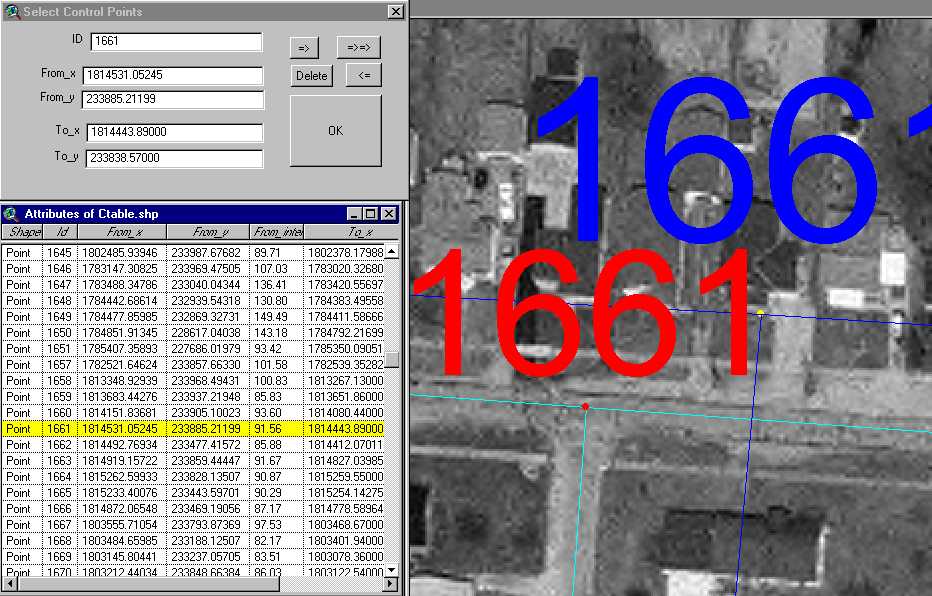
Figure 4. The Interface for Quality Control of Matching Points
A traditional piecewise rubber sheeting (another C++ built-in-function) was used to transform points inside triangles as well as vertices of triangles. The recursive piecewise rubber sheeting (Saalfeld, 1993) also guarantees feature matching of as many points as there are control points, as long as polylines between control points are straight, and there are no error points in the matched set. It is impossible to satisfy all these conditions in overlay type map conflation. Census block boundaries typically follow physical lines such as road centerlines, hydrographic features, and township and municipal boundaries. Visual checking is adopted to minimize matching errors and matching points are picked manually for hydrographic features. It is challenging to apply map conflation in the hydrographic area where the natural shape is irregular, there are many control points whose matching points are difficult to find, and the map generalization process has been applied excessively. In this area, extensive manual editing is needed even though polyline matching stage may provide good alignment for unmatched features after rubber sheeting. Polyline matching (another C++ built-in-function) was applied to rematch polyline edges whose end nodes were vertexes of triangles. Figure 5. shows various stages used in Delaware county map conflation.
The proposed map conflation system offers an automatic approach. However, some human interaction (manual editing) was needed at the final stage. This approach reduced types of editing such as line stretching, line translation, and line rotation to only line stretching. Heads-up editing was conducted with digital orthophotos in the background using ArcView’s editing tool. We needed less intensive editing in the city area because the census block boundary is a grid pattern in this area and follows road centerlines, so a conflict solution could be applied. The essential prerequisites for conflict are well preserved in this area. Figure 6. shows the city area before (left image) and after (right image) conflation. The result of map conflation in the city area shows many of the benefits of our map conflation system. In the case of hydrographic areas (Figure 7.), extensive on-screen editing was needed to fit irregular hydrographic lines after conflation. More research is needed to find fully automatic tools for overlay type map conflation, to find matching points when no reference vector data exists, to employ multiple matching strategies, and to accomplish feature based re-matching.
In summary, this section included the issues of inverse scale and generalization factors (which complicates the map conflation process) as well as the processes used in automating the Delaware County’s map conflation system. The methodology consisting of automatically detecting control points, applying quality control, triangulation, piecewise-linear rubber sheeting, polyline matching, and final quality control were also discussed. This system provides many benefits for conflating countywide coverages by minimizing human interaction in the entire process. Even though this system provided reliable results, more research will be needed to find fully automated solutions for finding matching points when reference vector data may fail to exist. A more automated solution will also enhance the process of employing multiple matching strategies, as well as accomplishing feature based re-matching.
After discussing the data sources used in LUCA programs, various stages of each program will be discussed next.
As mentioned before, the county announced its participation in the LUCA 98 program (designed for areas with city-style addresses) in 1997. In October of 1998, Delaware County’s MAF (including 28,939 addresses) was delivered to DALIS office and the county was given three month to research the addresses and submit a revised MAF.
The road centerline coverage was completely populated with the address ranges and we were prepared to geo-code the MAF. Several other address files such as the voter registration and the electric company were already geo-coded by that time. Extensive standardization (to comply with the Bureau’s naming conventions) processes had occurred to achieve a high match rate for those external files. Additionally, All of the attributes in the road centerline were also entered following the Bureau’s naming conventions and standards, therefore, an 89 percent and 85 percent match rates were achieved on the voter registration and the electric company address files respectively. The remaining unmatched and partially matched addresses were checked and corrected which increased the match rate by 3 and 4 percent respectively.
The first geo-coding attempt on MAF resulted in an 88 percent match rate. However, after examining the unmatched records and making changes to mostly missed address ranges and/or differences in road names, the match rate was increased to 94%. By that time we were ready to conduct multiple spatial subtractions of the point coverages generated from the multiple geo-coding processes. A combination of subtracted point coverages then provided us with missing addresses in the MAF. Figure 8. demonstrates the differences between two geo-coded coverages (MAF and voter registration).
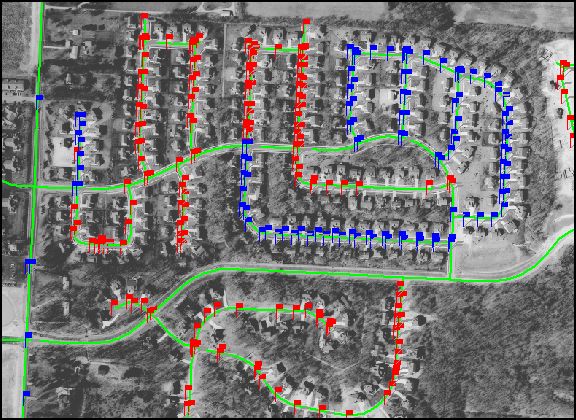
Figure 8: Geo-coded MAF (blue flags) vs. the Geo-coded Voter Registration (red flags) in a subdivision.
This process took 3 months and resulted in 11,161 new addresses (39% of the total), 235 modifications, and 73 deletions that needed to be submitted to the Bureau. One of the main reasons that we met the deadline was using the conflated 2000 Collection Block coverage. Since the 2000 Collection Block’s geography and the DALIS database matched, every additional address’s collection block was easily determined through a spatial join between the subtracted point coverage(s) and the conflated 2000 Collection Block polygon coverage.
Another LUCA 98 requirement was updating of Census Bureau’s hard-copy maps. The Bureau uses these maps to update the TIGER road coverage (by digitizing the hard-copy maps). After comparing DALIS’s road coverage, which is updated on a daily basis, and the Bureau’s hard-copy maps, 206 additions (of new or missing roads), 174 corrections, and 57 deletions were made to those maps. It took an approximate 110 hours of staff time to accomplish this task. It would have saved us a great deal of resources if we did not have to manually revise the maps and were able submit digital road coverage instead. However, at this time, even if we submit our digital road coverage to the Bureau (which they do accept them), the Bureau has to spend a considerable time to conflate our road centerline to the TIGER’s geography. That’s one reason for requiring that manual revisions be made to the hard-copy maps.
Some parts of Delaware County include Non-City Style (NCS) addresses. The NCS addresses include areas in which house number-street name addresses are typically not used for mail delivery. That included PO Boxes as well as rural addresses. The package for LUCA 99 was sent to the county in April 1999 and we were given 6 weeks to respond. The package included an index map which identified the NCS areas in a different color. It also included a digital spreadsheet including each 2000 Collection Block in the NCS areas along with a total of 2,912 housing units. Another set of maps was submitted that showed the approximate location of each housing unit in every NCS block. The County was NOT asked to submit individual missing addresses or correction and deletions. The response was to only include a spreadsheet including the 2000 Collection Blocks and their corresponding and revised housing unit counts. After 6 weeks, 499 new addresses were added to the total count (in various 2000 Collection Blocks), which was 17 percent of the original total submitted by the Bureau.
Delaware County also participated in 3 other LUCA/Census 2000 related projects. Those were: Boundary Annexation Survey (BAS), Special Places, and the New Construction.
The Census Bureau conducts the Boundary Annexation Survey to update the information about the legal boundaries, names of counties, government status, and types of municipalities within each county in the United States. The County has been providing the BAS information to the Census Bureau for many years. As part of BAS, all address ranges of roads in and out of the newly annexed areas must also be recorded on the maps and all ordinance names and dates must be annotated on the BAS maps. The DALIS staff submitted this project in 1998, 1999 and 2000.
The Census Bureau’s definition of a Special Place is a residential living arrangement other than the usual house, apartment, or mobile home which contains one or more buildings where unrelated people usually live or stay in group or shared living arrangements. Those may include: nursing homes, college dorms, prisons, correctional facilities, camps, tourist homes, and etc. In November 1999, the Bureau sent us a list of Delaware County’s Special Places and we were given 4 weeks to review and provide feed back to the Bureau. As a result of that project, we added the names and addresses of 8 Special Places to the existing 25 and made corrections to 5 and deleted 2 addresses.
The final project for the Census 2000 was New Construction. The New Construction Program offered local and tribal governments a final opportunity to review the Census 2000 address list and to add new housing units addresses (occupied between January 99 and April 2000) missing from the list that qualified the program criteria. Another requirement included updating the roads on a new set of Census maps. The DALIS staff, prior to receiving the material for the New Construction, had begun the process of gathering information and address lists from county and municipalities’ building departments. This process proved to be one of the most time consuming projects, mainly due to the lack of a central place to obtain this required information and the lack of digital data in a usable format.
As a result of this project, another 2,496 addresses were added to the MAF and the updates to the maps resulted in addition of another 106 new roads, extensions of 19 roads and corrections to 13 existing road segments.
Upon the receipt of our files and maps, the Census Bureau recruited several individuals to canvas neighborhoods that we had added addresses to. We were also aware that upon the receipt of the Bureau’s feedback, we would only have 30 days to appeal to the U.S. Department of Commerce’s Office of Management and Budget (OMB). Otherwise we could lose our chance to appeal. The OMB was then to notify us of the status of the appealed addresses. The material to accompany each appealed address was very specific and OMB required either an occupancy permit, a utility bill, an aerial photo, a digital picture of the front façade, or a combination thereof. At that point, we had already contacted all of the building departments in the county as well as all municipalities regarding our time constraints and had requested that the required documents be sent to our office immediately.
The response to LUCA 98 arrived in January 2000 and revealed that the Bureau had accepted 87% of the addresses. That was great news and very close to our estimated acceptance rate. However, the DALIS staff initiated another research to investigate the rejected addresses and after another 3 weeks of investigation was able to appeal 331 of those addresses. Each appealed case included one or more of the above documents and 3 weeks after submitting all the documents we were notified that OMB had accepted all 331 appeal cases. That brought the county’s acceptance rate up to 90%.
The Bureau delivered the response to the LUCA 99 earlier than the response to LUCA 98 (in November 1999). The response revealed that the Bureau had accepted all of the 499 additions and therefore, there was no reason to appeal to OMB.
Even though the County succeeded in enhancing the MAF and (hopefully) in taking the County out of the list of undercounted jurisdictions, making changes to many of the processes and/or databases could have further expedited the process and therefore saved us many hours and resources. The following is a list of a few recommendations to enhance the process for Census 2010:
1) Correct/Adjust TIGER’s geography. Delaware County was capable of creating a very detailed and comprehensive GIS to utilize for these programs. However, the majority of jurisdictions have to work with more limited data sources such as TIGER roads coverage. TIGER’s road coverage, especially in areas with high growth, lacks new roads and/or address ranges. Additionally, TIGER’s geography (even the commercialized versions) is still significantly different from more accurate local data which subjects any kind of spatial analysis to error. Luckily, there are several efforts in progress to correct the geography of TIGER. Those vary from using Digital Ortho photography (nationwide) as the base map, to utilizing GPS technology for creating address files including GPS coordinates (O’Grady, 1999). With timely implementation of these projects the accuracy of MAF will definitely increase for the Census 2010.
Another by-product of adjusting the geography is creating maps with spatially accurate roads. Several sets of maps were delivered to us as part of each LUCA program. These maps were not very useful, due to missing roads and geography mismatches. However, since updating them was one of the LUCA requirements, we had to spend many hours transferring our digital roads to the hard copy maps to be re-digitized into the TIGER’s base. A digital copy of TIGER after adjusting the geography and including all roads and their address ranges will play a very important role in the accuracy of the next Census and at the same time will save a lot of resources at the local government level.
2) Census Bureau to designate a central location for collection of building permit data at the state-wide level. One of the most time consuming and frustrating projects was the New Construction. Neither the appraisal nor the voter registration databases were updated enough to be used for this project and since DALIS Project was responsible for all 29 jurisdictions in the county, our biggest challenge became acquiring building permit data from each one of those entities. The building permit information (in paper or digital format) was then compiled in a database and submitted to the Bureau. A central location to collect building permit information for the entire county would have saved us a lot of time and agony. The State Data Centers with cooperation from the Census Bureau (providing staff and/or other resources) may be the best candidate to compile this information for all of the counties in each state. That will save all jurisdictions a great deal of time and resources.
3) Re-examination of areas designated as Non-City-Style. Several areas that were designated as areas including non-city-style addresses proved to contain city-style addresses. This especially became problematic since we had city-style addresses for the housing units in some of those areas. LUCA 99 did not require individual addresses and therefore, we were not able to submit those. This issue definitely decreased the accuracy of MAF. The Census Bureau’s Regional offices must take a closer look at these areas and seek the local government office’s expertise and knowledge in this regard.
4) Census Bureau to encourage and assist the local governments in address standardization process. Even though several address files including the voter registration, utilities, and a few municipalities were geo-coded successfully, a great deal of effort was put into standardizing (to comply with MAF) of each one of these files as well as our road centerline to achieve a higher match rate. The Census Bureau should assist the local governments by conducting workshops on the importance of address standardization and in providing the Bureau’s standards to the local governments.
During the past three years of Delaware County’s involvement with LUCA and LUCA related programs, the County has faced many challenges. In spite of these challenges, the County submitted over eleven thousand additional addresses (almost 39% of the original MAF) to the Census Bureau. This incredible outcome would not have been possible without our dedicated staff and access to a very comprehensive GIS database.
DALIS Project staff invested a considerable amount of resources in creating, standardizing, and checking the integrity of a detailed road centerline (including address ranges), a GPS’ed point coverage (including addresses of all structures in the county), a very high-resolution digital Orthophoto set, and in conflation of the Census 2000 Collection Block coverage. Each of these data sources played a crucial role in this process and especially in the timely submission of all of the required material. Delaware County participated in every stage of the LUCA program and after spending hundreds of hours on various parts of the program, succeeded in submitting all of the required data.
The County’s objective was to achieve a 100% population count and we are hoping that as a result of this project and enhancement of MAF, all Delaware County residents were reached and counted.
Hudson, Rick, 1999, Getting lost in Addressing Problems, Proceedings, Esri Users Conference ‘99.
McMaster, Robert B., 1992, Generalization in Digital Cartography, Association of American Geographers.
Mills, Jack, 1999, Tain’t Necessarily So: Address Geocoding in the Real World, Proceedings, Esri Users Conference ‘99.
O’Grady Kristen, 1999, A DOQ Test Project: Collecting Data to Improve TIGER, Proceedings, Esri Users Conference ‘99.
Saalfeld, Alan, 1993, Conflation: Automated Map Compilation, Center for Automation Research, CAR-TR-670, (CS-TR-3066), University of Maryland, College Park.
Shoreh Elhami, GIS Director
Delaware County Auditor/DALIS Project
94 n. Sandusky Street
Delaware, Ohio 43015
Phone: 740-833-2070
Fax: 740-833-2069
Email: selhami@co.delaware.oh.us
Hoseok Kang, Ph. D. Student
Civil and Environmental Engineering and Geodetic Science
The Ohio State University
470 Hitchcock Hall, 2070 Neil Avenue
Columbus, Ohio 43210-1275
E-mail: kang.77@osu.edu