ArcView GIS Extension for Estimating Curve Numbers
Mary C. Halley P.E. , Suzanne O. White, and Edwin W. Watkins P.E.
Abstract
The curve number is a hydrologic parameter used to describe the storm water runoff potential for drainage area. The curve number is a function of land use, soil type, and soil moisture. Curve number estimation involves area-weighting land use and soil types, which can be time-consuming and labor intensive. An ArcView extension was developed to automate this process. The user provides digital drainage areas, land use and soil maps, and "look-up tables" to facilitate computations. The extension prompts the user for file names and field names. The input data is then checked for format and completeness and notifies the user of any errors prior to calculation. Lastly, the extension calculates curve numbers, as well as impervious area coverage.
Introduction
The curve number is an index developed by the Soil Conservation Service (SCS), now called the Natural Resource Conservation Service (NRCS), to represent the potential for storm water runoff within a drainage area. In calculating the quantity of runoff from a drainage basin, the curve number is used determine the amount of precipitation excess that results from a rainfall event over the basin. This methodology is a standard hydrologic analysis technique that has been applied in a variety of different settings throughout the United States, and the development and application of the curve number is well documented (SCS, 1986). Because it is a function of the soil and land use of a drainage basin, estimation of a curve number requires mapping of the soil and land use within the drainage basin boundaries, and specification of unique soil types and unique land use categories. The manual calculation of curve numbers for large areas or many drainage basins can be cumbersome and time-consuming, therefore a Geographic Information System (GIS) is an appropriate tool to use for such an application.
Curve Number Estimation
The curve number is estimated for a drainage basin using a combination of land use, soil, and antecedent soil moisture condition (AMC). Soil data is usually obtained from the local NRCS or is contained in the hardcopy soil survey for the area. Typically, soil surveys list soil types (e.g., Fullerton cherty silt loam, Dewey silt loam) by name, which is based on certain physical characteristics of the soils. However, the information needed to determine a curve number is the hydrologic soil group, which indicates amount of infiltration the soil will allow. Significant infiltration occurs in sandy soils while no infiltration occurs on heavy clay or rock formations. There are four hydrologic soil groups: A, B, C and D. The definition of each is given in Table 1. Most published soil surveys present a listing of the soil types and corresponding hydrologic soil groups. The original soil type map must be converted to a map of hydrologic soil groups using the published conversions.
Table 1. Definition of Hydrologic Soil Groups
|
Hydrologic Soil Group |
Soil Group Characteristics |
|
A |
Soils having high infiltration rates, even when thoroughly wetted and consisting chiefly of deep, well to excessively-drained sands or gravels. These soils have a high rate of water transmission. |
|
B |
Soils having moderate infiltration rates when thoroughly wetted and consisting chiefly of moderately deep to deep, moderately fine to moderately coarse textures. These soils have a moderate rate of water transmission. |
|
C |
Soils having slow infiltration rates when thoroughly wetted and consisting chiefly of soils with a layer that impedes downward movement of water, or soils with moderately fine to fine texture. These soils have a slow rate of water transmission. |
|
D |
Soils having very slow infiltration rates when thoroughly wetted and consisting chiefly of clay soils with a high swelling potential, soils with a permanent high water table, soils with a claypan or clay layer at or near the surface, and shallow soils over nearly impervious material. These soils have a very slow rate of water transmission. |
The land use distribution map for the area of interest is derived from planimetric, zoning, and parcel boundary maps, and aerial photography. Land use categories are defined based on the level of detail required for the study. Standard SCS curve numbers are assigned for each possible land use-soil group combination. Table 2 presents an example of typical land use categories used for hydrologic analysis, along with corresponding curve numbers for each land use-soil group combination. The land use categories shown in Table 2 were derived from the standard categories typically used for hydrologic analysis using the SCS methodology (SCS, 1986).
Table 2. Land Use Categories and Associated Curve Numbers
|
Description |
Average % Impervious |
Curve Number by Hydrologic Soil Group |
Typical Land Uses |
|||
|
A |
B |
C |
D |
|||
|
Residential (High Density) |
65 |
77 |
85 |
90 |
92 |
Multi-family, Apartments, Condos, Trailer Parks |
|
Residential (Med. Density) |
30 |
57 |
72 |
81 |
86 |
Single-Family, Lot Size � to 1 acre |
|
Residential (Low Density) |
15 |
48 |
66 |
78 |
83 |
Single-Family, Lot Size 1 acre and Greater |
|
Commercial |
85 |
89 |
92 |
94 |
95 |
Strip Commercial, Shopping Ctrs, Convenience Stores |
|
Industrial |
72 |
81 |
88 |
91 |
93 |
Light Industrial, Schools, Prisons, Treatment Plants |
|
Disturbed/Transitional |
5 |
76 |
85 |
89 |
91 |
Gravel Parking, Quarries, Land Under Development |
|
Agricultural |
5 |
67 |
77 |
83 |
87 |
Cultivated Land, Row crops, Broadcast Legumes |
|
Open Land � Good |
5 |
39 |
61 |
74 |
80 |
Parks, Golf Courses, Greenways, Grazed Pasture |
|
Meadow |
5 |
30 |
58 |
71 |
78 |
Hay Fields, Tall Grass, Ungrazed Pasture |
|
Woods (Thick Cover) |
5 |
30 |
55 |
70 |
77 |
Forest Litter and Brush adequately cover soil |
|
Woods (Thin Cover) |
5 |
43 |
65 |
76 |
82 |
Light Woods, Woods-Grass combination, Tree Farms |
|
Impervious |
95 |
98 |
98 |
98 |
98 |
Paved Parking, Shopping Malls, Major Roadways |
|
Water |
100 |
100 |
100 |
100 |
100 |
Water Bodies, Lakes, Ponds, Wetlands |
The curve numbers shown in Table 2 correspond to antecedent moisture condition II (AMC II). The AMC is defined as the initial moisture condition of the soil prior to the storm event of interest. SCS methodology expresses this parameter as an index based on seasonal limits for the total 5-day antecedent rainfall (McCuen, 1982), as follows:
Once the data has been gathered, the typical process for estimating the curve number for a drainage area is as follows:
where: CNaw = the area-weighted curve number for the drainage basin;
CNi = the curve number for each land use-soil group polygon;
Ai = the area for each land use-soil group polygon;
n = the number of land use-soil polygons in each drainage basin.
As with many common engineering design jobs, estimating the curve number for one or two drainage basins is usually a simple task that can be done using pencil, paper and a scaled grid or planimeter for area measurements. New developments are typically small (i.e., less than 500 acres) and the land use and soil groups are often fairly homogenous. However, many communities and states are beginning to manage storm water using a watershed approach, and have found it necessary to perform hydrologic analyses for large areas, or to determine the peak discharges or runoff volumes from many smaller drainage basins located inside a watershed. For these applications, the calculation of curve numbers for tens or hundreds of square miles can be laborious and costly. The utilization of a GIS to assist with spatial data development and manipulation is ideal for determining curve numbers for large watersheds or numerous drainage basins.
The ArcView Curve Number Generator
An ArcView extension, henceforth termed the Curve Number Generator, was created to facilitate calculation of curve numbers for large watersheds. Upon startup, the user is asked to define the path and name for all required shapefiles and look-up tables. The Curve Number Generator requires three shapefiles: (1) the watershed or drainage basin boundaries for which curve number(s) will be calculated, (2) the land use map, and (3) the soil type map. The Curve Number Generator also requires two user defined look-up tables: (1) the soil group table that provides the conversion from soil types to hydrologic soil groups, and (2) the Curve Number table that defines the land use-soil group categories and curve numbers, similar to Table 2 shown previously. The look-up tables can be modified by the user as appropriate for each project. For example, the NRCS might provide a soil map with abbreviated soil names instead of the formal soil names. The user can modify the soil group look-up table to accommodate the map if necessary.
The Curve Number Generator does not require the data within the shapefiles or the look-up tables to be in a defined, standard format or order. Instead, it lists the field names for each shapefile and asks the user to select the fields that contain the records needed for curve number calculation. For example, the user is asked to select the field containing the soil types in the soil shapefile, and the drainage basin name field in the drainage basin shapefile. Like the shapefiles, the format and style of the look-up tables can also vary between users and/or projects, therefore the Curve Number Generator requires the user to specify the necessary fields in the look-up tables as well.
Once the appropriate shapefiles, look-up tables and fields have been specified, the Curve Number Generator runs through a list of "error checks". The user is asked to verify the list of drainage basin names in the drainage basin shapefile. Next, the land use and soil type records are compared with the records listed in the look-up tables. Shapefile records that can not be found in the look-up tables are flagged and the user is informed of the discrepancies. The user is given the option of exiting the Curve Number Generator to correct any problems found, or the user can continue with the curve number calculation.
After all data specifications and checks have been performed, the user initiates the curve number calculation. The program generates curve numbers based on drainage basin boundaries. For watersheds that contain multiple drainage basins, the user has the option to calculate curve numbers for one or more individual basins, or for all of the drainage basins contained in the watershed shapefile. If individual calculation is desired, the user is prompted to select the drainage basins where curve numbers are to be calculated.
The program proceeds by clipping the soils and land use shapefiles with the drainage basin boundaries. A typical problem in hydrologic analysis when using a GIS is land use or soil shapefiles that do not cover the entire watershed. This problem is particularly prevalent for soil maps, which are often "cookie cut" by the map developer using a watershed boundary that differs slightly from the one being used for hydrologic analysis. This may leave areas of missing data around the edges of the soil shapefile. The Curve Number Generator checks for such problems by comparing the areas of land use and soil shapefiles with the area of the watershed shapefile, and presents the results to the user. Again, the user has the option of exiting the Curve Number Generator to correct the shapefile, or continuing with the calculation.
The soil types are converted to hydrologic soil groups by joining the soil group look-up table to the clipped soil shapefile. The shapefile is then joined to twice, first to the drainage basin shapefile, second to the land use shapefile. This creates a number of smaller polygons inside the drainage boundaries. The curve number look-up table is joined to this compiled shapefile, and a curve number is assigned to each polygon based on the combination of its soil group and land use records.
At this point, all the data necessary to determine an area-weighted curve number is now available in one shapefile. Each polygon contains a record for the drainage basin name, soil group, land use, and curve number. The Curve Number Generator applies the curve number equation to all polygons that have identical drainage basin names, and an area-weighted curve number is determined for each drainage basin.
% Impervious Area Calculation
A secondary feature of the Curve Number Generator is the calculation of the % impervious area. The % impervious area is another valuable piece of data that can be used to estimate runoff volumes, regulate new development and predict areas that may have future storm water concerns. The % impervious area is solely a function of the land use, and is calculated by area-weighting individual land use polygons located within a drainage basin. It is calculated by the Curve Number Generator by simply assigning a single % impervious area, as shown in Table 2, to each land use category in the curve number look-up table. A % impervious area is calculated for each drainage basin, or only those basins that where selected by the user.
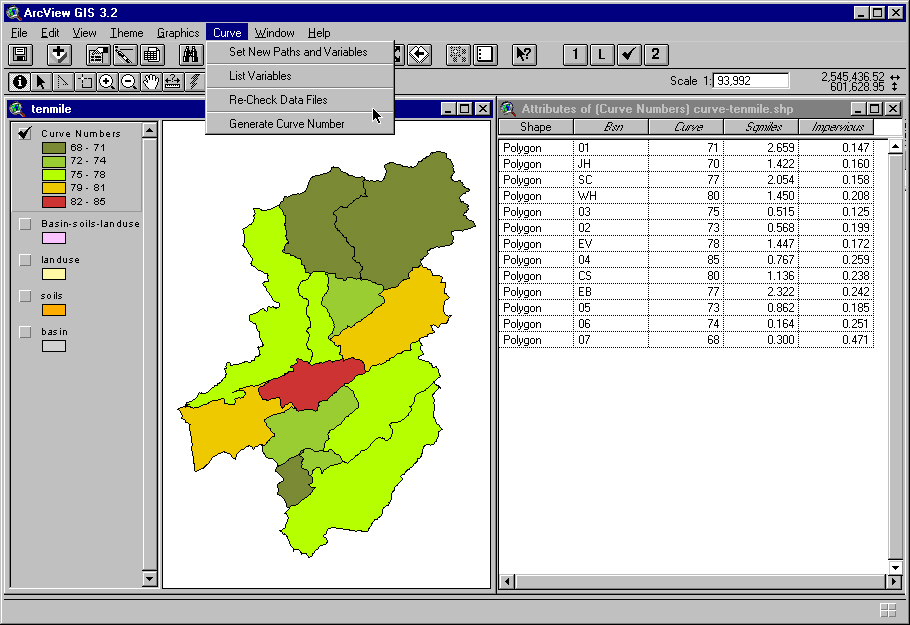
Curve Number Generator Output
Figure 1 presents a screen capture of the final on-screen results of the Curve Number Generator. The output consists of a new shapefile for the drainage basin boundaries. Each drainage basin has a record in the following fields: basin name, area-weighted curve number, the area (in square miles), and the % impervious area. The output is produced for an entire watershed in just a fraction of the time that would be required if the task was performed manually. For example, manual calculations for over 100 drainage basins in a 15 square mile watershed could take an engineer more than a week to perform, depending upon the detail of the drainage basins, land use and soils data. The Curve Number Generator can perform the same task in about 15 minutes.
Conclusion
The Curve Number Generator is an excellent GIS application that provides engineers and planners with an efficient and useful tool for storm water analysis and management. With the increasing popularity of GIS, the spatial data required to estimate curve numbers are easier to develop in-house, or are readily available from outside sources. Typically, GIS data collected from outside sources is cost effective, easy to edit for various planning scenarios, and ArcView allows flexible programming and customization. With user friendly applications that provide spatial analysis of multiple data layers, such as the Curve Number Generator, technical professionals can reap the benefits of GIS without having to be a proficient GIS specialist.
References
McCuen, Richard H., A Guide to Hydrologic Analysis Using SCS Methods Prentice Hall, Inc. Englewood Cliffs, New Jersey, 1982.
Soil Conservation Service, Urban Hydrology for Small Watersheds, Technical Release 55 (TR-55), 1986.
Author Information
Mary C. Halley, P.E.
Water Resources Engineer
Ogden Environmental and Energy Services, Co., Inc.
6626 Central Avenue Pike
Knoxville, TN 37912
(865) 687-7737 phone
(865) 687-6616 fax
Suzanne O. White
GIS Analyst
Ogden Environmental and Energy Services, Co., Inc.
3800 Ezell Road
Nashville , TN 37211
(615) 333-0630 phone
(615) 781-0655 fax
Edwin W. Watkins, P.E.
Senior Water Resources Engineer
Ogden Environmental and Energy Services, Co., Inc.
3800 Ezell Road
Nashville , TN 37211
(615) 333-0630 phone
(615) 781-0655 fax