The NOAA Coastal Services Center and its technical contractor, Technology Planning & Management Corporation, have been developing a conceptual GIS model to evaluate the relative significance of tidal wetlands within the watersheds of the Ashepoo-Combahee-Edisto River Basin (ACE Basin), South Carolina. The basis of this model is the North Carolina Coastal Region Evaluation of Wetland Significance (Sutter et al. 1999). The South Carolina adaptation considers water quality, habitat and hydrological functions of tidal wetlands based on landscape features and site characteristics. The evaluation is performed in ArcView, using Avenue calls to capabilities provided in Spatial Analyst. This adaptation also will migrate the original AML code of NC-CREWS into ArcView.
The National Oceanic and Atmospheric Administration Coastal Services Center provides products and services to help coastal resource managers make informed decisions. One of the programs within the Center identifies key management issues for watersheds and examines how interrelationships among ecology, land use, demographics, and socioeconomic trends affect those issues. Creating computer-based tools to address habitat mapping and assessment is a critical component of the program.
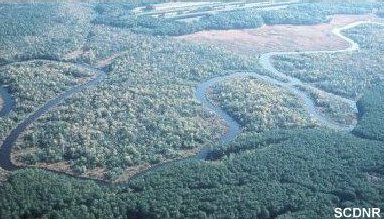
Of interest to many coastal managers are wetlands, specifically, how to protect the integrity of a wetland ecosystem while managing for human use. Borrowing from the constructs of a model developed by the North Carolina Division of Coastal Management—the North Carolina Coastal Region Evaluation of Wetland Significance (NC-CREWS) (Sutter et al. 1999)—the Center has developed a modeling approach to guide managers in decision making using a fundamental understanding of the ecology of these systems on the landscape. This approach, the Spatial Wetland Assessment for Management and Planning (SWAMP), uses basic ecological principles to evaluate the significance of wetlands within a watershed while allowing the decision maker to establish the rules for overall rating. The SWAMP approach was developed within the Ashepoo-Combahee-Edisto (ACE) Basin, South Carolina, for tidal and riverine wetlands, but the approach should be applicable to any geography.
Wetlands occupy a substantial portion of the southeastern coastal plain. Historically, approximately 25 percent of the original wetlands of South Carolina has been drained and converted to other land uses (Hefner et al. 1994). Wetlands are of great ecological importance, in part because they occupy so much of the area and are significant components of virtually all coastal ecosystems, and in part because of their relationships to coastal water quality, estuarine productivity, wildlife habitat, and the overall character of the coastal area. Although agricultural conversion, the largest historical contributor to wetlands loss, has largely stopped, wetlands continue to be lost as they are drained or filled for development. Conflicts between economic development and wetlands protection continue to be a major concern, with many coastal communities considering wetlands protection to be a major barrier to needed economic development. Since wetlands are such a dominant part of the coastal landscape and are vitally important to many aspects of the area's ecology, their management and protection is a major concern.
SWAMP facilitates the basic analyses of these systems while allowing the user the final opportunity to assign the relative importance of each parameter. This approach can be transferred to other geographies, initiated with a workshop that brings together local experts to describe the system ecology and establish parameters and thresholds.
This model was conceived to evaluate the relative significance of a dense concentration of wetlands within a large geographic area. To do so effectively, a method with limited field verification was necessary. This ruled out the many site-specific functional assessment methods that have been applied in other contexts. Almost out of necessity, geographic information system (GIS)–based approaches were investigated and employed, which meant the procedure would have to use data available in GIS format and be subject to GIS analytical techniques. Significant field investigation was required in the original version of the model, but additional field work is not required to run the model.
The procedure also should be watershed-based. This requirement was imposed primarily because consideration of a wetland's role in its watershed is a sound basis for determining its ecological significance. Watershed units of any size could be used without changing the validity of the watershed-based considerations used in the procedure.
The primary objective of the SWAMP procedure is to produce information about the relative ecological importance of wetlands that would be useful for wetland planning and management. It does this by predicting the significant wetland functions that would be determined by a detailed, site-specific method. The resulting information is useful in siting suitable development, determining appropriate development, or considering wetland restoration. The result of the procedure is not a substitute for a site visit in making regulatory decisions, but a predictor of what a site visit would determine.
An underlying requirement of the procedure is that it be ecologically sound and scientifically valid, based on the best information available about the functions of wetlands. It must be based on fundamental principles of wetlands and landscape ecology rather than on arbitrary or subjective decisions.
Unlike other models, SWAMP was designed to have a user interface that allows the user to chose various combinations of the parameters and compare the results. Another unique feature of the model is that it allows the user to alter land uses throughout the watershed, thus allowing simulations to be run for various situations that may occur.
This GIS-based approach can make information on wetland functional significance available for broad regions in advance of specific development plans. The information is then available for planning so that impacts to the most ecologically important wetlands can be avoided. In this sense, this procedure is unique and unlike other functional assessment techniques that are designed to be used in a regulatory context or that require field data for each wetland.
The procedure uses the Spatial Analyst extension of ArcView® and substantial Avenue® programming. The decision interface employs Microsoft® Visual Basic®. Since the assessment procedure was designed for GIS analysis, the choice and expression of individual parameters have been shaped to a large extent by the GIS data available and the capabilities and limitations of ArcView.
Since the procedure uses GIS analyses, it requires digital information in GIS format. GIS data layers used in the procedure include the following:
(1) wetland boundaries and types
(2) land cover
(3) soils data
(4) hydrography
(5) watershed boundaries
The ways in which these data layers are used to determine values for various parameters in the functional assessment procedure can be complex.
The hydrogeomorphic (HGM) classification system for wetlands (Brinson 1993) classifies wetlands into categories based on landscape position (geomorphic setting), water sources, and hydrodynamics (direction of water flow and strength of water movement). It is being increasingly used as the basis for wetland classification and functional assessment systems. HGM classification focuses on the abiotic features of wetlands rather than on the species composition of wetland vegetation on which most of the more traditional wetland classification schemes are based.
Several features of the HGM classification system make it a useful starting point for an assessment of wetland functions. Since the HGM system is based on geomorphic, physical, and chemical properties of wetlands, its result is to aggregate wetlands with similar functions into classes. The HGM class of a wetland, in itself, indicates much about the ecosystem functions of the wetland. The HGM approach also forces consideration of factors external to the wetland site, such as water source. This helps relate the wetland to the larger landscape of which it is a part and puts consideration of the wetland's functions into a landscape and watershed context.
SWAMP consists of several modules, and each module is a distinct HGM class. The HGM class of a wetland, as a broad functional indicator, determines which module of the assessment procedure is used. To date, tidal estuarine and freshwater riverine modules have been developed, with depressional and headwater wetland modules forthcoming.
In addition to HGM classes, wetland types identified by dominant vegetation and landscape position are used at several points in the functional assessment. This reflects a recognition that the biological properties of a wetland considered together with its hydrogeomorphic properties can provide a more detailed indication of wetland function than either property taken alone.
The wetland types used in the ACE Basin example are those typical of the ACE Basin. They result from collapsing the Cowardin (1979) classes used in the National Wetland Inventory into fewer groups. These wetland attributes are used in the wetland data that form the starting point for the functional assessment.
Wetland types are used in SWAMP as indicators of functional characteristics. The correlation between wetland type and wetland functions was determined from best professional judgment. Additional field verification should be implemented to verify these assumptions.
In addition to wetland type and HGM class, several other parameters are used as indicators of the existence or level of specific wetland functions. These include both site-specific parameters, such as wetland size and soil characteristics, and landscape considerations, such as watershed position, water sources, land uses, and landscape patterns. Values for these parameters are determined by GIS analyses based on the data layers previously described.
Unlike assessment procedures that depend solely on information that can be collected within a wetland, this procedure relies heavily on factors external to the wetland site itself. Relationships between a wetland and the landscape within which it exists are integral considerations in determining wetland functional significance. Characteristics of the landscape surrounding a wetland are often more important determinants of its functional significance than are the characteristics of the wetland itself.
While the emphasis on a wetland's landscape context is a more ecologically sound approach to functional assessment than site-specific methods, it requires a great deal more information than could be collected within the wetland itself. The procedure is based on GIS data and analysis not only to make it suitable for regional application, but because GIS provides the most practical way to analyze the spatial relationships of landscape elements and their properties.
SWAMP uses a hierarchical structure in which individual parameters are rated and successively combined until the wetland's functional significance is determined for each primary function. The objective of functional assessment is to determine an individual wetland's ecological significance in its watershed. The functional significance of a wetland is determined by the degree to which it performs, or has the capacity to perform, specific functions.
Parameters are the basis for all evaluations and make up the levels in the hierarchical structure that are actually measured based on fundamental ecological considerations. An evaluation of specific parameters is performed to derive significance ratings for wetland functions. In all cases, parameter values are determined by GIS analyses based on the available data layers. Some parameters, such as wetland type, are surrogates or indicators of other wetland properties that actually determine the wetland's functional capacity. The use of indicator parameters is necessitated by the limitations of GIS data and techniques. Parameter values, in turn, are combined to produce ratings for the various functions.
The broadest grouping of wetland function (primary functions) includes water quality, hydrology, and habitat. The highest hierarchical level, or end result of applying the procedure, then, is the wetland's contribution to its watershed's water quality, hydrology, and habitat function. The decision rules are left to the user to determine and allow parameters that vary in importance to rank differently, depending on the context of the particular model run. Default rules are provided and recommended, unless specific, regional knowledge suggests an alternate evaluation.
Recall that the objective of SWAMP is to determine an individual wetland's functional contribution to the watershed in which it exists. This contribution is measured for three functions: water quality, hydrology and habitat. Functional significance for each of these primary functions is divided into three broad classes rather than attempting to derive a specific numerical "score." The three broad classes of ratings that SWAMP uses to describe a wetland’s functional significance are exceptional (E) functional significance, substantial (S) functional significance, and beneficial (B) functional significance.
The approach of classifying wetlands into three broad functional significance classes also is used, however, because it is justifiable with our current understanding of wetland function. Attempting to assign a specific value along a numeric continuum of functional significance potentially exaggerates the accuracy with which current knowledge can realistically be applied. The three significance classes used in SWAMP provide the information necessary to meet the procedure's objectives without going beyond the realm of reasonable scientific validity. As scientific understanding increases, however, it is reasonable to expect that specific numerical assignments can be integrated into SWAMP.
As explained previously, the basic evaluation is performed at the parameter level. A value is assigned to each parameter as it relates to the performance of the wetland function being considered. For example, if the soils underlying a wetland have properties that are highly conducive to the function being considered, the soil characteristics parameter is rated E; if soil properties are less conducive to performing the function, the parameter is rated S; and if soil properties are not at all conducive to the function, the parameter is rated B. The individual parameter rating is then combined with other parameters to give an E, S, or B rating for the function to which it contributes.

The evaluation of individual parameters is based on fundamental ecological principles about how wetlands and landscapes function. The process of successively combining ratings up the structural hierarchy is the most complex aspect of the SWAMP procedure. Since the ecological processes themselves interact in complex ways, combining ratings is much more complex than a simple summation of individual ratings. Because managers wished the opportunity to alter the arrangements for developing the final outcome, however, an interface was developed to allow users to change the defaults and combine the parameters to meet their needs. The user has the responsibility of creating the priorities for the ratings (though defaults are provided).
SWAMP maintains all of the individual parameter ratings and combinations within the ArcView project. Since the combining process can be complex, it may not be obvious why a wetland receives an exceptional, substantial, or beneficial rating for any function. The database component of the ArcView project makes it possible to trace through the parameters and couplings that result in a wetland's final rating.
This database also makes it possible to consider specific wetland functions individually. For example, in a watershed targeted for nonpoint source pollution reduction, it might be a management objective to give the highest level of protection to wetlands most important in performing water quality. The database makes it possible to examine each wetland for its significance in each function.
Individual function ratings in the database can also be used to improve planning, impact assessment, and mitigation for development projects that impact wetlands. If alternative sites are available, such as alternative corridors for a highway, the alternative with the least impact on the wetland function considered most important in the watershed can be identified. Rather than simply minimizing the number of acres of wetlands impacted, the objective would be to minimize impacts to the most important wetland functions. Environmental assessment of wetland impacts can identify specific functions that would be lost. Mitigation can be improved by giving high priority to sites with the highest potential for performing the same functions.
For a wetland to actually perform a given function, it must have both the opportunity and the capacity for that function. Considering nonpoint source pollution, for example, there must be a source of potentially polluted runoff entering the wetland to provide an opportunity, and the wetland must have the internal capacity to hold the runoff and remove the pollutants before releasing the water. Opportunity to perform a function is usually determined by factors external to the wetland, while capacity to perform the function is determined by properties of the wetland itself along with its landscape position.
Since SWAMP is a landscape-scale procedure that evaluates the functions a wetland performs in relation to its surroundings, opportunity parameters are included where appropriate. A functional assessment that is too heavily dependent on opportunity parameters, however, is static and will rapidly become invalid as land use changes. A wetland that is bordered by natural forest today can be bordered by a young pine plantation or a subdivision under construction by next year. The fact that a wetland does not have the opportunity to perform certain functions today does not mean that it will not have the opportunity in the future. If an assessment of wetland significance is to remain valid over time in a landscape subject to change, opportunity parameters alone cannot be determinative.
These conventions hold throughout the SWAMP evaluation procedure. A present high opportunity to perform a function can result in an evaluation of essential significance for the function, but high capacity can also result in an essential evaluation even if present opportunity is lacking. Lack of present opportunity alone should never result in a lower level of significance for a function. Opportunity is treated essentially as a "bonus" consideration that can result in a higher evaluation for a wetland than its capacity alone would indicate but that will never result in a lower evaluation because of its absence. The user has the choice of whether to include the "bonus" in the evaluation.
Application of SWAMP is a hierarchical process in which individual parameters are first evaluated and then successively combined to produce ratings for functions. The processes of evaluating parameters and then combining them are two separate steps. Each step of parameter evaluation and combination is based on ecological principles and/or assumptions based on best professional judgment.
As previously described, all GIS analyses were performed in ArcView Spatial Analyst. A raster environment was chosen for quick processing speed and concurrent layer evaluation. All the data used in this evaluation originated in vector format and were converted to raster format (ARCGRID® or grid) using a 10-meter cell size. Each parameter used in this model was produced using Avenue programming, and each parameter results in an output grid.
The user must first determine which class of wetlands (currently tidal or riverine) and which component, or function, they wish to evaluate. Using a pull-down menu, the user selects the module and the function. The user is then asked to select a watershed for the next series of evaluations.
The user may alternate between functions within the watershed to evaluate all three, but once another watershed is selected, the user will have to re-enter the watershed of interest to return to evaluations of it. Each wetland falling into the class selected (e.g, tidal or riverine wetlands) is evaluated for its contribution to each function within the watershed in which it resides.
The watershed boundaries used in this application of the model are from the United States Geological Survey’s (USGS) 14-digit hydrologic unit database; however, watershed boundaries potentially can be from any source. Prior to evaluating parameters, the user must select the watershed of interest and this boundary becomes an analysis mask for all processing within the module. At this time, the land cover data are clipped to the watershed boundary.
In order to provide an example of the GIS processing techniques that are used in this model, a detailed description of a single parameter is presented. The parameter that is discussed is "width perpendicular to stream," which is one of eight parameters evaluated for the water quality function of the tidal wetland module. The premise of the width perpendicular to stream parameter is that the wider the wetland is adjacent to the channel, the more surfaces there will be for soil exchange, thereby removing the nutrients that would otherwise end up in the water. For this parameter, wetlands are grouped into contiguous wetland complexes, assuming that these wetlands will work together as a system.
To evaluate this parameter, the user must supply a data set that represents the stream network within the watershed. The input data source used in this application is the 1:24,000 USGS hydrology data (digital line graphs). Default ratings for this parameter are: essential, wetlands that are greater then 100 meters wide where they are perpendicular to a stream; significant, between 50 and 100 meters wide where the wetland is perpendicular to a stream; and beneficial, less then 50 meters wide where the wetland is perpendicular to the stream or not adjacent to a stream.
 The first step in analyzing this parameter is to group contiguous wetlands together to form a wetland complex. A complex is analyzed rather than an individual wetland because contiguous wetlands act as a system, and water will continue moving through the system. In contrast, the individual wetland type difference may only reflect a change in vegetative cover. The RegionGroup function is used to determine which wetlands are contiguous. In the image to the left, the different colors represent the zones or groups that are the results of running the RegionGroup function. |
 The next step uses the FocalStats function to buffer the stream data by one cell (10 meters in this case). This buffer is implemented to overcome some of the inconsistencies that might exist between the hydrography and wetland data sources, essentially widening the area recognized as a stream channel. The image to the left is zoomed in to a larger scale to depict the widened stream that is used to determine adjacency. |
 SWAMP next relies upon the ZonalStats function to determine which wetland complexes are immediately adjacent to the streams. This step is necessary to separate the adjacent wetlands from the nonadjacent wetlands. Those wetlands NOT considered adjacent receive the lowest rating and are excluded from further analyses. In the image to the left those wetland complexes that are shaded red are not adjacent to a stream and will receive the lowest rating. |
 In order to determine the width perpendicular to a stream, the EucDistance function is used to calculate the distance (width) from the stream. The result of this function is a grid consisting of cells with values reflecting the distance from the original source (the stream). Euclidian distance does not take into account topography, and it measures the diagonal distance across the cell. This image, which zooms into a small section of the watershed, depicts the results of running the EucDistance function from the stream to 110 meters. Values range from 10 meters (light blue) to 110 meters (red). |
 The ZonalStats function is then used to determine the maximum width (or distance) of any wetland that is adjacent to a stream. Wetlands that extend to the edge of the previous step are at least 100 meters wide and are afforded the highest rating. The remaining wetlands that are within the adjacent stream buffer but not 100 meters wide are given the middle category of rating. This image, which shows the same extent as above, shows how the euclidian distance values are assigned to the wetland complexes. The wetlands in red have a width perpendicular to the stream that is greater than 100 meters, while the wetlands in green are less than a 100 meters wide, but greater than 50 meters wide. |
 This image shows the final results for the width perpendicular to stream parameter. Wetlands in red received an essential rating (E) and have a width perpendicular to stream greater than 100 meters. Wetlands in green received a significant rating (S) and have a width perpendicular to stream greater than 50 meters and less than 100 meters. Wetlands in blue received a beneficial rating (B) and have a width perpendicular to stream less than 50 meters or are wetlands that are not adjacent to a stream. |
After all of the parameter grids have been created, the user has the option of using one of two methods for combining them to create the final output. The first approach follows the rationale of SWAMP and its predecessor by allowing various combinations of the parameters to achieve similar results. In other words, there may be multiple combinations of parameters that result in the highest or lowest rating. The user must determine the essential and beneficial characteristics of a wetland through a hierarchy of iterative selections. The interface itself was constructed using Visual Basic and dynamically interacts with ArcView to evaluate only the parameters that appear in the active view.
The user first establishes the essential and beneficial combinations for the lowest level of grouping within the component (function) of interest and may opt to explore various combinations for each rating. Using statements of "and" or "or," the user may build any combination of the coupled parameters. Each combination is calculated immediately, and a resulting grid is presented to the user in a matter of seconds. The decision rules of each resulting grid are stored within the theme properties. These grids can be used in the next level of grouping or ignored.
| ArcView Interface with parameters for Tidal - Water Quality
|
|
|
|
|
|
When satisfied with the options created, the user will finalize the grouping by clicking the "Set Component" button. At this point, the user must design a query statement that uses as many of the previous combinations as desired and establish a precedence for one result over the other. This is completed for both the essential and beneficial ratings as well and can be repeated as many times as the user chooses. This process is completed for each coupling of parameters until the final function is evaluated.
| User Interface for setting final combinations
|
Results of setting component combinations in ArcView
|
The user may experiment with various options and determine which result meets their need. When the user is satisfied that they have made adequate combinations, they will be taken to the next level of decisions and asked to build a similar query.
| User interface to finalize a function
|
Final results of a function in ArcView
|
The second, and more traditional, approach allows the user to apply weights to each parameter grid before they are combined. With this approach, all the weights must add up to 100, and the weights are then multiplied with the parameter grid. The parameter grids are then summed. At this point the user is presented with a histogram of the resulting values and is asked to assign the final thresholds that will be used to break the final output into three categories.
| User Interface for setting weights
|
Histogram for setting break points
|
|
|
|
To remain current with technological advances, further improvements to SWAMP will be programmed in Visual Basic rather than Avenue. This transition will occur as the base code to access ArcView commands becomes available. At that time, the Center will consider creating the headwater and depressional modules.
The Center also is exploring the use of a SWAMP-like approach to address particular management issues, such as restoration. Using the functions identified, staff will develop appropriate parameters to help partners choose restoration sites that have the greatest significance within the landscape.
The authors would like to acknowledge the work of the North Carolina Department of Environment and Natural Resources Division of Coastal Management in the development of the original model concept. We also are thankful to the participants of the ACE Basin workshop help in November 1998 and especially to Pace Wilber for encouraging the development of this model and interface.
Brinson, M.M. 1993. A Hydrogeomorphic Classification for Wetlands. Wetlands Research Program Technical Report WRP-DE-3, U.S. Army Corps of Engineers, Waterways Experiment Station, Vicksburg, MS.
Cowardin, L.M., V. Carter, F.C. Golet, and E.T. LaRoe. 1979. Classification of Wetlands and Deepwater Habitats of the United States. U.S. Fish and Wildlife Service Report. FWS/OSB-79/31. 131 p.
Hefner, J.M., B.O. Wilen, T.E. Dahl, and W.E. Frayer. 1994. Southeast Wetlands: Status and Trends, Mid-1970's to Mid-1980's. U.S. Fish and Wildlife Service. Atlanta, Georgia.
Sutter, L.A., J.B. Stanfill, D.M. Haupt, C.J. Bruce, J.E. Wuenscher. 1999. NC-CREWS: North Carolina Coastal Region Evaluation of Wetland Significance. North Carolina Division of Coastal Management, Department of Environment and Natural Resources. Raleigh, NC.
Lori Sutter
Ecologist
Technology Planning & Management Corporation
NOAA Coastal Services Center
2234 South Hobson Avenue
Charleston, South Carolina 29405
843.740.1200
FAX: 843.740.1315
Clearinghouse@csc.noaa.gov
Jeff Cowen
Physical Scientist
NOAA Coastal Services Center
2234 South Hobson Avenue
Charleston, South Carolina 29405
843.740.1200
FAX: 843.740.1224
Clearinghouse@csc.noaa.gov