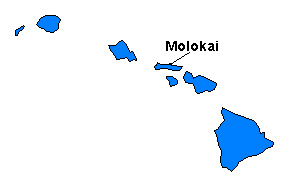
Figure 1. Location of Molokai Island, Hawaii
Figure 1. Location of Molokai Island, Hawaii
Bovine tuberculosis (TB), caused by the bacteria Mycobacterium bovis, is a chronic, infectious disease that affects warm-blooded vertebrates, including humans. The clinical signs may include debilitation, weakness, anorexia, and/or fever, with the thoracic organs commonly developing tubercles. Animals usually become infected with bovine tuberculosis bacteria through aerosol transmission, but the disease can also spread through ingestion of contaminated feed or water, or contact with contaminated feces (Fraser, 1991).
Mycobacterium bovis organisms can survive outside of the host's body for only short periods of time. The disease also takes months to develop within a host, progressing slowly, so that the disease may be dormant within a host for its entire lifetime. Risk of infection is greatest when animals are congregated around common watering and feeding areas. If bovine TB occurs in wildlife near livestock operations, it is essential to have a good fencing system to keep animals from intermingling with wildlife (USDA, 1995).
If a cattle herd tests positive for M. bovis, positive reactors are removed from the herd and all animals are re-tested after sixty days. This cycle is repeated until all tests are negative. Alternatively, the entire herd may be depopulated and the area sanitized. This more radical approach may be used when there is a risk that infection is likely to spread to other animals. Depopulation of the entire herd is often performed when other methods are too costly or will be less effective in ensuring disease eradication.
On the southeastern end of Molokai Island, thoracic lesions were found on an adult cow indicating bovine tuberculosis in March of 1997. Both animal health officials and the livestock industry in Hawaii were extremely concerned; 9,000 cattle had already been depopulated on the island between the years of 1983 and 1987 to eradicate any remaining TB infection in cattle persistent since the 1940's. In addition, Molokai lost its TB-accredited free status, banning the entire state of Hawaii from cattle trade due to quarantine laws.
This was not the first time M. bovis culture was found in cattle on Molokai. Infected herds had been discovered both in 1978 and 1987. Wildlife involvement in the epidemiology of bovine tuberculosis became a major concern because of historical reports of infection in four axis deer between 1962 and 1972, and a twenty percent prevalence of infection in swine following a wildlife survey done in 1980 (Essey, 1983). All infectious animals had been found on the eastern part of the island. Mycobacterium bovis infection had not been documented in wildlife fifteen years prior to the 1997 outbreak, therefore any suspicions that bovine tuberculosis might be maintaining in reservoirs other than cattle was purely speculative.
In fact, it was concluded that a decline in M. bovis infection in wild swine had occurred between the 1980 and 1983 due to depopulation of the 1978 infected herd and increased hunting and poaching. A sample taken of one hundred axis deer in the 1980 wildlife survey did not turn up any infection at all (Essey, 1983). Testing cattle herds adjacent to the index farm of 1997, tracing possible sources of infection from other herds, and identifying and testing exposed cattle that were now members of other herds were all performed after the 1997 outbreak. No evidence of M. bovis infection was identified in any of these tests; therefore Molokai Island regained its accredited-free tuberculosis status (Meyer, 1998).
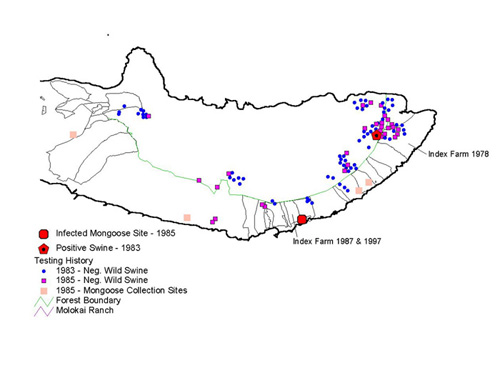
Figure 2. Wildlife and Cattle Testing History
The chronic infection of bovine TB on the island, coupled with historical reports of infection in axis deer, feral pigs and mongoose, led to renewed speculation that TB might possibly be maintaining in reservoirs other than cattle. To prevent the chance that tuberculosis would reoccur on the island, the foci of infection would need to be determined. If M. bovis infection was indeed maintaining in wildlife reservoirs, where were those reservoirs located, and has it been increasing the risk for wildlife to transmit infection to cattle?
After the depopulation of cattle in 1997, the next step involved determining whether M. bovis was being maintained in reservoirs other than cattle, and if so, where those wildlife were located. Species of axis deer, feral swine, and goats, as well as mongoose, were chosen as potential reservoirs because of their popularity with hunters and history of tuberculosis infection. It was concluded that at least three hundred samples of each would need to be attained and tested before any prevalence issues could be addressed (Meyer, 1998).
Traditional wildlife sampling methods are nearly impossible to perform on Molokai due to the extremely rugged terrain. Therefore, local hunters, many adapted to the terrain and knowledgeable about where to find wildlife, were offered rewards for reporting suspicious cases and collecting tissue samples for lab analysis from animals they had killed.
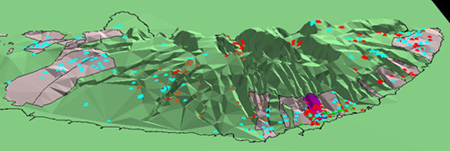
Figure 3. 3D Model of Eastern Molokai Island
When the hunters killed an animal, they would mark on a map of Molokai exactly where they had killed that animal. These spatial locations were then imported into ArcView, the attribute database containing ID numbers, histopathology, and culture results. The records were then queried and displayed by species type to determine the distribution of wildlife kills by species.
As of May 1, 2000, two feral swine have been diagnosed with M. bovis infection on the southeastern end of the island, inside the boundaries of one existing cattle farm, and close to the index case occurring in 1997. Bovine tuberculosis was indeed existing in wildlife on Molokai and spatially, was a potential risk to cattle on the southeastern end of the island. In addition, Euclidean distances were calculated from each wildlife species to the boundary of the index farm - the distances ranged from 0 (inside the farm boundary) to 1.18 kilometers.
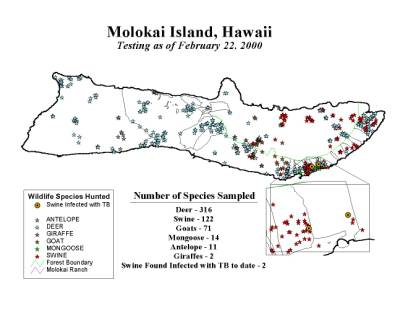
Figure 4. Current Wildlife Testing
The types of data collected for base and ancillary layers included digitized boundaries, landmarks, and cattle farms on the island obtained from a 1:25,000 scale topographic map, 1997 TIGER data for hydrology and roads, a Landsat Thematic Mapper 5 scene (acquisition date: November 10, 1991), STATSGO soils, and USGS 7.5 minute digital elevation models that were eventually mosaicked.
Two other more in-depth methods were employed to determine where exactly wildlife are existing on the island. Initial phases of both classification analysis, which determines vegetative cover, and home range polygon fit techniques have been analyzed.
Categories of vegetative cover were determined using three unsupervised classification methods, automatically categorizing raster cells from a Landsat TM 5 image, not including the thermal band, into twelve spectral classes. Additionally, a raster mask that eliminated cloud cover over the island was used to make the classification process more accurate. Initially, an unsupervised classification was run breaking out raster cells into forty different classes using an ISODATA classification method, which determines the closest computed class center to a cell while splitting, combining, and discarding trial classes (TNT Reference Manual, 2000).
The resulting ISODATA classification rasters, both a class raster categorizing each value from the classification, and the distance raster showing how well each cell fits its assigned class, were then used as inputs to further break down the image into twelve separate classes. The Fuzzy C Means classification method uses rules of fuzzy logic to calculate numerical grade of membership for each cell into a class by first allowing a cell to have partial membership in several classes (TNT Reference Manual, 2000). The Adaptive Resonance method is based on neural network computing techniques designed to recognize natural groups of spectral patterns in data and to produce the same class identification in response to input of similar patterns (TNT Reference Manual, 2000). The ISODATA classification method described above was used as the third classification procedure.
Four types of statistical analyses gleaned from each type of classification process can be used to compare the different methods, eventually determining which method is the most reasonable to assimilate with what is already known about the vegetative cover of Molokai. Output statistics tabulate the number and/or percentage of cells assigned to each class along with mean and standard deviation information. Ellipse scatterplots show the distribution of classes projected onto a 2D plane further identifying the types of features included into each class. Dendrograms show the degree of relatedness of the output classes to determine if merging of classes needs to be done. Co-occurrence analyses analyze the spatial associations of pairs of classes to see which classes are spatially associated (Smith, 1999).
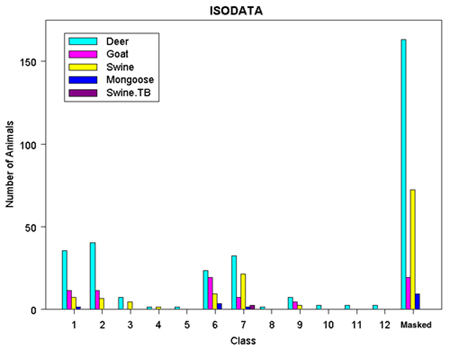
Figure 5. ISODATA Classification Results
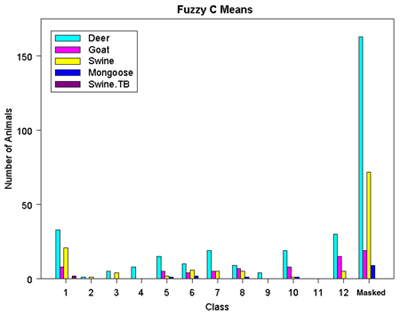
Figure 6. Fuzzy C Means Classification Results
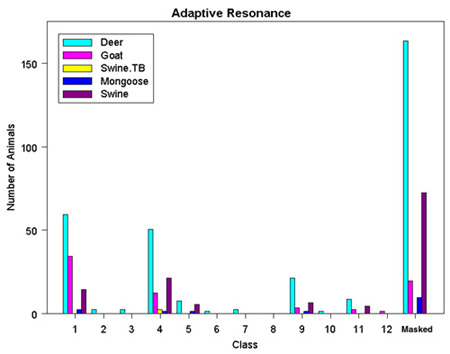
Figure 7. Adaptive Resonance Classification Results
Based on a 1972 study by Griffin, island swine movements are limited given an adequate food supply (Griffin, 1972). It has not been determined whether these same assumptions can be extrapolated to other species inhabiting the island. The kernel home range technique, used in ArcView through the Alaska Group's Animal Movement extension (Hooge, 1998) was used to calculate a fixed kernel home range distribution as a grid coverage. The extension spatially determines reasonable home ranges for each type of wildlife species based on the type of smoothing parameter used. 50%, 75%, and 90% output contours were calculated to determine the range of movement probabilities - the 50% contour delineating the core area of animal habitat and the 90% contour the extents to which the animals actually move (Hooge, 1998).
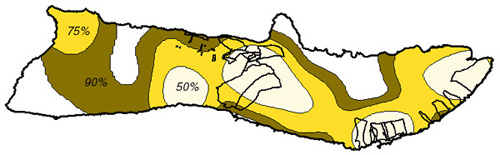
Figure 8. Deer Range
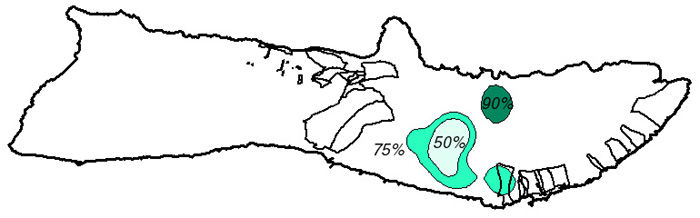
Figure 9. Goat Range
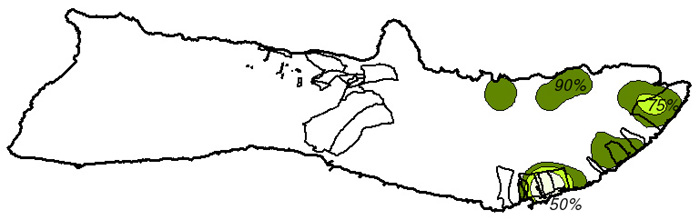
Figure 10. Swine Range
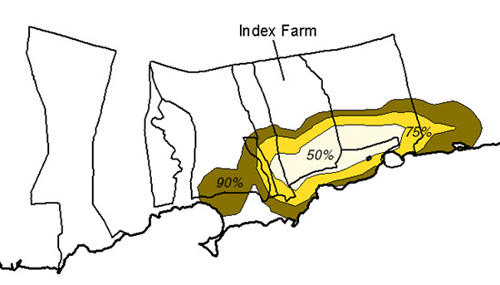
Figure 11. Mongoose Range
The wildlife-cattle interaction studies on Molokai Island have a spatial component; however, this is the first time a spatial database was created to store, view, and manipulate the data in an easy-to-use, comprehensive fashion. The most obvious result has shown that M. bovis infection is occurring in wildlife on the island, pathogen reservoirs are being found in animal species other than cattle. This on-going survey has shown two wild swine to be infected with bovine TB, one of these was killed inside the boundaries of the index farm of the 1987 and 1997 outbreaks; the other found inside the boundaries of an existing cattle farm, adjacent to the index farm. This strongly suggests that wildlife are at risk for transmitting the disease to cattle. No infected animals have currently been found near the index farm of the 1978 outbreak; however, the wildlife survey has not yet been completed.
In the future, many ecological factors associated with the spread of tuberculosis will be examined to determine the impact of wildlife-cattle intersections on pathogen dissemination. We plan to use pasture/paddock movements, corridor analysis, and various types of spatial modeling. In addition, slope, aspect, habitat ranges of wildlife, cattle density, and surface modeling techniques will be analyzed thoroughly through more rigorous statistical tests.
Classification and home range data will be refined to analyze the significance of vegetative cover, animal movement, and population density on the presence or absence of infection. Eradication of tuberculosis is important for the Hawaiian cattle industry; therefore it is likely that intense hunting of reservoir species will be used to mitigate the risk of pathogen transmission, especially in areas of southeastern Molokai Island.
Essey, M.A., Stallknecht, D.E., Himes, E.M., and S.K. Harris, 1983. Follow-Up Survey of Feral Swine for Mycobacterium Bovis Infection on the Hawaiian Island of Molokai. Proceedings of the 87th Annual Meeting of the United States Animal Health Association, Las Vegas, Nevada.
Griffin, Jon, 1972. Ecology of the Feral Pig on the Island of Hawaii. Hawaii Department of Land and Natural Resources, pp 90-92.
Hooge, Phillip N. 1998. Animal Movement Analysis ArcView Extension. [On-line] Available:http://www.absc.usgs.gov/glba/gistools/animal_mvmt.htm.
Fraser, Clarence M. et al. editors. 1991. Merck Veterinary Manual, 7th Edition. Rahway, N.J.: Merck & Co., Inc., 1832 pp.
Meyer, Robert M. 1998. Bovine TB on Molokai Island Results of a Wildlife Disease Survey to Date. Proceedings of the 102nd Annual Meeting of the United States Animal Health Association, Minneapolis, Minnesota.
Reference Manual for TNT Products V6.20. 2000. Lincoln, Nebraska: MicroImages, Inc.
Smith, Randall B. 1999. Image Classification with TNT Mips. Lincoln, Nebraska: MicroImages, Inc., 36 pp.
USDA:APHIS:VS:APHIS, 1995. Bovine Tuberculosis. [On-line] Available: http://www.aphis.usda.gov:80/oa/pubs/fsbtb.html.