Scot D. Weaver
Jeffrey A. Donze
Visualizing Environmental Data using ArcView GIS and EQuIS
Performing advanced analysis and visualization of environmental and geologic data can be done easily and quickly using the EQuIS ArcView GIS Interface. A consortium comprised of EarthSoft, RockWare, and Esri has recently developed tools to facilitate better and more efficient use of environmental and geologic data than has heretofore been possible. This solution involves the integration of several industry-standard applications such as ArcView, EVS, GMS, LogPlot, RockWorks, and more to produce a world-class, customizable solution for subsurface investigation and analysis...all accessible through a spatial GIS environment.
Introduction
Environmental data management, particularly data collected and managed from beneath the surface of the earth, presents one of the more difficult information management scenarios we face today. Whether for Superfund site management or for regional monitoring activities of aquifers, the scenario presented by groundwater and soil contamination is a complex one.
Environmental site evaluation and remediation efforts involve multiple organizations each with different roles and responsibilities in monitoring and cleaning up a site. Typically, an environmental engineering firm is engaged to drill wells and take core samples. These samples represent the collection of data for the site and assist in characterizing the environmental issues that lay beneath the ground. In addition, borehole log sheets are collected that allow the geoscientist to evaluate events beneath the earth's surface. Soil and groundwater samples are analyzed by a laboratory which, in most cases, uses a LIMS (Laboratory Information Management Systems) to manage the sample data and analysis results. These results are passed back to the contractor for evaluation and on to federal and/or state agencies that are regulating the site. With such a complex chain of organizations each participating in the remediation process, effective information management is critical. Frequently, however, effective management does not occur due to poor communication between parties involved or the disparity of tools they employ (or do not employ) to get their work accomplished.
The process of compilation also presents data quality issues; problems often result from field data collection to data compiled in spreadsheets and disparate databases. Such problems may include incomplete and inconsistent data, data duplications, synonyms, and ambiguous references to data. Environmental data requires a database; spreadsheets that are so frequently employed are inadequate. Spreadsheets lack referential and relational integrity. Spreadsheets also lack constraints and enforced relationships that are available in relational database management systems. Simple databases that do not enforce relationships also do not suffice. Without enforced relationships, data integrity can be broken. In the process of the data being submitted to and from the lab there are often no standards for electronic deliverables (EDDs). Many labs are unable to make complex electronic deliverables in a consistent, correct, complete, and conforming (4C's) manner. Clients are unable to quickly process various formats to make data usable in their analysis. All of these issues clearly point towards the necessity of utilizing a relational database to properly manage environmental site data.
EarthSoft's Environmental Quality Information System (EQuIS) provides an integrated suite of applications and a common database management system for all organizations involved in the data collection, processing, management and evaluation aspects of environmental project work. Figure 1 presents the process of data flow in the EQuIS system.
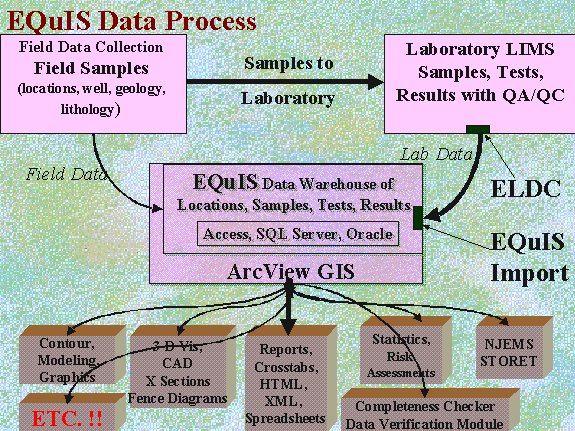
Figure 1. Data flow in EQuIS.
Another issue of concern for the geoscientist working with environmental site data is that such data is spatial in nature; viewing the data dimensionally provides a perspective, and oftentimes insight, that is not as perceivable when viewed in the format of a paper report. For example, the scientist needs to be able to view spatial relationships such as location of wells where contaminated materials have been found and proximity to drinking water sources. Without the ability to work with these data and display them geographically the interpretation and investigation of such problems is made much more difficult. With environmental site analysis, the geoscientist would like to view several graphic depictions of the situation under the earth surface with data from the boreholes. These graphics might be borehole logs, two dimensional charts, fence diagrams, three dimensional plume representations, maps of well locations and other surrounding features (buildings, streams, habitats, surficial water bodies, etc.).
To this end, GIS technology like Esri's ArcView GIS becomes a critical integration tool for the geoscientist requiring these varied views of the information. Performing advanced analysis and visualization of environmental and geologic data can be done easily and quickly using the EQuIS ArcView GIS Interface.
The EQuIS system uses ArcView as a 'data broker' to serve data to several different analysis applications within a GIS environment. ArcView has been customized so that it can tie all the tools together that the geoscientist uses in their evaluation of a site. Figure 2 shows how the Colorado Department of Public Health and Environment has integrated a completed environmental data management system including EQuIS, ArcView, and various other packages that provide the required results for dealing with contaminated sites (Thompson 1999).
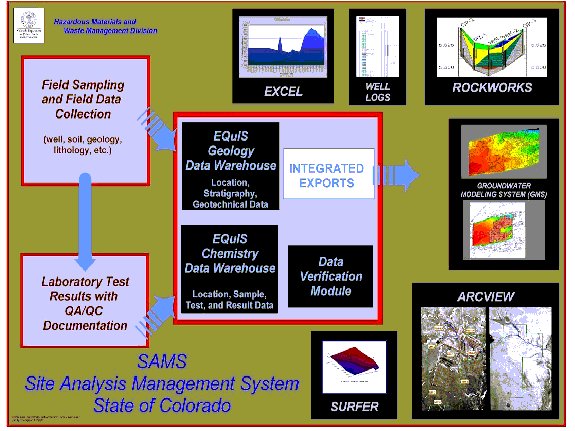
Figure 2. Site Analysis Management System implemented by CDPHE.
The EQuIS ArcView GIS Interface
The EQuIS ArcView GIS Interface provides a flexible yet simple means of accessing, analyzing, and viewing geology and environmental chemistry from within Esri's ArcView GIS. EarthSoft's EQuIS Chemistry and EQuIS Geology extensions make available many options for 1D, 2D, and 3D visualization and modeling, as well as reporting and enhanced labeling options. The focus of the EQuIS ArcView GIS Interface is integration: several different industry-standard products have been integrated resulting in a cutting-edge distributed system for data management, analysis, and visualization within the GIS environment. Instead of forcing the user to use only a single application from a single vendor, possibly compromising quality, this model of integration allows the user to use professional tools developed with a focused expertise with much more power and efficiency than was previously possible.
Any number of ArcView project .apr files may be associated with a given EQuIS project. The "EQuIS Default APR" launches ArcView and results in a View containing only a 'dt_location' theme.
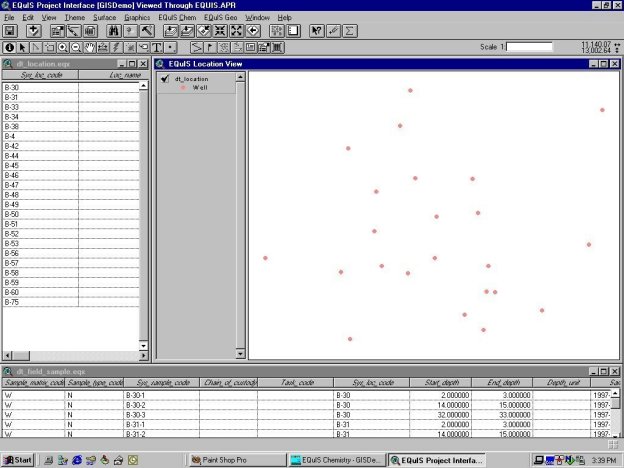
Figure 3. Initial EQuIS ArcView startup view with dt_location theme.
This theme represents the location of boreholes or wells within the current EQuIS project. In addition to the view, tables are displayed showing the locations and, where appropriate, field sample information. Unlike other extensions where the user may be required to link fields between tables and set up ODBC drivers and/or connections, configuration and setup of the data within ArcView is accomplished behind the scenes, with no interaction from the user required. Location, sample, well, water level, lithology, and analyte information is automatically extracted from the EQuIS databases and loaded into ArcView for further visualization and analysis.
To more closely represent the site under investigation, various other themes may be added to the view. These may include point or polygon shape files, or other files including Digital Elevation Models (DEMs) or orthophotos. Additionally, we can use the Post Information feature under the EQuIS Chem menu to label each location with its unique identifier. Figure 4 shows each borehole location labeled with a unique identifier (sys_loc_code) and a site map showing the outline of several buildings loaded into the view.
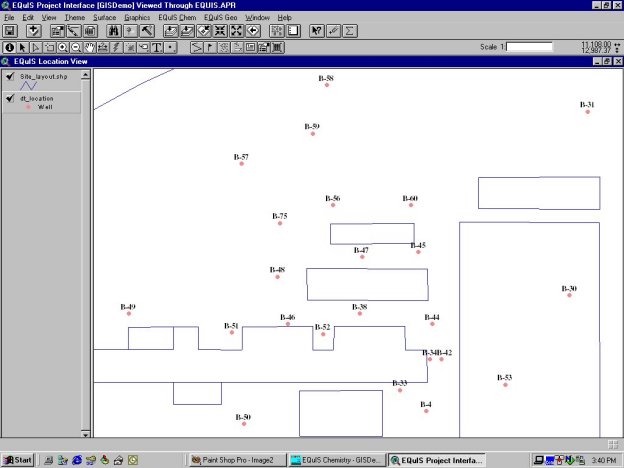
Figure 4. Full Location View with locations labeled and site map theme loaded.
Geologic Visualization and Analysis
Version 2 of the EQuIS ArcView Interface (recently released in April 2000) provides the user with unprecedented capabilities for visualization and analysis of geologic data. While many different extensions supporting innumerable industries have been developed for ArcView, until now, little has been available to adequately meet the needs of geologists. However, that has not eliminated the need for geoscientists to be able to access their data within a GIS.
"The ability to generate cross-sections and work with borehole data within the ArcView environment would greatly enhance the current suite of ArcView functionality for geologists who are working with the software. I know that this would attract many additional users within our agency, and I expect that these types of functions would appeal to many other people in the Esri community (USGS, EPA, NRCS, the oil and gas industry, environmental consultants, mining companies, other state geological surveys, universities, and others)" (Krumm 1998).
The EQuIS ArcView GIS Interface facilitates multidimensional viewing and analysis of geologic data using any of several different applications including Esri's 3D Analyst, RockWare's LogPlot and RockWorks, the Department of Defense Groundwater Modeling System (GMS), and CTech's EVS. In future versions, additional applications such as gINT from GCA and Groundwater Vistas from Environmental Simulations, Intl. will be supported.
Geology Visualization and Analysis: 1 Dimension
One of the simplest operations is displaying the lithology, or stratigraphy, data for a given location. By simply choosing a single location and then selecting View Lithology from the EQuIS Geo menu, a representation of the lithology data defined for the location is displayed. Figure 3 shows the material layers defined for location B-47, as well as interpreted geologic units (Aquifer 1 and Aquifer 2).
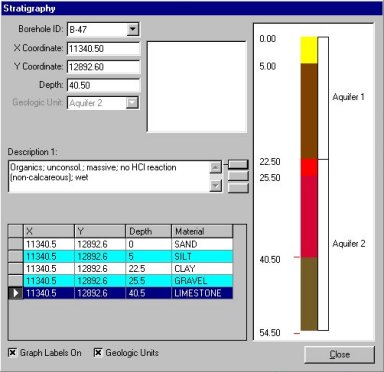
Figure 5. Lithology/Stratigraphy for location B-47.
Individual layers may be selected in the grid and comments or descriptions specific to that layer are presented. Additionally, different locations may be selected by choosing from the Borehole ID list in the upper left. While it is very easy to display the subsurface using this tool, it is primarily for display and visual confirmation. To produce a report-quality borehole log, however, is just as easy. By selecting Create LogPlot Log from the EQuIS Geo menu, a borehole log based on a previously selected template is displayed in seconds. This log is not a stored image or static representation, but is created on-the-fly and displays the latest accurate information.
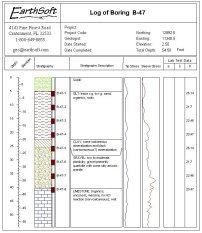
Figure 6. Borehole Log in LogPlot.
Geology Visualization and Analysis: 2 Dimensions
In order to view geologic data in two dimensions, cross-sections can be produced using RockWare's RockWorks. The EQuIS ArcView Interface includes a tool, which is used to make a point-to-point selection of locations, as shown in Figure 7.
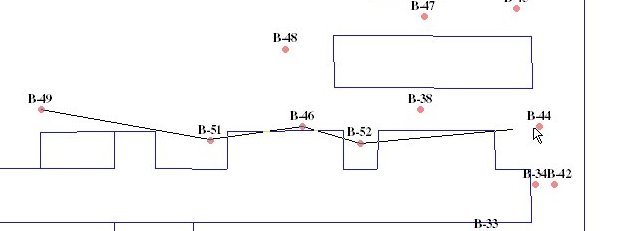
Figure 7. Selecting a point-to-point transect.
After delineating the desired transect, selecting Create 2D Cross Section from the EQuIS Geo menu results in a two-dimensional point-to-point cross section of the selected locations.
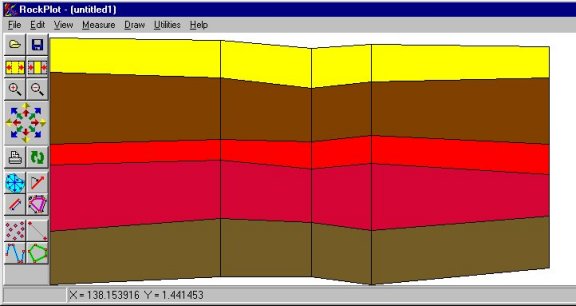
Figure 8. Cross Section in RockWorks.
The cross section shown in Figure 8 deserves some discussion. The site represented herein is fairly uniform as far as lithological layers are concerned, and a linear interpolation between locations is adequate. However, where a more complex layering scheme involves lenses and pinchouts, a linear interpolation may not be adequate. In this case, it is possible simply to represent a 'strip log' of layers found at the location. Interpolation-or interpretation-may then be left to the geologist. Additionally, ancillary data such as downhole cone penetrometer (CPT) or geophysical data, interpreted geologic units, and well screens may be represented on the cross section diagram.
Geology Visualization and Analysis: 3 Dimensions
Several options are available for three-dimensional representation and modeling. With Esri's 3D Analyst, site geology and chemistry can easily be represented. To initiate a three-dimensional representation of borehole data the EQuIS Geo menu option View 3D Lithology may be used. This selection results in the same field of boreholes as selected in the View (or all boreholes, if none are selected) being represented in a 3D Scene.
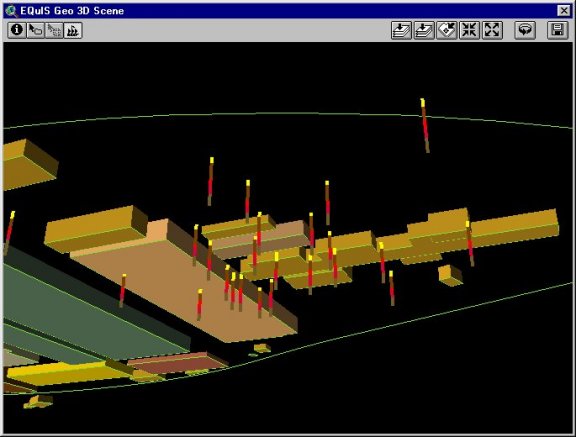
Figure 9. Boreholes represented in 3D Analyst.
As with the View, it is helpful to add themes representing the layout of structures on the site, as well as buildings, if such information is available. In this case, buildings theme was extruded to show height and colored uniquely by building type. The view in Figure 9 is looking up from beneath the site. The boreholes are represented in accordance to their geographical relationship within the site.
Now, instead of only viewing our cross section flatly in two dimensions, we can bring the same cross section into our 3D Scene. Instead of selecting Create 2D Cross Section from the EQuIS Geo menu, we can select Create 3D Fence. Using the full extent of the interface integration, geologic data is extracted from the EQuIS database and brought into RockWorks, where specific instructions dictate the creation of a 3D DXF file. This resulting 3D DXF is then sought out by ArcView and automatically loaded into a new or existing 3D Scene. Multiple 3D fences may be constructed to thoroughly represented the geologic structure of the site.
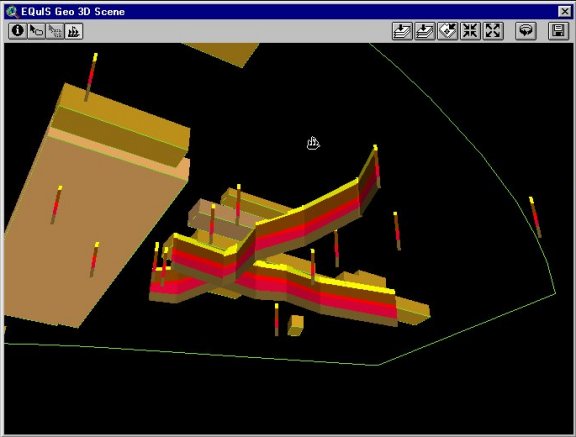
Figure 10. Subsurface representation with two 3D cross sections, shown in 3D Analyst.
While 3D Analyst is one option for three-dimensional visualization data, there are other applications that are equally well suited for such operations. The Department of Defense Groundwater Modeling System (GMS) provides the capability to constructed solid models from borehole data. However, only one click is required-selecting Create GMS Boreholes from the EQuIS Geo menu-to bring such data into GMS. Once the data is brought into GMS, surfaces can be created from the layer contacts of the boreholes. These surfaces can then be extruded and manipulated to create a solid model which is representative of the site geology. At this point, cross sections may be cut arbitrarily through the model; cross sections are not limited to point-to-point transects as they currently are when defined in the ArcView View.
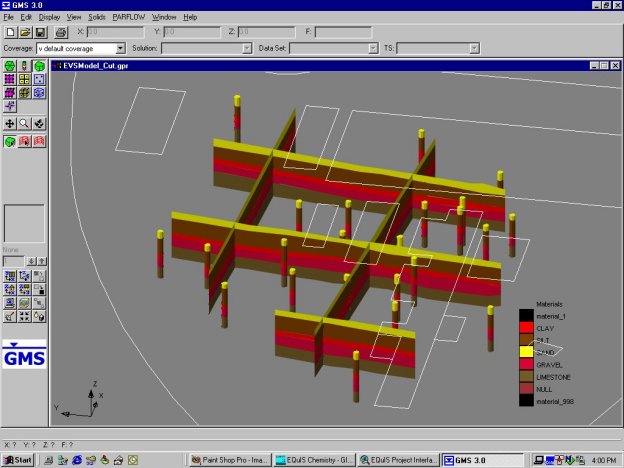
Figure 11. Cross sections created in GMS.
The complete cycle of integration is apparent when the cross sections created in GMS are exported as a 3D DXF, and then brought back into the 3D Analyst Scene.
A third option for three-dimensional visualization and modeling uses CTech's Environmental Visualization System (EVS). In partnership with CTech, the EVS for ArcView extension functionality has been integrated into the EQuIS ArcView GIS Interface. However, because the data already exists in the EQuIS database, there is no need to link specific fields from various tables within ArcView. Thus, as is the case with all of the EQuIS ArcView GIS Interface, creating the desired output can be done very quickly and easily.
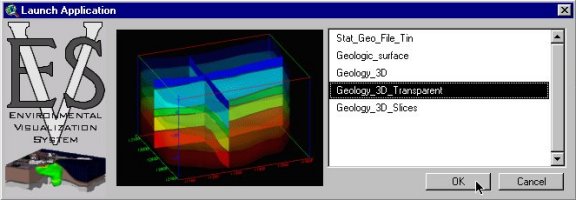
Figure 12. Options for geologic analysis using EVS.
EVS makes specific applications, or specific models, available from within ArcView. (Some applications may require the more advanced EVS Pro version.) When an application is selected from the list on the right, an image is displayed which shows what type of model will be created if that application is selected. To build that model, the user simply clicks OK. As with visualization options discussed previously, from the user's perspective, the EQuIS ArcView GIS Interface greatly simplifies modeling. The integration of a data component (EQuIS), a modeling component (EVS, in this case), and an interface component (ArcView) allows much of the process to be automated.
When the application is started, ArcView creates an extensible markup language (XML) file that contains the locations involved and the desired end-result. This file is then passed to the EQuIS Interface Language (EQuIL) interpreter, which extracts the necessary information from the database based on selection criteria made in ArcView, and prepares it for analysis in the target visualization program (in this case, EVS). EVS is then launched with the proper data file, and after only a few seconds required to perform the necessary mathematical operations (kriging, etc.) the model is presented to the user.
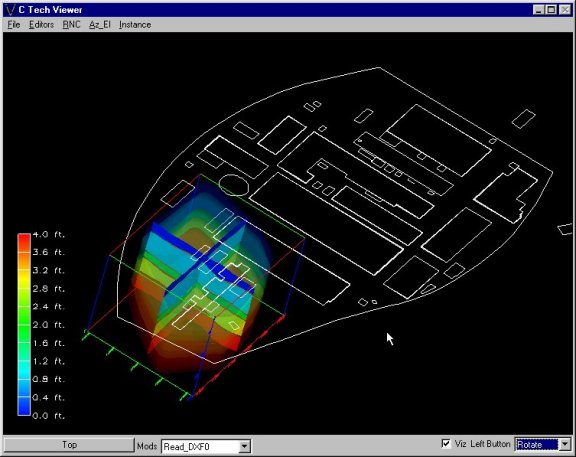
Figure 13. Geology solid model displayed in EVS.
Chemistry Visualization and Analysis
To complete the illustration of comprehensive integration of various modeling and analysis components, we will now turn our attention to the chemical element with regard to the same site we have investigated heretofore. We will then look at reporting and labeling capabilities in reference to a project with a pre-existing .apr.
Chemistry Visualization and Analysis: Modeling a Plume
Analysis and display of chemical data begins with building a chemical data theme.
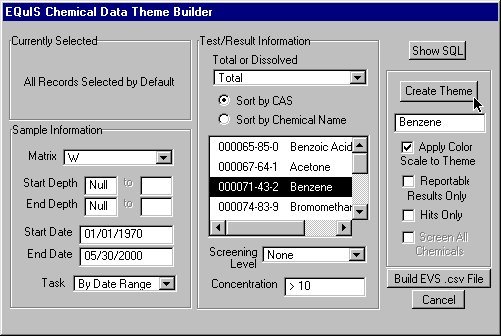
Figure 14. Building a Chemical Data Theme.
The EQuIS Chemical Data Theme Builder, accessed by selecting Build Chemical Data Theme under the EQuIS Chem menu, gives the user the capability to build a query based on any of several parameters which may pertain to chemical result information existing in the EQuIS Chemistry database. After selecting a matrix, depth and date ranges may be entered to refine the query. A task may be selected. For result information, Total or Dissolved must be selected, following which the appropriate chemicals are listed. After selecting the chemical of interest, the user may choose to create a query for an arbitrary concentration, such as where the result is greater than 10 parts per million (ppm). Similarly, the query may be run against a complete set of regulatory limits such as drinking water standards. Once the desired query has been designed, a theme may be created for display in the ArcView View, or an EVS .csv (chemical data) file may be created by clicking the Build EVS .csv File.
As with geology, selecting Launch EVS Application from the EQuIS Chem menu will present a list of applications from which to choose. If a previously created geology file (.geo) exists, this file will be recognized, and applications involving both chemistry and geology will also be made available.
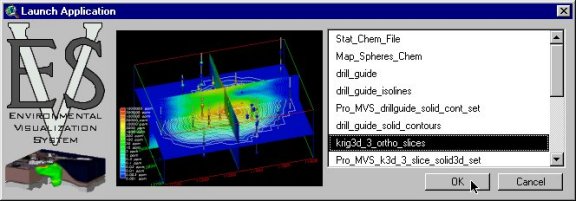
Figure 15. Applications available for an EVS chemical data export.
The end result is a model displaying three orthogonal slices with color-filled interpolation of the chemical plume. The actual data points are displayed as spheres, color scaled according to the result value. At this point, it is very easy to add a plume into the EVS network to get an overall picture of the analytical contamination.
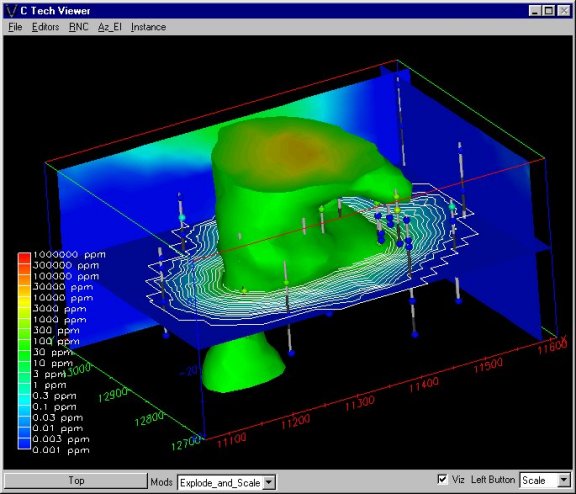
Figure 16. Contaminant Plume in EVS.
EVS provides the capability to very easily manipulate the visual display of the plume. We can display a plume representing the isosurface greater than 1 ppm or 1000 ppm, simply by changing the value of the concentration. We can also export the plume as a 3D DXF and bring it back into our 3D Analyst Scene, once again completing the cycle of integration between products.
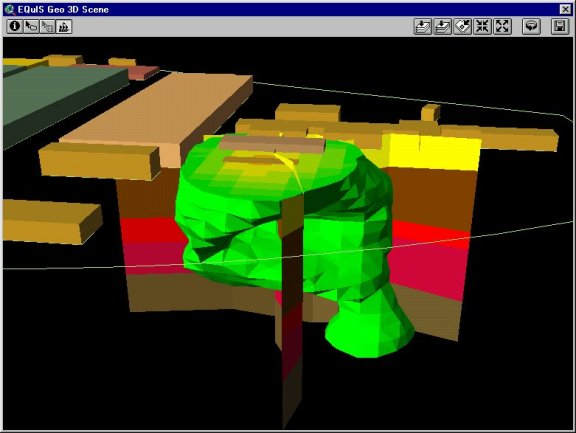
Figure 17. Contaminant plume and lithology shown in 3D Analyst.
Chemistry Visualization and Analysis: Reporting and Mapping
The investigation into visualization and analysis of geologic and chemical data using the EQuIS ArcView GIS Interface presented thus far was begun using the Default EQuIS APR, or an ArcView project that had no additional themes. The interface created the dt_location theme showing the spatial locations of the wells and/or boreholes using the current, accurate location information existing in the EQuIS database. (See Figure 3.)
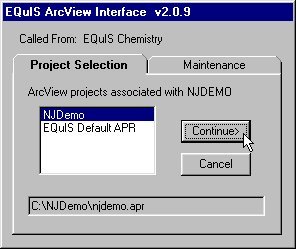
Figure 18. Selecting an alternative APR.
In addition to the EQuIS Default APR which is always available, any number of ArcView project (.apr) files may be associated with a particular EQuIS project. When the EQuIS ArcView Interface is initiated from the EQuIS application, the screen shown in Figure 18 is first presented. By clicking on the Maintenance tab, the user is allowed to add ArcView projects, remove ArcView projects (from association with the EQuIS project), and set the default APR which causes the selected project to appear at the top of the list on the Project Selection tab. This feature allows ArcView projects already in use to instantly be coupled with access to presentation and analysis of environmental data as presented herein.
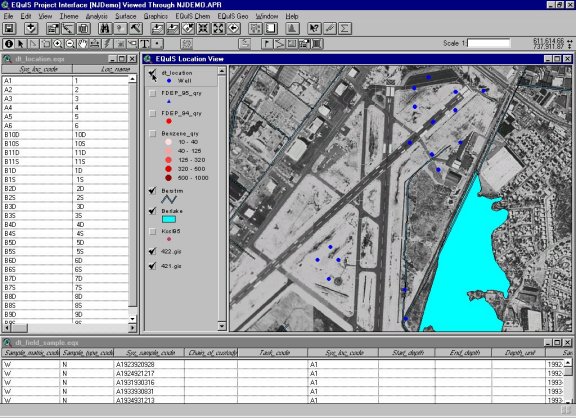
Figure 19. The EQuIS ArcView Interface launched with a pre-existing ArcView project file.
In addition to the location and field sample tables displayed along the left and bottom perimeters, respectively, and the dt_location theme, the project displayed in Figure 19 shows a number of additional themes. These include two tiled orthophotos that compose a background image of intersecting runways, a lake theme, and a stream theme. Also included are chemical data themes previously created using the Chemical Data Theme Builder. One is a theme showing benzene concentrations (Benzene_qry). The others (FDEP_94_qry and FDEP_95_qry) are queries against the set of drinking water standards for the state of Florida. Instead of querying against only one chemical, these themes were constructed using the Florida drinking water guidelines, which are an entire suite of regulated analytes.
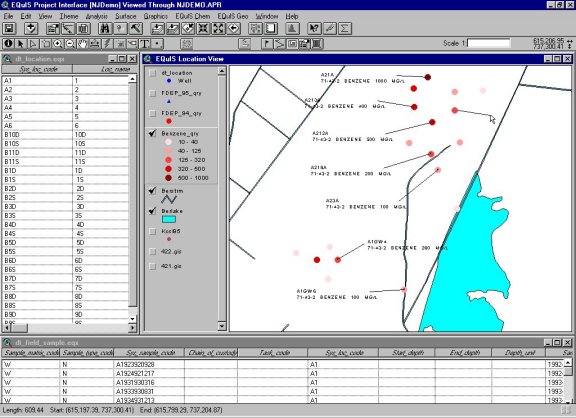
Figure 20. Benzene concentrations labeled with sample number, analyte, and result.
The EQuIS Label Tool was used to visually represent the information contained in these themes.
Simple, yet powerful, the EQuIS Label Tool improves on the native labeling capabilities of ArcView. Instead of annotating each location with only one datum, the Label Tool allows the user to select any of several pieces of information included within the chemical data theme. Additionally, these data may be grouped as desired. After selecting a location in the active theme, a leader line is drawn away from the point. The desired parameters can then be selected and group to created the desired label.
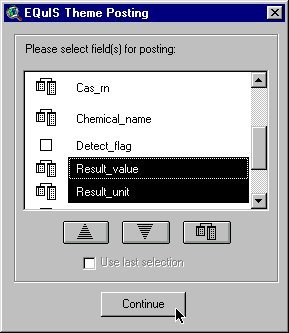
Figure 21. Labeling a chemical data theme.
In addition to labeling, more complex reporting can be accomplished using the EQuIS CrossTab Report tool. A crosstab report is a tabular report wherein multiple pieces of information are presented within the cell at the intersection of a given row and column. Unlike a common spreadsheet where the cell accommodates, essentially, one piece of information, a crosstab report allows the user to assign several such data into one cell. A common example within the environmental industry may show analyte names, reporting units, and regulatory limits along the left column, sample names and date and/or depth ranges along the top row, and result values and qualifiers in the intersecting cells.

Figure 22. Crosstab report of chemical data theme.
Future Work
While the capabilities and features discussed in this paper and made available in the current version of the EQuIS ArcView Interface represent significant and necessary advances in the accessibility of environmental data within the GIS environment, they do not constitute a complete or exhaustive suite of tools with which to perform visualization and analysis. Continued research and development is planned to further advance capabilities for analysis and presentation of environmental data. Objectives include the ability to produce trend plots of water level and analytical concentration data within GIS, as they can now be done in the EQuIS system itself; enhanced reporting tools; integration with additional models and analysis tools such as CARStat; and improved integration with existing models and tools.
Conclusion
While data collection is a critical step in a site characterization effort, collection alone is not sufficient. Far too often, data painstakingly obtained from field investigation, particularly geologic data, cannot be located or easily used. Such data is often hardcopy instead of electronic, and may even be stored off-site in a nearly forgotten repository. When the effort required to find and obtain data from a previous study is comparable to collecting the data in the first place, it is just as good as having no data to begin with! (Weaver 1999).
Environmental Data Management--site remediation, water quality analysis, chemical contaminant assessments, and more--is a complex process which often involves several organizations participating in data collection, assessment, and evaluation of the information. From environmental engineering companies working in the field, to analytical laboratories, to consultants that assess the laboratory results, to state and federal agencies that evaluate the data for compliance....all of these entities can, acting separately and with a lack of communication and cooperation, result in a confusing data management nightmare. Or, they can work together in an effort to standardize and implement a successful data management system.
Successful management and decision analysis requires not only the availability of spatial, chemical, and geologic data, but also an integrated environmental quality information system which allows a project manager to utilize and analyze the data. EQuIS tightly integrates data management with industry-standard visualization and analysis tools resulting in an environmental management system allowing the user to easily and efficiently investigate "What if?" scenarios. The EQuIS solution is enabling organizations like the Colorado Department of Public Health and Environment (CDPHE) to conduct a more comprehensive and effective evaluation of environmental impacts, migration pathways, fate and transport mechanisms, appropriate remediation methods, effects of remediation, and compliance.
References
Krumm, R. J. (1998) Letter to Frank Baxter at Esri-Minneapolis, dated May 18, 1998.
Thompson, C. (1999) SAMS Poster prepared for ASTSWMO Superfund Information Management Symposium, September 27-29, 1999, Tampa, Florida.
Weaver, S. D. (1999) Integration of Subsurface Data Management and GIS to Facilitate Model Calibration. In: ModelCARE 99 Proceedings (ed. By F. Stauffer, W. Kinzelbach, K. Kovar, & E. Hoehn), 775-780.
Scot D. Weaver
Desktop Applications Manager
EarthSoft, Inc.
10820 South 800 East
Paradise, UT 84328
435-245-9353
sweaver@earthsoft.com
www.earthsoft.com
Jeffrey A. Donze
Director, GIS Services
TPMC
Mills Wharf Plaza, Suite 208
Scituate, MA 02066
781-545-1524
jdonze@tpmc.com