 |
Mass Bay
Commons: Justin Grigg and Amy Cupples-Rubiano |
 |
Mass Bay
Commons: Justin Grigg and Amy Cupples-Rubiano |
|
|
|
 |
The
new explorer must not scheme, he must reveal. |
|
Abstract |
|
|
|
|
|
Blessed with a variety of extraordinary landscapes, Eastern Massachusetts is succumbing to intense development pressures. In response, students at Harvard University's Graduate School of Design teamed with the Regional Planning Authority for Boston (Metropolitan Area Planning Council) to formulate a regional open space vision. GIS technology was vital to the creation of this vision. Using GIS, Amy Cupples-Rubiano and Justin Grigg analyzed and mapped water resources, critical habitats, conservation areas, visual preferences and population growth areas of critical concern. This process was integral to the team's goals: concentrating development, preserving key habitats, and maintaining the region's quality of life. The discussion will cover the numerous challenges encountered during analysis and prioritization of data at a regional scale as well as how the GIS informed the open space vision. Software utilized included ArcInfo, ArcView GIS, and ArcView Spatial Analyst. |
|
MASS BAY COMMONS: Using ArcView GIS to Formulate A Regional Open Space Vision
|
|
|
If
growth continues at
|
Eastern Massachusetts is blessed with a variety of extraordinary natural and cultural landscapes that have made the region a quality-of-life choice for families and businesses and a magnet for tourists. But the Greater Boston region�s extraordinary New England landscapes are disappearing, an unintended consequence of late-20th-century development patterns. Low-density urban sprawl is overwhelming the beauty and integrity of villages and countryside, fragmenting wildlife habitat, destroying farm and forest and transforming indigenous scenic and historic landscapes into a featureless fabric that could be "Anywhere, USA." At the same time, though perhaps less obvious at first glance, sprawl is insidiously sapping the vitality of urban and older suburban centers.
|
|
Since World War II, despite only a 14% increase in population, sprawling suburban and exurban growth has consumed 42% of the region�s open land. i If development trends continue as expected, by 2020 much of the region�s currently "vacant" ii land could be substantially used up, including most of the prime farmland and remaining unfragmented forest. Ironically, these places would be lost despite the fact that sufficient land exists in adjoining village, town and city centers to accommodate all of the region�s development needs for the foreseeable future. Transportation and utility infrastructure already serve these adjoining lands.
|
|
|
|
In response to the above trends, students at Harvard University's Graduate School of Design, under the guidance of Robert Yaro, teamed with the Regional Planning Authority for Boston (Metropolitan Area Planning Council) to formulate an open space iii plan for the Greater Boston metropolitan region. iv The plan proposed Mass Bay Commons, a green framework for future conservation and development intended to ensure balanced settlement patterns in harmony with the region�s natural systems during the next thirty years and beyond. At the heart of the vision was a series of �regional reserves� to protect the region�s most important natural, recreational and cultural resources, including its public water supplies and groundwater reserves, rare species and wildlife habitat, farmlands and forests, ridges and seacoasts. These reserves were proposed to be connected by a network of greenways, trails and protected river corridors which provide for wildlife and serve as recreational links between protected landscapes, metropolitan parks and the major population centers. v |
|
GIS technology was vital to the creation of the Mass Bay Commons proposal. The focus of discussion here is how GIS informed the studio�s open space vision and the numerous challenges encountered during analysis and prioritization of data at a regional scale in an academic environment. vi GIS was used to analyze current and prospective land use patterns in eastern Massachusetts, resulting in a forecast of land use change following current trends through the year 2020. Water resources, critical habitats, conservation areas, visual preferences and population growth areas of critical concern were analyzed and mapped. vii The most significant intact landscapes now seriously threatened by development pressure were identified, as were those lands that might be suitable for development or revitalization. The heart of the proposal, fourteen "regional reserves" encompassing large intact natural systems, was also identified using GIS. Finally, employing a wide variety of data layers, an alternative forecast was projected, mapping key natural, recreational and cultural resources to be protected, as well as less valuable open space suitable for development. The GIS maps created through the above analysis form the core of the proposal. |
|
| AN ACADEMIC ENVIRONMENT | |
|
Before detailing the GIS analysis undertaken, it is worth acknowledging the influence of working in an academic environment. In the case of Mass Bay Commons, the academic time frame was one semester (13 weeks), thus, influencing the GIS analysis in numerous ways, the most significant being the necessity to move quickly to a clear, simple result. The influence of this necessity was felt throughout the process, with a typical example being the team�s approach to existing land use. In order to geographically define terms such as developed, the existing land use data was reclassified down to the primary three categories � developed, undeveloped, and water (Figure 1: 1971 Map). This was done to create the simplest map possible: the "traffic light" approach to existing land use with red = developed, blue = water, and green = undeveloped. A second influence of the academic environment was limited interaction with the public. Public opinion was primarily understood second hand, through open space debates occurring in the popular press, particularly those surrounding current open space initiatives in the region and nationally. As a result, the studio relied heavily on the learned perspectives of the Metropolitan Planning Area Council, community opinion experts, and extensive interaction with both academic and civic advisors. viii There is, however, a great advantage to carrying out a GIS analysis for an academic-based visioning process like Mass Bay Commons: the freedom that comes from the understanding that the vision is not hindered by the constraints of a complete knowledge of local politics or public priorities. The academic environment moderates the restrictions of political priority, economic feasibility and public approval, making it possible to weigh all the existing visionary ideas for the regions� open space system and weave them into a grand vision. The team felt it had the opportunity to propose what others outside of academia dared not. While this is not to suggest that the studio deliberately disregarded political, economic or public approval realities, the team did make a conscious decision to make the Mass Bay Commons open space vision an ambitious one. In this sense, the team hoped to turn its position in an academic environment into a strength; if from our position a grand, ambitious vision couldn�t be imagined, then could anyone imagine it? |
|
| THE GIS ANALYSIS | |
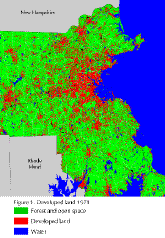 Figure 1. Developed land 1971
|
The influence of GIS on the formation of the Mass Bay Commons open space vision can be separated into two areas: (1) to quantify the intense pressure on the open spaces of eastern Massachusetts and forecast land use change following current trends through the year 2020; and, (2) the formation of an alternative regional open space vision. In order to begin to conceptualize Mass Bay Commons, the team utilized GIS land use maps to study land use patterns and changes in the developed and the undeveloped lands during the years 1971 and 1991. In 1971, the developed land area for the study region was 2,698 square kilometers. (Figure 1: 1971 Map) By 1991, the developed land area had increased to 3,649 square kilometers, a difference of 951 square kilometers, a 35% increase while the population only increased 15% and the number of households only increased 20%. This sprawling, decentralized increase in development consumed an area 7.4 times the size of the city of Boston. (Figure 2: 1991 Map) The team then projected the area of development for the year 2020 based on population and household projections for each town provided by the area�s several regional planning agencies . Locating the projected number of households within each town proved to be the most difficult GIS task of the whole analysis. The desire was to place future units within the towns in a fairly random pattern based on current trends. The solution was to convert the 1991 development map into a grid with a cell size that matched the average lot size (according to regional patterns), and convert undeveloped land to developed land using the same number of cells as there were households projected to occur in the town by 2020. Without advanced use of Avenues, the team was unable to convert a set number of randomly located, undeveloped cells to developed. Therefore the process was done manually.
|
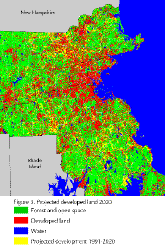 Figure 3. Projected developed land 2020 |
The results are as follows: In 1991, the developed land area in the region was 3,649 square kilometers. In 2020, the developed land area is projected to be 4,497 square kilometers; an increase of 848 square kilometers, a 23% increase while the population is projected to increase by only 8% and the number of households is projected to increase by 21%. This increase in developed land is equal to an astonishing 6.6 times the size of the city of Boston. As Figure 3 shows, the dramatic increase in the area of developed land as well as the scattered pattern of new development will fragment our ecosystems, further compromising their continued viability. With the continued scattered pattern of new development, the corridors and patches central to the fragile and unique ecosystems of the Greater Boston region are steadily being fragmented. The developed land maps illustrate an intense pressure on the open spaces of eastern Massachusetts. If the 2020 development map represents the de facto plan for the future of the open spaces of eastern Massachusetts, then the time is ripe for an alternative. In formulating this alternative the team began with an examination of the resources of the region.
|
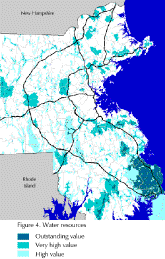 Figure 4. Water resources
|
While a wide range of attributes were examined to prioritize the region�s ecological, visual and cultural landscapes it is possible to place them in four major categories: Water Resources, Ecological Priority, Visual Preference, and Open Space Concentrations. Why did the team focus upon these four areas?
|
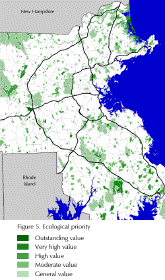 Figure 5. Areas of ecological priority
|
|
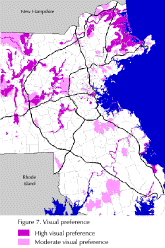 Figure 6. Visual preference
|
|
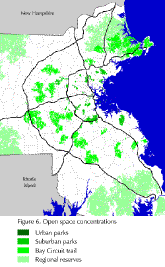 Figure 7. Areas with high concentrations of open space |
|
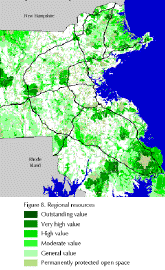 Figure 8. Regional resources
|
Following the ecological analysis, the team sought to determine where development pressures would be greatest by examining the remaining undeveloped lands in eastern Massachusetts for their development potential. The development potential of undeveloped lands was determined using land cover, protection status and proximity to transportation corridors. Transportation corridors included Interstate, US and State Highways and railroad lines. These corridors were buffered � to 2 miles depending upon the capacity of the road or rail line. Land cover data contains a number of criteria indicative of the development value of an area. For example, agricultural lands are usually open (not forested) making site preparation for development easier. In addition, agricultural lands are usually those with high levels of percolation - a characteristic that is also sought by developers as it favors septic systems. It is worth noting that the environmental factors considered were those for which GIS data was available. Certain information was unattainable, however; namely, data on the region�s soils or on lands important to migrating birds, and its absence affected the outcome of the vision. Thus far, a sieve process had been performed on all of the acquired data. The following maps are the result of the assignment of values � in the form of points � to attributes of the environment. While this process may be criticized that it is subjective, the decision to assign values was forced by the constraints of the studio � the desire to quickly move to a simple, clear, geographically specific basis for a regional open space vision. By placing values on specific environmental attributes, it is possible to condense a large diversity of data down to 4 or 5 categories. This process of overlaying different environmental qualities and attributes in order to inform future land use decisions is not new, but dates back to the early 20th century. Famous practitioners include some of the most ambitious and influential planners of their time: Charles Eliot Jr., Warren Manning and Ian McHarg, to name a few. The first value map produced was the result of the assignment of value to the four categories of environmental attributes discussed above, Water Resources, Ecological Priority, Visual Preference, and Open Space Concentrations. Through the valuing process, the criteria expressed were combined into a range of ecological value for lands in the region. Figure 8, the Regional Resources map, displays the region�s most valuable landscapes and resource systems, with the areas of highest value represented in dark green. The second value map produced is essentially the opposite of Figure 8, and resulted from the application of a development value to the development potential data using land cover, major roads and railroad lines. Through this process, Figure 9, the Development Value map, was created.
|
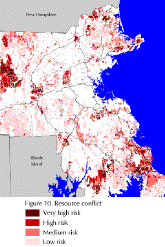 Figure 10. Resource conflict
|
The value sets represented in these two maps (Regional Resources and Development Value) were then combined to produce Figure 10, a Resource Conflict map. Areas of highest risk are those with both high value as a regional environmental resource and a high development potential. These areas should receive the highest priority for preservation. Areas of high risk in this map are those lands highly valued by both the Development Value and the Regional Resource value sets.
|
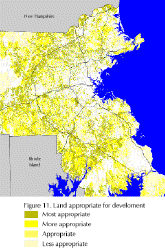 Figure 11. Land appropriate for develoment
|
The Resource Conflict map outlines the areas where development will do the most harm; however, by combining the Development Value and the Regional Resource value sets in another way it is possible to create a Land Appropriate for Development map, Figure 11. Lands appropriate for development were those areas with high development value and low regional resource value. Development of these lands would do the least harm to the region�s resources. The areas most appropriate for development are shown in dark yellow. As the map shows, the lands most suitable for development are scattered across the region. This does not mean that the team recommended a scattered pattern for development, as this would only lead to more fragmentation - fragmentation to lands less important to the region�s open space resources, but fragmentation nonetheless.
|
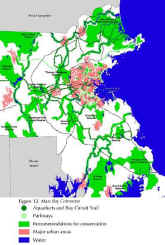 Figure 12. Mass Bay Commons
|
As the Land Appropriate for Development map shows, after all this analysis a clean, clear map to base the open space vision on still did not exist. To create this map the team returned to the Regional Resources and Resource Conflict maps, examining the areas with Outstanding and High Value and at greatest risk. The final Mass Bay Commons map, Figure 12, combines those areas with the region�s existing open space infrastructure. This map has a graphic quality, as it is intended to clarify the proposed regional reserves and their links with each other as well as with the region�s population centers.
|
| CONCLUSION | |
 |
In December 1997 the Mass Bay Commons plan was presented to a variety of open space leaders in Eastern Massachusetts, including the Massachusetts Executive Office of Environmental Affairs. In February 1998 the Mass Bay Commons proposal was printed and distributed to these same open space leaders. However, the academic process has a final effect on any visioning process: shortly after the vision is enunciated, its proponents disband. The students on the Mass Bay Commons team were all in their final academic year, therefore soon after the final vision was pulled together the team was scattered geographically, each working to solve �real� planning and open space challenges in the US and beyond. This separation of the proposal from the proposal team has a devastating effect on the longevity of the vision. But, in retrospect, the influence of the academic environment can once again be seen as a strength as much as a weakness: as the students embark on careers, the process undertaken, decisions made and lessons learned are carried forward and applied to a wide diversity of challenges in the real world. This is undoubtedly true of Mass Bay Commons. |
|
|
|
|
The Greenspace Studio Team: |
|
|
The instructors |
|
| Robert D. Yaro | Design Critic, Harvard Graduate School of Design, Executive Director, Regional Plan Association, New York |
| Andy Higuchi | Teaching Fellow, Doctor of Design |
|
The students |
|
| Amy Cupples-Rubiano | Master of Landscape Architecture, 1998 |
| Karla Ebenbach | Master of Urban Planning, 1998 |
| Justin Grigg | Master of Landscape Architecture, 1998 |
| Johanna Leibe | Master of Landscape Architecture, 1998 |
| Esther Paik | Master of Urban Planning, 1998 |
| Sissy Willis | Master of Landscape Architecture, 1998 |
| Thomas Yardley | Master of Urban Planning, 1998 |
| Metropolitan Area Planning Council | |
|
Graduate School of Design Harvard University |
|
|
Appendix: GIS Data Layers and Value Mapping
|
||||||||||||||||||||||||||||||||||||||||||||||||||||||||||||||||||||||||||||||||||||||||||||||||||||||||||||||||||||||||||||||||
|
The purpose this appendix is to explain in detail how the GIS analysis was carried out. The maps in this paper are the result of the assignment of value - in the form of points- to attributes of our environment. This appendix explains: which attributes of our environment were valued, how they were valued, and how the resulting value systems led to the maps. A greater number of points equal a greater value; land that did not have a value, according to the data layers considered, was assigned a value of zero.
|
||||||||||||||||||||||||||||||||||||||||||||||||||||||||||||||||||||||||||||||||||||||||||||||||||||||||||||||||||||||||||||||||
|
Water Resources (Figure 4) Three Mass GIS datalayers were utilized. They were valued as follows: 1. EPA Designated Sole-source Aquifers
2. Drainage Sub-basins for Surface Water Supply:
3. Aquifers for Yield:
The combination of these three datalayers resulted in a value range of 20-60 points. This was not reclassified prior to the combination of the four regional resource areas to form the Regional Resources map. Water resources were considered the most important regional resource and therefore retained their high values: 60 = Very High Value, 50 = High Value and 20 = Medium Value.
|
||||||||||||||||||||||||||||||||||||||||||||||||||||||||||||||||||||||||||||||||||||||||||||||||||||||||||||||||||||||||||||||||
|
Ecological Priority (Figure 5) Six Mass GIS datalayers were utilized. They were valued as follows: 1. Natural Heritage and Endangered Species Program (NHESP) Priority Sites of Rare Species Habitats and Exemplary Natural Communities:
2. NHESP 1997-98 Certified Vernal Pools: 15 points 3. Anadromous Fish: 15 points 4. Areas of Critical Environmental Concern: 5 points 5. NHESP Estimated Wetland Resource Habitats of State Listed Rare Wildlife: 20 points 6. Drainage Sub-basins for Outstanding Resource Waters: 10 points The combination of these six datalayers resulted in a value range of 5-75. The highest priority lands had a value of 75. This value range was reclassified down to a 10-50 point value range as follows: 50-75 = Outstanding Value, 40-45 = Very High Value, 25-35 = High Value, 15-20 = Moderate Value, 5-10 = General Value. This was done to bring the values into a better compatibility with the other three regional resource maps prior to their combination to form the Regional Resources map.
|
||||||||||||||||||||||||||||||||||||||||||||||||||||||||||||||||||||||||||||||||||||||||||||||||||||||||||||||||||||||||||||||||
|
Open Space Concentrations (Figure 6) This is a result of a simple process of selecting areas with a high percentage of undeveloped land. These areas were selected from the Forest and Open Space category created in the reclassification of the Land Use 1991 datalayer for the growth projection analysis. These selected areas fell into four "rings:" Urban parks, MDC parks, Bay Circuit Parks, and Rural Reserves. All land in these areas was assigned 20 points.
|
||||||||||||||||||||||||||||||||||||||||||||||||||||||||||||||||||||||||||||||||||||||||||||||||||||||||||||||||||||||||||||||||
|
Visual Preference (Figure 7) Two Mass GIS datalayers were utilized. They were valued as follows: 1. Drainage Sub-basins for Outstanding Resource Waters Datalayer: 5 points 2. Datalayers used for determining the Historic Districts and Historic Sites were p12_c83, p13_c83, p14_c83 and pts_c83: 15 Points Also utilized were the Landscape Inventory and the Scenic Rivers Inventory carried out by Massachusetts Department of Environmental Management. The results of these inventories were digitized and valued with 15 points. The combination of these four datalayers resulted in a value range of 5-50. This value range was reclassified into two categories: 10-50 = High Visual Preference, 5 = Moderate Visual Preference. A value of five could result if an area of land was only part of a Drainage Sub-basin for an Outstanding Resource Water. This datalayer was also utilized in the Water Resources map. Therefore, to avoid the over-valuing of this datalayer, it was assigned the relatively low value of five in this map�s value system.
|
||||||||||||||||||||||||||||||||||||||||||||||||||||||||||||||||||||||||||||||||||||||||||||||||||||||||||||||||||||||||||||||||
|
Regional Resources (Figure 8) To form this map the value systems of the above four maps were combined. This resulted in a value range of 10-135. Permanently Protected lands, taken from the Mass GIS Protected and Recreational Open Space datalayer, were subtracted out at this point. The remaining valued lands were reclassified as follows: 100-135 = Outstanding Value, 75-95 = Very High Value, 50-70 = High Value, 25-45 = Moderate Value, 10-20 = General Value.
|
||||||||||||||||||||||||||||||||||||||||||||||||||||||||||||||||||||||||||||||||||||||||||||||||||||||||||||||||||||||||||||||||
|
Development Value (Figure 9) Three Mass GIS datalayers were utilized. They were valued as follows: 1. Land Use 1991 Datalayer:
2. Protected and Recreational Open Space Datalayer:
3. Major Roads Datalayer:
Also utilized was the Railroads Datalayer from the Center for Transportation and Public Safety. It was valued as follows:
The combination of these four datalayers resulted in a value range of -100-550. Permanently protected lands were subtracted out, and the remaining value range was reclassified as follows: 450-550 = Very High Development Value, 350 = High Development Value, 300 & 400 = Moderate Development Value, 150-250 = General Development Value, -100-100 = No Data. The values with a multiple of 50 were given precedence because they were in close proximity to roads, and it was felt this proximity would greatly increase the development pressures exerted on these lands.
|
||||||||||||||||||||||||||||||||||||||||||||||||||||||||||||||||||||||||||||||||||||||||||||||||||||||||||||||||||||||||||||||||
|
Resource Conflict (Figure 10) and Land Appropriate for Development (Figure 11) These two maps are the result of the combination of the value systems from the Regional Resources map and the Development Value map. This is possible because these latter maps are essentially opposites of each other. Table C explains how this combination led to the values of the Resource Conflict map and the Land Appropriate for Development map. Each row describes, from left to right, the Regional Resource Value, the Development Value, the Resource Conflict Value and the Land Appropriate for Development Value.
|
||||||||||||||||||||||||||||||||||||||||||||||||||||||||||||||||||||||||||||||||||||||||||||||||||||||||||||||||||||||||||||||||
|
Table A. Value Methodology for Regional Resource and Development Value Maps |
||||||||||||||||||||||||||||||||||||||||||||||||||||||||||||||||||||||||||||||||||||||||||||||||||||||||||||||||||||||||||||||||
|
||||||||||||||||||||||||||||||||||||||||||||||||||||||||||||||||||||||||||||||||||||||||||||||||||||||||||||||||||||||||||||||||
|
Existing Open Space Infrastructure The infrastructure included in this map had numerous sources. The permanently protected lands are taken from the Mass GIS Protected and Recreational Open Space datalayer. The Bay Circuit was digitized from a map of the trail provided by the Bay Circuit Alliance. The MDC Parkways were selected out of the Mass GIS Major Roads datalayer. The aqueducts were taken from the Mass GIS datalayers aqueduc1.shp and aqueduc0.shp. Finally, the rivers and water bodies were selected out of the Major Streams and the Major Lakes Mass GIS datalayers. |
||||||||||||||||||||||||||||||||||||||||||||||||||||||||||||||||||||||||||||||||||||||||||||||||||||||||||||||||||||||||||||||||
| Endnotes
|
i Metro Plan 2000: The Regional Development Plan for Metropolitan Boston. Metropolitan Area Planning Council, April 1994. ii During the course of the study, the team members determined vacant lands to be lands which were as yet unbuilt with structure, parking lots, roadways or railroad lines. However, vacant lands did include all lands, whether protected or unprotected, that were not inundated with water during a part or all of the year. iii Open space is defined as lands in which development would be carefully regulated in order to preserve the cultural, recreational and ecological character of the Greater Boston region. iv In the fall of 1997, Robert Yaro, the Executive Director of the Regional Plan Association in New York City, taught a studio at Harvard�s Gradate School of Design entitled Metropolitan Boston Greenspace Plan. Participating students were Amy Cupples-Rubiano, Karla Ebenbach, Justin Grigg, Johanna Leibe, Esther Paik, Sissy Willis and Thomas Yardley. The goal of the studio was to develop an open space plan for the Greater Boston metropolitan region; the result was Mass Bay Commons. This paper consists of elements of the studio�s vision. v The structural elements of the Mass Bay Commons open space vision rely heavily on the principles of Landscape Ecology for their logic and inspiration. For a basic introduction of these principles see Landscape Ecology Principles in Landscape Architecture and Land-Use Planning. Dramstad, Wenche E., Olson, James D. and Forman, Richard T.T. Washington: Island Press, 1996. vi It must be noted that while the focus of discussion here is the GIS component of Mass Bay Commons, the proposal had numerous other, equally important, components. Historical precedents and current regional open space initiatives were researched and discussed, as were the fiscal and economic benefits of open space protection. A wide array of the open space protection and management tools and techniques available to planners and open space advocates were described. Finally, a hypothetical scenario of how these techniques could be applied to create and protect a regional reserve was included. vii The Mass Bay Commons team is indebted to Mass GIS for their provision of critical data, and to the Metropolitan Area Planning Council for sponsorship, leadership and generous technical advice. viii The influence of the academic environment on the formation of the vision was, of course, not limited to the GIS component. For example, the Mass Bay Commons vision contained a discussion of its political feasibility and economic achievability, but there were likewise affected by the lack of direct public political exposure. |
| References
|
|
General Yaro, Robert D., et. al. Mass Bay Commons. Cambridge, MA: Graduate School of Design Harvard University, 1998. History Report of the Governor�s Committee on the Needs and Uses of Open Spaces. Boston, 1929. Metro Plan 2000: The Regional Development Plan for Metropolitan Boston. Metropolitan Area Planing Council, April, 1994. Enhancing the Future of the Metropolitan Park System: Final Report and Recommendations of the Green Ribbon Commission. Boston, May 1996. Eliot, Charles William. Charles Eliot: Landscape architect, (a lover of nature and of his kind, who trained himself for a new profession, practiced it happily and through it wrought much good). Boston and New York: Houghton, Mifflin and Company, 1902. MacKaye, Benton, with an introduction by Lewis Mumford. The New Exploration: A Philosophy of Regional Planning. Urbana-Champaign: The University of Illinois Press, 1990. "General Land Statistics" in EOEA [Web](Boston [cited October 17, 1997]); available from HYPERLINK http://www.state.ma.us/envir/land.html; http://www.state.ma.us/envir/land.html; INTERNET. Economic benefits McMahon, Edward. "Stopping Sprawl by Growing Smarter" in Planners Web: Planning Commissioners Journal [Web] (cited Nov 3, 1997); available from http://plannersweb.com.articles/look26.html; INTERNET. "Sprawl Resource Guide," in Planners Web: Planning Commissioners Journal [Web] (cited Nov 11, 1997); available from http: //www.plannersweb.com/sprawl/sprawl1.html; INTERNET. Skinner, Tom. Massachusetts Open Space Protection Programs: Preserving the Future. Boston: Executive Office of Environmental Affairs, 1995. William F. Weld. Executive Order No. 385: Planning for Growth. Executive Department, State House: 1996 Open space planning Bay Area Open Space Planning Council, Building the Open Space Vision, folio, 1994. Dodson, Harry and Yaro, Robert. Massachusetts Landscape Inventory. Boston: Department of Environmental Management, 1982. Dramstad, Wenche E., Olson, James D. and Forman, Richard T.T. Landscape Ecology Principles in Landscape Architecture and Land-Use Planning. Washington: Island Press, 1996. Heacock, Craig "Creativity is Vital in Efforts to Preserve Open Space" American City and County April 1997: 60-61. Howe, Jim, McMahon, Ed and Propst, Luther Balancing Nature and Commerce in Gateway Communities Washington DC: Island Press, 1997. Rivers, Trails and Conservation Assistance. Economic Impacts of Protecting Rivers, Trails and Greenway Corridors. Washington DC : The Service, 1992. |
| Author Information
|
|
Amy Cupples-Rubiano and Justin Grigg received their Masters in Landscape Architecture from Harvard University in the Spring of 1998. For the last two years, Amy and Justin have been working as landscape planners at Wallace Robert & Todd, LLC, a national planning and design firm. A particular focus in many of their projects has been the integration of environmental planning and Geographic Information Systems.
|
|
Justin Grigg,
Planner, Masters in Landscape Architecture Pertinent Work History:
|
|
Amy Cupples-Rubiano,
Masters in Landscape Architecture Pertinent Work History: |