In this project, more than 1,000 students are testing chemical and biological water quality in the metropolitan St. Louis area and analyzing their data with ArcView GIS. Key program components for students include the development of a greater conceptual understanding of watersheds and the impact of land use decisions on the local environment. The presentation will also highlight the challenges involved in developing usable local data sets that have sufficient depth to enable thoughtful analysis and the lessons learned by project organizers about how to most effectively support participating teachers.
While there are many fine water-testing projects based in schools and in citizen-monitoring organizations, the Deer Creek Watershed Project is distinctive in its use of geographic information system (GIS) software. As the maps in this case study show, being able to visualize the data spatially is an integral part of understanding the health of the creek. Because of its unique ability to integrate data tables, graphs, and maps, GIS software enables student investigators to analyze where the data they have collected is located and to notice the relationships among factors such as water quality and land use zoning. This type of analysis which GIS software makes possible opens new doors for students in their growth toward being critical thinkers.
Now completing its first full year of operation, the project has realized several successes and learned a great deal about the challenges of integrating GIS into science inquiries. Building off of a successful pilot project which demonstrated the power of GIS-enhanced watershed investigations, the project has helped teachers to improve their water testing protocols and move from a simple "water testing project" to a broader consideration of watershed issues. Challenges to be addressed in the coming year include the complexity of the data, the lack of a meaningful spatial distribution to the 1999-2000 data set, and teachers' lack of confidence in their ability to use GIS on their own. Plans to respond to these challenges are detailed below.
As part of their fifth grade science fair project, Nate Litz and Nathan Strauss conducted an investigation of the Deer Creek watershed, an area of approximately 40 square miles which drains many of the small cities adjacent to St. Louis, Missouri. Their goal was to measure the water's health as it meandered downstream, assess changes at different points in the watershed, and to explain those changes. Clearly, this is a project where GIS software can play an invaluable role.
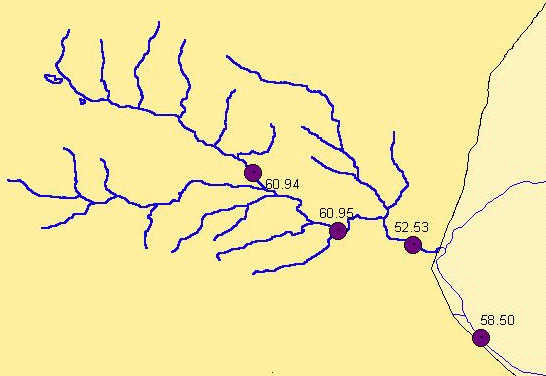
The first part of the project involved selecting testing sites. We looked for sites which were reasonably easy to get to for testing, which were evenly spaced along the creek, and which were likely to have flowing water throughout the project's four month duration. Since Deer Creek tends to dry up at times in its upstream reaches, we decided to start at about a mid-point and track the water quality from there. Three sites along Deer Creek and one site along the River des Peres were selected. The last site was chosen so that a comparison could be made between the water quality near the end of Deer Creek and the water quality of the into which it drains.
With the testing sites identified, data collection could begin. In order to track changes over time, we scheduled four test dates from November to March. To collect the data, Nate and Nathan used a variety of testing equipment, including Vernier probes and Texas Instruments' Calculator Based Laboratory (CBL) equipment, chemical test kits from LaMotte, and EasyGel coliform tests from Micrology Laboratories. A total of nine factors were measured, enabling a water quality index (WQI) to be calculated for each site on each test date. This index represents a consensus of professional opinion about what constitutes "good" water.
While there was some variation in individual factors, the overall water quality index for the sites showed a considerable drop in water quality at site #3, but the water "recovered" quite a bit after the creek drained into the River des Peres, perhaps because the pollution was dissolved into a larger amount of water.
This dramatic change in water quality raised questions about what could be causing a problem in the area. Based on their background research, Nate and Nathan knew that it could be a point-source problem (such as pollution from a sewer leak), a non-point source problem (such as bank erosion or storm runoff), or a combination of the two.
Looking at potential point source causes, the students analyzed zoning data provided by the St. Louis County Planning Office and data provided by the Missouri Department of Natural Resources listing the organizations with permits to discharge into Deer Creek and its tributaries. Four of the eight permitted sites (pink dots on the map below) were between site #2, where water quality was highest, and site #3, where it was lowest. Two of the permitted sites were directly on Deer Creek, and two were on Black Creek, a tributary which flows into Deer Creek downstream from site #2. More generally, the zoning shows a marked change from residential (yellow) to commercial and industrial (red and gray) uses downstream:
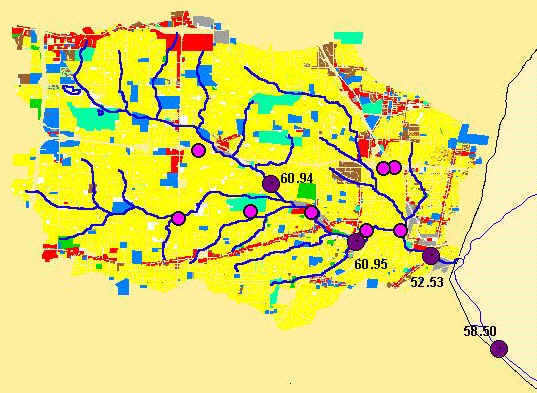
The water quality data collected and the land use map above raised the possibility that a major point-source problem could be industrial pollution. For example, the limestone quarries upstream from site #3 could account for the rise in pH and total dissolved solids, since it is quite possible that carbonate ions are part of this discharge. These two factors (pH and total dissolved solids) combined to account for 23% of the drop in the WQI.
A second point-source cause could be a sewer leak or discharge. Like many cities, St. Louis uses a combined sewer system for storm runoff and untreated sewage, which overflows into creeks during periods of heavy rainfall. The rise in fecal coliform levels suggests that this is occurring somewhere between sites #2 and #3. This in turn could be causing a chain reaction which explains the higher biochemical oxygen demand from the fecal bacteria and lower levels of dissolved oxygen in the water at site #3. Combined, these three factors (fecal coliform, biochemical oxygen demand, and dissolved oxygen) accounted for 63% of the drop in the WQI.
Non-point source pollution, such as that caused by storm runoff and bank erosion, is also a likely cause of the lower water quality. Site #3 is immediately downstream from a large shopping center parking lot. As a result, there is much more paved surface area, which will inevitably increase the runoff including sand, dirt, and oil. Adding to the problems at this site is the channeling of the stream to fit the shopping center. This has left 20 foot vertical banks of totally exposed soil, almost certainly contributing to the higher turbidity measured at this site. The rise in turbidity accounts for the remaining 14% of the decline in the WQI.
The following chart summarizes the results of Nate and Nathan's investigation into why site #3 had lower quality water:
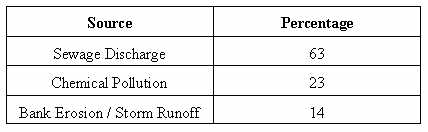
As a result of this investigation, they concluded that is very likely that the way the land is being used influences the water quality. Specifically, a combination of industrial uses of the land, the design of the region's sewer system, storm runoff, and bank erosion all contribute to the problem. Without a single, easily identifiable cause, Nate and Nathan concluded that significant improvement in the water quality will be more difficult.
In July, 1999, a group of seven teachers participated in a two week workshop on advanced water monitoring techniques and the use of GIS software to map and analyze water quality data. Three other teachers were interested in the project but had summer commitments which precluded participation in the water monitoring institute.
Two of the ten workshop days were spent in training provided by the Missouri Departments of Conservation and Natural Resources. Teachers were certified as "level 1" monitors for the Missouri Stream Team program and were provided with water test kits for temperature, ph, conductivity, nitrates, and dissolved oxygen. They were also given kick nets and related equipment for macroinvertibrate testing, and topographic maps of the watershed.
For the remaining eight days, teachers were involved in testing the chemical and biological health of the water at various points in the watershed, taking a field trip to a more rural area to provide a comparison with the suburban / urban Deer Creek Watershed, and developing their GIS skills. Esri kindly donated ArcView School and Library bundles and site licenses to the participating teachers' schools to support their continuing involvement in the program. Teachers left with a plan to implement the watershed project with their students, and to exchange data with each other through the Missouri Botanical Garden.
Over the course of the fall monitoring season (mid-September to early December), 42 test-days took place. In some cases these were isolated testing dates, while others represented one group testing in the morning and another testing the same site in the afternoon. In nearly all cases, chemical tests were done; macroinvertibrate testing took place much less regularly in response to Stream Team directives not to sample a site more than 2-4 times a year. Consequently, the data is much more complete for the chemical health of the creek.
While significant challenges were encountered (as detailed below), there have been a number of successes emerging from the project. These have been observed by program staff working in the field and at school with teachers' classes and reported by teachers in informal interviews and at a mid-year sharing session held at the Missouri Botanical Garden last December. Highlights include:
All teachers report a higher level of student engagement (self-defined) in the watershed project in comparison to previous water testing programs conducted in class.
Groups of students are meeting after school and on weekends to test water in areas distant from the school grounds.
Presentations have been made by students to their local school boards, highlighting their watershed investigations and their use of ArcView to analyze their data.
ArcView has been used for other curriculum projects. Students at the St. Joseph Institute for the Deaf (which draws students from across the United States) used ArcView to research, compare, and share with peers information about their home states.
These outcomes indicate considerable success in the first year of the Deer Creek Watershed Project. There have, however, been several challenges which need to be addressed as the project matures:
Complexity of the Data: Water testing data is fairly complex, requiring some degree of sophistication to interpret. Our experience has been that the classes which have invested the most time in teaching students about the various water quality tests, including the ecological significance of each test, procedures for conducting the test, and what a given result indicates, realized the most success with the water testing phase of the project. Their data was more reliable, and they participated in more thoughtful discussions about the data after it had been collected. Classes which tried to teach the tests the day before the field experience didn't benefit from this deeper preparation. In extreme cases, the data was disregarded because of its unreliability.
Without question, thorough preparation is an essential part of any data collection effort. The complexity of certain aspects of the water testing data makes this particularly true for this project. The tests measure factors with which many students have limited experience, which presents a formidable conceptual barrier. Further, the data from an urban creek vary considerably from day to day. Rainfall in particular has proven to cause significant variation in the test data. As a result, comparison of data from one site on a given day has limited value in comparison with data from another site on another day. The data collected in the pilot test was much more reliable in this sense, given that all four sites were sampled on the same morning for each test date.
Lack of Significant Spatial Variation in the Data: Due to transportation limitations, virtually all data has been collected at ecologically similar locations. The only readily available transportation funding aside from school funds provides for buses to the Litzsinger Road Ecology Center in suburban Ladue, Missouri. As a result, 59% of the test data is from that site; the only other site sampled with any degree of regularity was a couple of miles upstream in an ecologically similar suburban area. Together these two sites accounted for 69% of the test data. Not surprisingly, no significant variation in the data was observed. The downstream, more heavily urbanized areas which were tested in the pilot phase of the project remained largely untested. We are currently soliciting supplementary travel funding to enhance the spatial distribution of the data.
Teacher Hesitance to Use the GIS Software Independently: ArcView is more challenging than most "educational" software, and as such it requires greater effort and conceptual sophistication to learn and use. Teachers left the summer workshop as competent, but novice users of the software. In most cases, teachers did not use the software again until mid- to late-fall. Not surprisingly, their skills had eroded in that time.
Further, it became apparent quite quickly that teachers needed the creek data in a format which was ready to use "out of the box." The fall data, 42 test-days x 10 factors, was too complex for most to use. As a pilot for an upcoming summer GIS workshop, one of the teachers found that it was much easier to integrate GIS data when it arrived in a pre-coded shapefile format. Projects which seek to support teachers in their use of GIS data need to develop appropriate strategies to ensure that the data is usable by the participants.
The teachers and their students will continue to be supported in the coming school year. A follow-up workshop has been scheduled for August, at which time GIS skills will be reinforced and certain program changes will be proposed in response to the challenges encountered in the 1999-2000 school year.
Planned Test Dates: To make the data more usable, 3-4 test dates will be set ahead of time, with groups assigned to test locations throughout the watershed based on their ability to arrange transportation to the site. It is hoped that this will generate data which lends itself to spatial comparison as well as the pilot year data set. While we hope that other tests will be conducted, these will be the official test results for the project in the coming school year.
Stronger Student Preparation: The watershed project staff will also make a concerted effort to work with the teachers to ensure that the students participating in these test dates have been trained sufficiently to collect reliable data. Teachers will be asked to certify that their students are ready to contribute accurate data before participating in an official test date.
Teacher Support For GIS Use: Teachers will be provided with a simpler interface, designed to remove menu choices and buttons which are not needed to analyze the water data.
Thanks to the Litzsinger Road Ecology Foundation for primary funding, the Missouri Stream Team for training and water test kits, and Esri for ArcView donations to participating schools.
Special thanks to Nate Litz and Nathan Strauss for their work on the pilot test. Every teacher should have a chance to have students as enjoyable to work with as Nate and Nathan. I've had the privilege for four years now. Many thanks.