Where Has All the Land Gone?
Identifying Vacant Land
Abstract: This paper describes the process used at Metro to identify vacant and partially vacant land using aerial photography and vector data in ArcInfo. Smart urban growth fundamentally requires continuous monitoring of land available for future development. Land inventories in turn require accurate information about how much land is vacant, where it is located, and whether it has development potential. Metro is the regional government in the Portland, Oregon, urbanized area that provides services to 24 cities, three counties, and 1.3 million residents. A Metro mandate is to plan for managed growth while maintaining highly livable communities and preserving our unique environment.
Locating vacant land has become increasingly important to city and regional governments around the world as they work to counter the consequences of urban and suburban sprawl. The trend toward encouraging denser urban development and infill and limiting peripheral low density development have made identification of vacant land important to land developers and home builders as well.
An adequate inventory of vacant land becomes a primary decision-support tool for developing urban growth management strategies and programs. Estimates of the quantity, location and development potential of vacant land provide the supply-side input into the urban land-need equation.
Geographic Information Systems (GIS) technology enables geo-accounting, management of land information and mapping, and for many cities it is a powerful platform on which to build a vacant land inventory.
Metro, the regional government in Portland, Oregon, established a base vacant land inventory more than 10 years ago and has updated it regularly. This paper describes Metro's methodology for identifying vacant and buildable land within its Urban Growth Boundary (UGB).It is important that the definition of vacant land be clearly determined at the outset so that planners and policy makers can understand and use the data correctly and appropriately. Superficially the definition seems simple - land without development. However, because the purpose of identifying vacant land is ultimately to determine buildable land supply, describing it as land without development is an over-simplification. For example, how should parks and paved parking lots be classified? When should unused land on a partially developed lot be classified as vacant land and added to the inventory? Specific rules for determining what is vacant should be driven by the policy issues to be addressed so that the data adequately informs local decision-makers.
Methodologies for identifying vacant land range from relatively simple, cost-effective studies in small jurisdictions, to complex and resource intensive ones at the regional level. The degree of detail and precision needed for a vacant land database is determined by the purpose for which the inventory is developed.
A methodology should be designed so that:
| Table 1. Three methodologies for vacant land inventories. | |||
| UNIT OF MEASURE | METHODOLOGY | APPLICATION | |
| Level One | Study area sub-units such as census tracts, traffic analysis zones or grids. | Use multi-spectural satellite imagery and land coverage classification system to produce aggregate statistics for geographic sub-units. These units may or may not be spatially uniform. | Low level of accuracy, but suitable for general estimates of land supply. Useful where data collection resources and/or time frame are limited and where it is deemed an acceptable decision support database for addressing policy issues. The temporal database dimension using change detection enables time series land consumption analysis. |
| Level Two | Tax lots | Use county assessor's vacant land and improvement value data to identify undeveloped tax lots and estimate the amount of undeveloped land existing on partially developed lots. Update periodically using current assessor data. | Moderate level of accuracy, depending on the quality of assessor data. Less resource intensive than either of the other methods. Relies on determining a factor to estimate partially vacant lots, introducing a margin of error. The estimation process makes it difficult to add a temporal dimension to this type of database. |
| Level Three | Tax lots combined with partial taxlots. | Use aerial photography and GIS tax lot base layers to identify undeveloped and partially developed tax lots. Corroborate with assessor's vacant land and improvement value data. | Small unit of measure results in highly disaggregate database and high level of accuracy. Data can be aggregated to subunits in the GIS for extensive research and analysis. This method is resource intensive. |
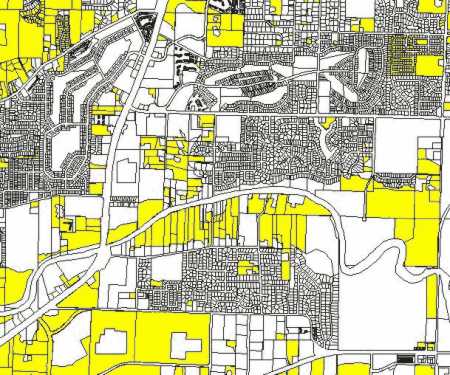
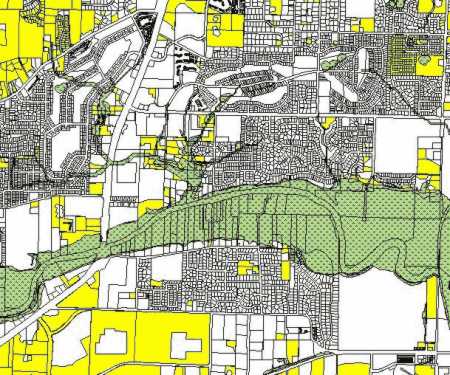
Metro serves 24 cities and the urbanized portions of three counties that make up the Portland Metropolitan area. The UGB contains approximately 365 square miles (about 236,000 acres) and around 1.3 million people. The purpose of the boundary is to promote efficient use of urban land inside while protecting valuable farm and forest land outside. A primary responsibility of Metro's Council is to manage the boundary by determining when and where to expand it. State law requires there be a 20-year land supply for projected jobs and housing needs within the UGB, and that the supply be measured every five years.
Metro's Council adopted the UGB in 1979 and the first significant expansion occurred in 1998 when 3,500 acres were annexed. Currently the Council is considering annexing another 1,800 acres.
Expanding the UGB is a highly controversial process and the Metro Council relies upon intensive examination of its land information to support its decisions. A major resource investment has been made in Metro's GIS which contains several hundred layers of land use, socioeconomic, and natural hazards data that are combined for analysis, mapping and monitoring changes over time.
The annual Buildable Land Inventory is the basis for determining land supply within the UGB, and at its core is the Vacant Land Inventory.
These rules have remained fundamentally unchanged for the 10 years that Metro has been monitoring vacant land with the GIS. The half-acre threshold for partially developed land is an unusual feature of Metro's methodology that allows for the high level of precision necessary for its land analysis. There is an important distinction between vacant land and buildable land. Metro's method considers vacant land as described above to be the basis for identifying a subset that is buildable land. The results are two separate and unique databases.
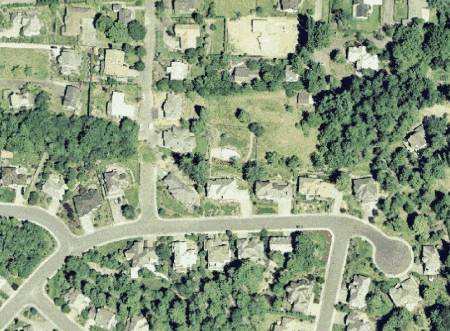
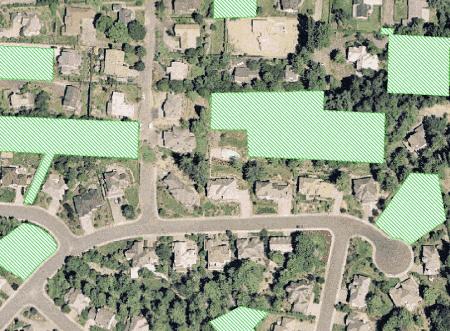
Each year Metro purchases true color digital ortho-rectified1 aerial photography for the region, specifically for the vacant land inventory. A combination of the GIS data layers and aerial photography interpretation is used to determine the location and size of vacant and partially vacant tax lots. The study requires visual inspection of the half-million lots within Metro's region. This is a resource-intensive process, typically requiring two months work by two technicians. The interpretive decisions they make are rule-based and intentionally limited in order to control any bias they might introduce. They must only determine that a tax lot is vacant or partly vacant or developed. No consideration is given at this point to suitability for building, zoning, redevelopment potential, or any other assumption. The technicians work closely together to ensure consistency of their judgment and decisions.
The inventory is an annual snapshot of the land on the date of the photography. It is not updated during the year.
Steps
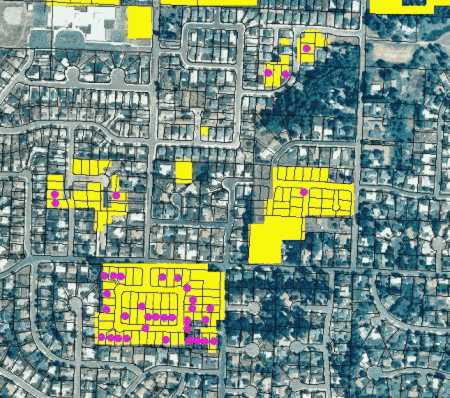
The result of this part of the project is the Gross Vacant and Developed Land database for the UGB. It is the most elemental form of the data, and it provides the raw material for subsequent land suitability and capacity analysis.
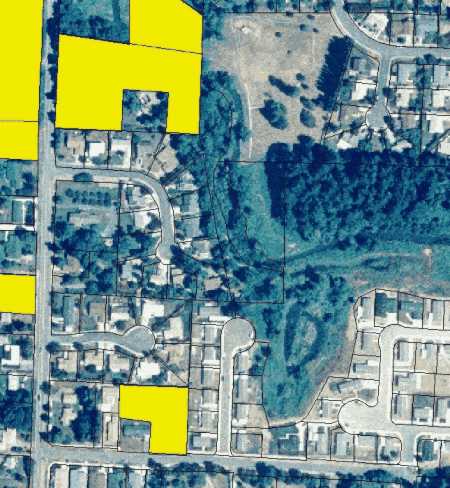
The Half-acre Rule for Partially Developed Lots
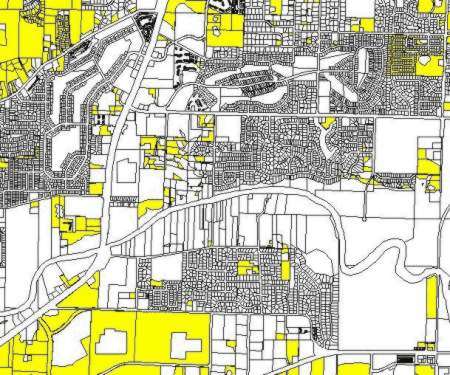
A unique feature of Metro's methodology is identification of partially developed lots as well as vacant lots. (Figure 2). Ten years ago while planning for this database, it became apparent that vacant portions of a developed lot should be counted, and the area of remaining vacant land on that lot must be limited to a minimum size. One-half acre was found to be the logical and practical minimum. Further reducing the allowable unit of measure would require increasingly subjective interpretation by the technicians, as well as delay the process unreasonably. In addition, there was a risk of producing an illusory level of precision that would undermine the integrity of the database and invite criticism of the methodology. Therefore, the half-acre rule was chosen with the acknowledgment that it would result in an under-count of vacant land. To accommodate for the under-count, we have conducted supplemental redevelopment and infill studies for residential and non-residential lots. A projected rate of "refill" development is now a factor in computing capacity. Therefore redevelopable land that is not trapped in the half-acre sieve is accounted for by the refill factor.
Building Permits
Building permits used in the vacant land study are limited to new construction over $50,000 to exclude permits for remodels and alterations. While using building permits to identify recently developed land is a very useful tool, the technician should be cautioned about possible misinterpretation. Permits are indicators, but not precise locators of newly developed lots. Ideally, a permit is geocoded (its position is located on the map) to the correct tax lot by linking it to the lot's tax account number or its address. If it is not possible to precisely associate a permit to a tax lot, the location of the permit is assigned to the segment of a street where it likely belongs. In this case, the technician must determine whether development has occurred in the vicinity of the permit.
It is not unusual to see a building permit located on a lot that is clearly undeveloped, usually because the permit was issued shortly before the photography date. In this case the lot is still considered vacant, even if it has been platted, since the inventory is based upon observed conditions on the date of photography.
Conversely a permit can be geocoded to a lot that was already considered developed. Usually this is occurs when a developed lot is partitioned or subdivided, and the permit(s) is issued to the parent tax lot's address.
While building permits are used as indicators, the technicians must visually scan all lots for new development, whether or not there is an associated permit. Demolition permits were formerly plotted on the maps as well, but they did not prove to be reliable as an indicator of new vacant land. Again, the inventory depends upon visual inspection of the lots to find land that was converted from developed to vacant.
Migrating to More Accurate GIS Data
Metro's policy is to continually update and improve the GIS data. As underlying base layers are improved the vacant land database becomes more accurate; therefore each year the data changes. Those changes can create conditions that require lot re-classification from developed to vacant or vise versa. Some examples are:
From a database administrator's point of view, GIS data should be continually evolving to higher graphic and attribute accuracy. Furthermore, Metro acknowledges that its policy decisions can be challenged if supporting GIS data is flawed or outdated. The reality is that analysis of vacant land data is complicated by the changes that result from improving the database. Therefore, assessments of rates of development over time require compensation for the changes made to the underlying data from year to year.
Technical Skill
Although the requirement for technical judgment is intentionally limited in the vacant land inventory process, we have come to the conclusion that the work needs to be done by experienced technicians. Until 1995 Metro employed temporary staff to work on the project after-hours with minimal supervision. The result was an inventory that was useful on a regional scale, but which suffered inaccuracies and inconsistencies. Beginning in 1995, it became increasingly important for Metro to measure buildable land and its rate of consumption accurately. That year the inventory became an annual exercise, and permanent highly skilled technical staff gradually replaced the temporary staff. Today, the work is done entirely with permanent, experienced staff, and although the investment in resources has increased, the reliability of the database is high.
The process described above results in an inventory of gross vacant and developed land. No assessment of suitability for development has been applied to the vacant land at this point. To determine buildable land, other GIS layers are used to identify and subtract vacant land that is considered un-buildable or constrained, following a step-wise process to:
Land with any of the constraints listed above is either considered un-buildable and subtracted from the database, or is identified for future limited capacity assignment. Land that is publicly owned is removed from the inventory, as well as land owned by religious and fraternal organizations. Land in farm tax deferral is identified and its potential for future industrial uses is being studied.
Other information is added to the resultant database so that both current land supply and capacity for further development can be assessed.
Removal of un-buildable land from the vacant land database produces the Gross Buildable Land database, which is the basis for determining what capacity currently exists for employment and housing and how much land needs to be added to the UGB in the future. Land for future need (Metro, 1997) is calculated in part by applying factors for under-build, zoning for higher densities, land for future infrastructure, infill and redevelopment, and changes in land use to conform to Metro's Region 2040 Concept Plan. (Metro, 1995.)
Data for Ancillary Studies
The debate over UGB expansion has required some specific research to support the factors Metro uses for future capacity analysis. Data in the vacant and buildable inventories has been used in several such studies:
Buildable Land and the Private Sector
In the Portland area there is interest in identifying buildable industrial land that is or will be available for development in the near future. The buildable land database does not contain information about land banking, properties for sale, or market factors that could affect a particular property. In 1999 the local development community expanded upon Metro's buildable land by isolating buildable industrial land and attaching market-related data to it. The selected properties were ranked in terms of suitability and availability for development. Metro has now incorporated that data into the GIS, and will update it annually.
Land suitable for development inside the UGB has become increasingly difficult to find prompting homebuilders, land brokers, the real estate community, title companies and others to acquire Metro's vacant land information. In some cases they have developed their own desktop GIS tools to assist in locating land within the database that meets their needs. The private sector has become a primary consumer of Metro's vacant land data, aerial photography, maps of constrained land, as well as buildable land supply and capacity analyses.
The methodology to identify buildable land (i.e., start with vacant land, take out tax exempt land, street rights-of-way, steep slopes, wetlands, riparian areas and floodplains, and land outside the UGB) has been reassessed this year. The process described above is sufficient for a single-use product (buildable land database), but it seemed advantageous to make the database more flexible so it could be used to answer a broader range of questions. For example, how much tax-exempt land is buildable? The database fails to answer that question, because tax-exempt properties were removed before buildable lands were determined.
A new buildable land database schema has been developed in the last few months that is highly disaggregate and more extendible than before. The vacant land database remains the basis for the new dataset. Some 14 GIS layers are then combined with it, but no land is subtracted during the process. The result is a very large dataset (150,000+ records) with each record representing a unique combination of the values for the 14 data layers that were combined.
| Table 2. Fields in the New Buildable Land Database | |
| FIELD NAME | DESCRIPTION |
| Tax lot id number | Uniquely dentifies tax lots |
| Vacant code | All records are vacant or "no data" |
| Amount vacant | Indicates whether the taxlot is totally or partially vacant |
| Tax exemption code | Identifies the type of tax exemption |
| Jurisdiction | Local county or city |
| Zoning | Local zoning aggregated to standard regional zones |
| UGB | Lot is inside or outside the UGB |
| Metro | Lot is inside or outside the Metro boundary |
| Title 3 | Environmentally sensitive land protected by Title 3 of Metro's Functional Plan |
| 200' Riparian buffer | Additional land that may become protected in the future |
| Slopes | Steep slopes that are not associated with Title 3 |
| Design type | Metro's Region 2040 future land use designation |
| Tax-deferred farm land | Land inside the UGB with the potential for future industrial use |
| Exception land | Land outside the UGB that is zoned to allow rural development |
| Acres | Acreage of tax lot or sub-tax lot |
A typical query of this database could be:
Find the records inside the UGB that are vacant, are not in Title 3, are in the riparian buffer, and are tax-exempt. Aggregate those records by zoning and include acreages within each zone.
The product of this query is easily obtained from the newly structured database. In addition, results of the query can be reported by any geographic unit such as traffic analysis zones, census tracts, jurisdiction, etc.
It is important to emphasize that this database is not to be reported or distributed in its disaggregate state. Observing the raw data at the sub-tax lot level would suggest that detailed, precise information exists for each specific tax lot, which is not possible given the imperfect positional accuracy of the various GIS layers. The database is intended for analysis at the regional or sub-regional level only, so that the data is always assembled into aggregate sets based upon the needs of the user.
Several basic principles for designing and conducting vacant land inventories have emerged from experience at Metro.
Vacant land data is highly perishable. If regular updates are required, an ongoing commitment of resources needs to be planned, no matter how simple or complex the procedure. Metro budgets for staff time, computer time, plotter supplies and aerial photography each year. The 1999 vacant land inventory of approximately 500,000 tax lots cost around $44,000. Such a large commitment of resources may not necessary for smaller jurisdictions or for those who need less refined data.
The vacant land inventory at Metro is indicative of the value of identifying buildable land in a region that is looking ahead and planning for smart growth.
1Ortho-rectification provides a three dimensional correction of the photography so that the photo is "draped" over the landscape, providing improved registration of the photos to the ground and to other GIS layers.
Metro, 1995, Region 2040 Growth Concept, Portland: Metro.
Metro, 1996, Growth Management Functional Plan, Title 3, Portland: Metro.
Metro, 1999, 1997 Urban Growth Report Update, Portland: Metro.
|
Author: Carol Hall, GIS Specialist Metro 600 NE Grand Ave., Portland, OR 97232 USA Phone: 503-797-1589, Fax: 503-797-1909 hallc@metro.dst.or.us |
Presented by: Alan Holsted, GIS Program Supervisor Metro 600 NE Grand Ave., Portland, OR 97232 USA Phone: 503-797-1594, Fax: 503-797-1909 holsteda@metro.dst.or.us |