
Figure 1
Erich Seamon
GIS Coordinator
Marin Municipal Water District
220 Nellen Ave.
Corte Madera, CA 94925
eseamon@marinwater.org
www.erich.cc
Abstract
Submitted Abstract: The Marin Municipal Water District, since its' inception as the oldest water utility in California (1912), has had a unique challenge of building and maintaining an extremely complex infrastructure, as well as managing the natural resources of some of the most biologically and ecologically diverse areas in North America. This paper will specifically address the technical issues involved to implement and maintain a multi-tier water utility GIS (billing, work order, SCADA, natural resources), as well as outline the pitfalls in data management, moving to a production environment, and secondary application development.
Introduction
Infrastructure and natural resource management have always been difficult
issues for agencies and the public in Marin County, California. Located
directly across the Golden Gate Bridge, north of San Francisco, Marin County
is considered by most scientists as one of the most ecologically and biologically
diverse areas in North America (Figure 1).
Unique aspects of vegetation, hydrology, and elevation make for challenging
issues regarding spatial modeling and infrastructure management.
Figure 1
The Marin Municipal Water District (hereafter referred to as MMWD) has two major areas that are supported by advanced GIS technologies. The first is the management and maintenance of 1500 miles of pipe, spread out over 50 sq. miles of southeastern Marin's topologically diverse landscape (Figure 2). Several unique aspects, which include extreme changes in elevation, infrastructure with ages in excess of 100 years, and very delicate ecosystems all add to the complexity in adequately managing these facilities.

Figure 2
The second area where GIS technologies are intrinsically used is for the management of the 20,000 acre Mt. Tamalpais Watershed (Figure 3), of which MMWD serves as the land manager. Through maintaining and managing this area and its five natural reservoirs, MMWD is able to continuously provide a high quality of water to its customers, as well as appropriately manage the lands which incorporate this valuable resource. The use of GIS for management activities such as vegetation management, fisheries monitoring, fire modeling, and soil erosion serves as useful decision making tool.

Figure 3
These two areas of GIS focus are intricately linked, both conceptually as well as physically. MMWD's 20,000 acre Mt. Tamalpais Watershed borders the urbanized eastern corridor of Marin County. It is a natural area comprising a diversity of habitats, a remarkable number of rare species, highly valued passive recreational opportunities, and the central landmark feature of Marin County - Mt. Tamalpais. It also contains a complex of chaparral, redwood forests, woodlands, and grasslands that have continued to grow fire-free for nearly 70 years. MMWD's Mt. Tamalpais watershed borders the Marin County Open Space District (an adjoining 1,150 acre preserve). The physical and conceptual connections between natural resource management and infrastructure management in Marin County can be divided into four areas:
1. The boundaries of MMWD's infrastructure overlap considerably with
the areas that are either open space, or are part of the Mt. Tamalpais
watershed (Figure 4).
2. A large majority of MMWD's water supply is derived from natural
reservoirs that lie within the managed lands. Infrastructure facilities
(pipes, treatment plants, pump stations, etc.) exist within these managed
lands as well.
3. One of the primary goals of MMWD, which is to 'supply quality water
at an equitable price', places an inherent inter-dependence between natural
resources (water supply) and infrastructure (facilitates water supply).
4. In terms of GIS, both areas have comparable data sets, a common
spatial storage mechanism, are accessed by a common interface, and combine
to provide integrated analysis solutions.
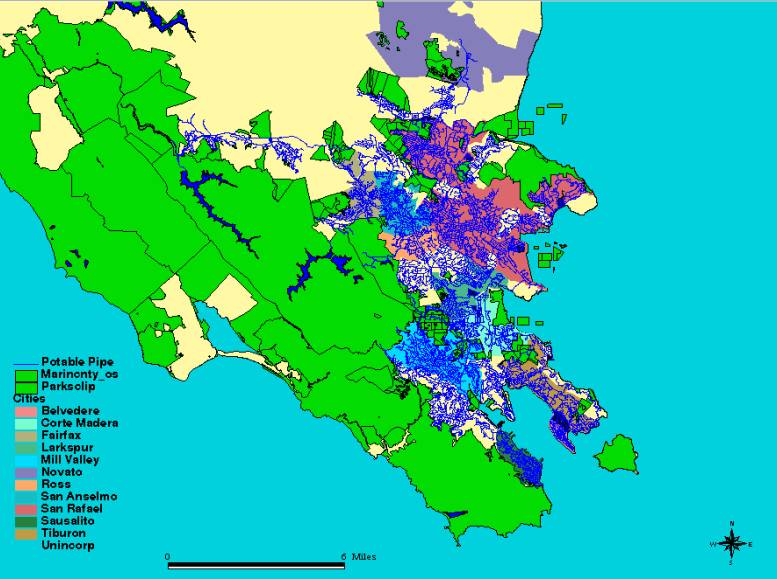
Figure 4
Purpose
The purpose of this paper is fivefold:
1. To give an overall description of the long-term approach MMWD has
used to incorporate GIS into its existing infrastructure and natural resource
programs (given above).
2. To describe in detail the applications developed to manage and maintain
both programs.
3. To describe the maintenance and update process in terms of infrastructure
management.
4. To describe how the integration of GIS at MMWD has similarly facilitated
the integration of department processes, reduced redundancy, and streamlined
business processes.
5. To show how the integration processes occurring on an agency level
at MMWD are seen on a societal level within Marin county at MarinMAP (Marin
county's data sharing consortium, of which MMWD is a founding member).
Background
Efforts to develop a long-term approach to multi-level data management began in 1992, with the creation of a planning committee for GIS activities at MMWD. Bringing together individuals from varying internal departments, along with consulting company CH2MHILL, a detailed document was created to prioritize and outline the steps needed to incorporate GIS into our business plan. The summary of that document emphasized two critical points:
1. How can we incorporate existing MMWD technology into a scalable GIS
architecture?
2. How can we utilize GIS to increase efficiency and productivity with
regards to infrastructure management?
The initial phases for MMWD's GIS development can be categorized into
three areas:
1. Data conversion
2. Adjustment and code development
3. Transitionary Implementation
A chronological flow chart describing the above can be seen in Figure
5.

Figure 5
System Architecture
MMWD's system consists of a main GIS UNIX server (SUN Enterprise 450), running 10 licenses of ARC/INFO 7.2.1, as well as 15 floating licenses of Arcview 3.2. Additionally, MMWD's GIS system is directly connected to an INFORMIX Dynamic Server (IDS 7.3), which contains all attribute information. All access to GIS applications occurs through X-emulation via individual PC's (Figure 6).

Figure 6
MMWD has several Wide Area Network (WAN) sites throughout Marin County
which additionally access GIS applications over high-speed T-1 lines.
MMWD GIS users can be divided into several different categories, each of
which have different needs (Table 1):
|
|
|
|
|
|
|
|
|
|
|
|
|
|
|
|
|
|
|
|
Table 1
Methodology
The physical database design defines the exact data elements, field definitions, and valid data values of the layers and attribute tables in MMWD's spatial database. To help ensure that database optimization proceeds in a logical manner, the goals of the database design that were followed by MMWD were:
* Application Requirements
The database must contain sufficient data and be structured to support
MMWD's applications.
* Performance
Operations performed on the database should be completed as quickly
as possible. It is clearly impossible to optimize performance of all operations.
Therefore, in practice, this goal is closely related to specific application
goals.
* Ease of Use
The design should minimize the steps required to perform database operations
and should minimize the complexity of any single step in a given operation.
* Minimize Data Redundancy
The design should strive to minimize data storage requirements among
all District departments and to limit the need to perform updates in more
than one place. This accomplished through data normalization.
* Flexibility
The design should be organized in a manner such that data required
for additional applications can be added without adversely affecting either
the original design or additional applications.
* Support for Critical Business Requirements
The design anticipates requirements unique to MMWD's business functions.
* Simplicity
The design should be kept as simple as possible.
Application Design and Development
MMWD developed a long-term relationship with Esri and Baysys Technologies Inc. (www.baysys-gis.com) of Green Bay, Wisconsin, to create a custom infrastructure maintenance application based on their present off the shelf program, Water Network Management (WNM). This process involved several phases, including code customization as well as integration with other systems. (Figure 7):

Figure 7 (Source: Baysys Technologies Inc.)
1. Examination of MMWD's present system configurations:
a. Billing: Similar to MMWD's work order system, the Billing system was created by California based Alpine Information Systems. As the oldest of MMWD's legacy systems, this application was built in Basic, and utilizes PI-OPEN as a pseudo-relational database. As expected, limited integration with GIS was developed, due to database constraints.2. Development of System Design. System design can be divided into three major areas:b. Work Order: MMWD presently uses a custom work order management system also created by Alpine Information Systems. This application, created in AccuCobol, and built on top of Informix Dynamic Server 7.3, runs in UNIX, and provides terminal-based access for MMWD employees.
a. Spatial data development. After appropriately adjusting and configuring network topology, entity relationships were created for all facility types, to create primary keys between spatial data and all legacy attribute information that exist in other systems.b. Definition of MMWD info data tables.
c. Development of code and procedures to continuously update and refine applications. MMWD worked with Baysys Technologies Inc. programmers to enhance and customize BTI's WNM product, which included:
1. Alteration of AML code to allow editing, viewing, and mapping of infrastructure information.
2. Integration of Baysys code with customized MMWD data sets (parcel/service tables, irrigation tables).
3. Progressive updating of code to incorporate new functionality (lateral additions, inset mapping).
Infrastructure Maintenance/Updating
One of the most important aspects to MMWD's GIS system was the ability to continuously update and maintain changing datasets. The most obvious of these are the infrastructure layers (distribution, recycled, abandoned, parcels). In order to efficiently implement a GIS system which would allow users to update and maintain data, application code was put in place to perform some essential functionality, as listed under the subheadings below.
Parcel/Service Relationships
An important aspect that was indicated in MMWD's GIS master plan was
the development of a firm relationship between services and the parcels
to which they feed water. As with most water utilities, MMWD has
several different relationships within the broad scope of service/parcel
connections that had to be addressed (Figure 8):

Figure 8
One service to one parcel relationship
Many services to one parcel relationships
One service to many parcels relationships
Additionally, unique aspects regarding irrigation islands (pseudo parcels) related to services, condominium common parcels, and houseboat parcels all forced unique development techniques to be established. MMWD's approach was the development of a SERVAPN.DAT file, which would house all unique service/parcel connections. This file is constantly updated as users check data in and out of the spatial library. Additionally, a unique coding scheme was created to allow the connection of services to irrigation parcels and condominium common areas.
In order to facilitate the service/irrigation/condominium parcel relationship, 'pseudo' parcels were created, which would exist where irrigation parcels or condominium common areas were located. These parcels were assigned assessor parcel numbers which contain an 'i' or a 'c', respectively, in order to distinguish them from an actual parcel. These two types of pseudo parcels were also each given a unique shape (triangle for irrigation, pentagon for condominium common area) to help to distinguish them visually.
The use of such pseudo parcels are appropriate for MMWD's design due to the infrastructure management protocol, which has been in place for many years. MMWD maintains infrastructure up to the service meter; all in-ground facilities that span from the meter to the actual building structure are considered private, and are not maintained.
With this type of protocol, the use of pseudo parcels for irrigation and condominium parcels allow MMWD to have distinguished service types without having to locate irrigation islands, or determine which private facility is servicing a unique condominium building in a common parcel.
Pipe/Facility relationships
Each facility within MMWD's infrastructure design has a unique ID, as well as a related Pipe-ID. This Pipe-ID determines which main the facility is located on. Additionally, MMWD's database design to maintain facility information utilizes a parent-child relationship between node and point-like facilities and the mains they sit upon. This aspect is extremely important with regards to tracking historical data related to infrastructure; either potable, recycled, or abandoned. Each facility not only has a parent Pipe-ID, but also is related to any main it may have been connected to in the past.
Creation of Assemblies
MMWD's process of maintaining services, fireline, and hydrants involve
the use of assemblies. An assembly for this specific purpose represents
a grouping of facilities, which typically are made up of a tap, a lateral,
and a service/fireline/hydrant. In order to assemble these facilities together
if needed in the future, an assembly_id was created. This number, based
off of the unique ID of the main facility (service/fireline/hydrant), allows
a user to select all the pieces of infrastructure for an assembly in one
easy step (Figure 9).

Figure 9
Re-Use of IDs
A unique aspect to MMWD's GIS design is the re-use of ID's for specific facility types. MMWD has three specific GIS layers as related to the infrastructure architecture: distribution, recycled and abandoned. As facilities in either the distribution or recycled layers are abandoned, they are spatially moved from their present layer to the abandoned layer. Typically, the ID for that specific abandoned facility has been relegated to the abandoned layer, and cannot be re-used in a different layer.
MMWD's approach was to essentially re-identify specified valve and hydrants right before the abandonment process. In this example, an 'A' suffix is applied to the facility ID VA-A1234, freeing up the VA-1234 ID. After abandoning this facility, the user can then re-add a valve with this particular ID. This is particularly useful for valve and valve clusters, where a main and valve are abandoned, and a new main and valve are put in adjacent to the old facilities. Field personnel are used to identifying a facility by a specified ID; this mechanism allows them to continue to do so, yet the history of both the new and old facilities are maintained.
Dropsheet Production
One of the major concerns in the implementation of a GIS system at MMWD was the ability to instantaneously reproduce system maps. Although one of the major advantages in converting all facilities information to a digital format was the ability to not have to depend upon paper maps, in some instances they serve a very important purpose. Often times, field personnel can utilize information on a paper map easier than on a computer screen.
System maps for MMWD are divided into tiles and dropsheets. Tiles consist of sixteen (16) dropsheets. Dropsheets are considered the main system map utilized by field and office personnel, mainly due to the level of detail (Figure 10). Each dropsheet contains detailed information regarding all facilities, which include:
1. Unique Ids for all facilities...which relate to complex data tables
in an external database (INFORMIX).
2. Connections between services and the parcels to which they supply
water.
3. Detailed inset maps of areas that are too complex to view at dropsheet
scale (1 inch = 85 ft).
4. Pipe diameters...shown via a coloring scheme, as well as individually
labeled.
5. Parcel lines, as well as ROW easements.
6. Road annotation.

Figure 10
Project Management & Quality control
Procedures were developed to maintain and control the infrastructure updating process. These procedures can be divided into four major areas:
1. Development of specific procedures, indicating which facilities will be updated, and when (prioritization). While developing MMWD's GIS applications to allow the updating and maintaining of data, as well as hire outside consultants to convert a static picture of our datasets over a period of three years, updates and changes to facilities were not incorporated into GIS datasets. After implementation, the two main goals with regards to updating procedures were to update all areas as soon as possible, and, while in this transitionary period, to keep tiles completely updated as they are completed. This process was put in place to prevent the previous situation (data becoming out of date) from happening again.
2. Development of procedures that will closely monitor the Quality Control (QC) process. By regulating the amounts of time staff spends on updating, examining when tiles are checked out, and implementing a multi-tiered approach to checking the accuracy of updating information (self-checking, partner review, and supervisor review), MMWD has managed to increase quality levels of GIS data to above 90%.
3. Monthly tracking of the update process, and incorporation of statistics
into quality control. By reviewing how many actual arcs, nodes, and labels
are added or updated, and determining a standard time for each individual
addition, the overall tracking of efficiency per GIS technician can be
established, and used to develop detailed quantitative data for predicting
time to completion, cost effectiveness, etc. (Figure
11).

Figure 11
4. Review of overall MMWD procedures for data consolidation and processing with regards to infrastructure implementation. One such example is the re-examination of the design/inspection/data consolidation process. Previous procedures would follow a linear progression; facilities were designed; a contract drawing would then be created. This contract drawing would be the document used by contractors and inspectors to review, alter, and update the process of installing facilities. Once the official inspector packet is complete, it would be passed to the Records department for record drawing creation, and GIS updating. The time frame between the actual installation of facilities, and the passing of the packet to the Records department for GIS updating, could take anywhere between 6 months and a year. Such a lag time between installation and GIS updating caused considerable discrepancies in maintaining accurate and up-to-date GIS information. The solution in this case was to deviate from the 'linear' process, and divide spatial data sets up into concomitant packages, which would be forwarded on to GIS technicians to update before the actual packet was complete.
Data integration between GIS, Billing and Work Order Systems
MMWD's present Information System architecture primarily consists of a terminal-based Billing System and a Work Order system. Both of these systems were developed in the late 80's-early 90's, and are based on outdated technology. Although these systems have been flagged for replacement, budgetary and procedural bottlenecks have made it very difficult. In the development of a detailed GIS implementation strategy, our goals were twofold:
1. To develop a scalable GIS architecture, which will integrate with
existing systems (Billing and Work Order).
2. Allow for a seamless integration with replacement Billing and Work
Order systems.
Natural Resource Development
The parallel development of GIS technologies for natural resource management at MMWD began in 1992. While developing a GIS master plan to address infrastructure needs (as mentioned above), the need to utilize GIS for natural resource research was additionally indicated as a primary MMWD goal. Previous MMWD operations have placed natural resource management and infrastructure management at odds with each other, mainly due to the dichotomous nature of each's responsibilities. GIS was seen as a perfect consolidation tool, at least with regards to merging data sets, to develop procedural and information systems to aid in the decision-making process.
Vegetation Management
MMWD's Mt. Tamalpais Area Vegetation Management Plan is a successful model of how water agencies can make a strong commitment to reducing fire hazard in neighboring communities, safeguarding water quality and protecting natural resources, all in an integrated approach that addresses public concerns. The implementation of the program is marked by innovative techniques and approaches, cost saving cooperation between public agencies, scientific monitoring, and public participation. The utilization of GIS is an integral part of how the VMP is managed and presented to the public. Vegetation ecologists and wildlife biologists utilize secondary applications developed in Arcview to update, analyze, and query vegetation data that is needed for specific projects. Additionally, Arcview is used to maintain and manage changes in vegetation, which have a direct impact on many other pertinent projects (fire modeling/prescribed burning, roads management, habitat monitoring).
Fisheries Monitoring
Incorporation of collected fisheries information into MMWD's GIS datasets has helped to provide analysis tools for understanding our aquatic habitat. Typical usage involves ecologists and biologists collecting field information (fish counting, pool/riffle sequence identification, erosion sites) via GPS, and incorporating into existing datasets. GIS usage in understanding the effects of sediment loading on Coho Salmon in Lagunitas Creek has been mandated, and is being used presently.
Fire Modeling
MMWD places utmost importance upon understanding how present practices effect fire performance. Prescribed burning, allocating physical resources, vegetation management, and multi-agency coordination are all important factors in controlling fire in a highly populated, yet high fuels area. The MMWD service area is once again unique, in that the combination of houses surrounded by vegetation create an ideal situation where wildfires can easily get out of control. Presently, MMWD is focusing its efforts with regards to GIS and fire on the use of FARSITE. FARSITE is a predictive wildfire application, developed by Dr. Mark A. Finney (Finney, 1994). FARSITE is a windows-based program which accepts spatial components such as vegetation type (fuels), elevation, slope, crown height and canopy cover, as well as weather averages for the regional area, to determine the speed, direction, and magnitude of a fire event. MMWD is working with other agencies within Marin County, (Marin County Fire, Marin County Open Space District) to integrate GIS applications (Arcview, ARC/INFO) with FARSITE to provide a complete fire analysis tool.
Soil Erosion/Sediment Yield/Watershed Modeling
The MMWD natural resource service area has several urban boundary and preserved watersheds that feed water into one of five major reservoirs. Watersheds serve as the primary resource for much of MMWD's services (water supply, habitat monitoring, water quality, vegetation management). As such, understanding the significance of changes in erosion and water flow help to better understand the overall effect on the above mentioned topics.
MMWD's use of GIS in watershed analysis presently focuses on several pilot areas in the service area:
1. Mill Valley watershed (Figure 12), an urban
boundary watershed, that has a drastic change in elevation, extensive vegetation,
and historical evidence of high erosion episodes.
2. Redwood watershed, a preserved watershed, with very little urban
development. Located west over Panoramic Ridge from Mill Valley watershed,
Redwood is a control group watershed for Mill Valley, to eventually be
used for soil erosion comparison and analysis.

Figure 12
Multi-Agency GIS Integration
One of the extraneous aspects of building a multi-faceted GIS system at MMWD was the developing of close ties with other surrounding governmental agencies. MMWD is a founding member of MarinMAP, a multi-agency consortium dedicated to bringing Marin County spatial information together in a central repository, over the past four years (www.marinmap.org). The budget for MarinMAP's initial implementation was funded under a Federal Geographic Data Committee (FGDC) $100,000 framework grant. Utilizing the expertise of F. Michael Smith and Associates, the creation of a web accessible data repository for sharing data was developed for 22 Marin agencies. In coordination with a related, yet separate, project to bring broadband internet/intranet access to all Marin governmental agencies and libraries, this repository additionally serves as a central mechanism to share many different facets of information instantaneously. Some examples of projects in their implementation stages are:
1. Creations of a Capital Improvement Plan (CIP) that uses GIS to help
manage improvement projects between agencies.
2. Dissemination of analysis results. One such example is the
recent study to understand why certain species of oak trees are dying off.
Utilizing GIS to examine this data will help to determine a cause, and
to inform the public on research results.
3. Parcel buffering/identification. Utilizes MapObjects via the
web to identify parcels and buffer a specified distance. This type
of functionality provides land owners a means to evaluate land surrounding
their parcel.
MarinMAP's overall goal of incorporating GIS and other spatially-related data into one repository is comparable to an organizational approach of integration. MMWD's level of integration is one portion of MarinMAP's larger-scale integration process.
Summary
MMWD's approach to developing GIS has focused on several areas:
1. Integration with existing systems (Billing, Work Order).
2. Integration of infrastructure and natural resources.
3. Developing procedures which maintain and update data.
4. Developing end user applications that allow for analysis and querying
of data.
5. Incorporating our processes/data into a societal GIS (MarinMAP).
In review, MMWD's GIS system has evolved from 1992, when hardcopy data was scanned and rectified to create an initial infrastructure base map. Simultaneously, a long-term master plan was developed to specifically lay out MMWD's approach to data design, data management, code implementation, maintenance, and data updating. Over the past eight years, MMWD has refined this master plan, as well as the processes involved, to develop a well-rounded infrastructure and natural resource GIS system. While concurrently developing both systems, it became readily apparent that each is inherently dependent upon the other. After close examination, MMWD chose to integrate in various ways (system, data, process) both infrastructure and natural resource GIS management.
MMWD's work to refine and update data continues today. Our quality control and update process closely follows the progress of infrastructure maintenance. Additional projects regarding natural resource management are being implemented, as more data is collected and categorized. Although our past efforts have been worthwhile, the need to re-examine and review our present processes is constantly needed. Our long-term GIS master plan will help to shape our changing ideas into reality.
References
Finney, M.A. and P.L. Andrews. "The FARSITE fire area simulator: fire management in US National Parks. "Proc. The International Emergency Mgt. And Engineering Conf. May 1995 Sofia Antipolis, France. pp. 183-189.
Acknowledgments
I would like to acknowledge several individuals, organizations, and companies whose efforts over the past five years have been instrumental in developing MMWD's GIS. All have contributed greatly to ensure that MMWD's GIS program has and is moving in the right direction. Esri staff Lee Johnston, Maroun Mounzer, Frank Somarriba, and Vicki Hill have been instrumental in our program development. Baysys Technologies staff Mark Rytilahti, Scott Prefontaine, and Bart Koenig have additionally provided endless hours to ensure system integrity. Finally, MMWD staff Gavin McGhie, Bob Fairchild, Jayson Yap, Mike Beaver, Pei Hu, and Charles Lam have worked for many years and provided much insight to create a complex and valuable GIS. Without their support, this program would not be the success that it is.
Author Information
Erich Seamon
GIS Coordinator
Marin Municipal Water District
220 Nellen Ave.
Corte Madera, CA 94925
(415) 945-1443
eseamon@marinwater.org
www.erich.cc