The statistical analysis of spatial data involves its exploration, visualization, and modeling. It is essentially an interactive process. To work efficiently, the spatial data analyst must use an environment integrating data storage and retrieval, cartographic rendering, data visualization, and quantitative spatial modeling. The combination of ArcView GIS, S-PLUS for ArcView GIS, and S+SpatialStats provides an integrated environment with the required tools. I will demonstrate the spatial data analysis process on a number of applications taken from the environmental sciences, resource management, the natural sciences, and epidemiology. These examples use the powerful data visualization methods of hexagonal binning and trellis graphics and the unique capabilities of an integrated software environment for spatial data analysis.
Accurate graphical rendering of cartographic data is the main goal of a Geographic Information System such as ArcView. This includes the collection, editing, storage, and display of georeferenced or "spatial" data. Spatial data analysis in the GIS context refers mostly to this set of activities and it may or may not include estimation of errors or modeling of the underlying processes generating the data. To further the accuracy and usefulness of the process of spatial data analysis, statistical summaries, and models are necessary.
Statistical Spatial Data Analysis of GIS data has generally been confined to only top-end GIS users. In this paper, I try to demonstrate that an integrated software environment that includes a powerful statistical software package extends the ability to draw accurate conclusions from spatial data to a much greater percentage of GIS users. This integrated package is available to the ArcView GIS community through an extension: the Splus for ArcView GIS extension. I will present two examples of spatial data analysis using graphical exploration via S-PLUS, ArcView and S+SpatialStats, a module for statistical spatial data analysis. These examples give us a glimpse of the possibilities to extend spatial data analysis beyond accurate mapping and into a deeper understanding of the data generating process.
S-PLUS is a state-of-the-art solution for exploratory data analysis, modeling, advanced data visualization, and statistical data mining. S-PLUS offers the most comprehensive set of robust and modern methods available anywhere. S-PLUS includes an enhanced and supported version of S, an object-oriented programming language and data analysis environment developed at AT&T Bell Laboratories (now Lucent Technologies) by Richard A. Becker, John M. Chambers, and Allan R. Wilks.
S-PLUS for ArcView GIS is an ArcView GIS extension that integrates the powerful statistics, data analysis, and presentation quality graphics capabilities of S-PLUS with ArcView GIS. The charting and statistical analysis capabilities of ArcView are therefore dramatically extended.
In addition, with the S+SpatialStats module of S-PLUS, we can get statistical inference that accounts for the spatial dependencies in the data. S+SpatialStats provides an extensive suite of tools designed for the statistical analysis of spatial data, that is of measurements or observations taken at specific locations or within specific regions. Locations may be point or areal referenced. For example, point referenced data are observations recorded at specific fixed locations and might be referenced by latitude and longitude. Areal referenced data are observations specific to a region; for example, the number of burglaries occurring in census tracts, where each census tract is a region.
In the following examples, the first spatial data set is an areal referenced data set, and the second one, point referenced. Gridded data can also be modeled using the S+SpatialStats data. The first spatial data set is considered a "lattice" data set, this term defines observations that are associated with spatial regions, where the regions can be regularly (as in a grid) or irregularly spaced, with varying distances between the region's centroids. The second example is considered an example of "geostatistical" data set, that is, it includes measurements taken at fixed locations, with locations that are spatially continuous.
Beyond the scope of this paper but worth mentioning are the extensibility capabilities of S-PLUS. It includes a programming language and thereby, provides a good environment for the development of specific user-level analysis tools. This programmatic capabilities jointly with the Avenue language of ArcView GIS hold potential for the generation of solutions to even the most complex problems in spatial data analysis.
The collection points are counties in the state of North Carolina, and the data are the rates of death from Sudden Infant Death Syndrome (SIDS) for the years 1974-1978.
The data's table contains several variables of interest aside from the SIDS rates per county. These include the number of births and the number of non-white births. Relationships between SIDS rate and non-white births are of interest in depicting a racial component to the occurrence of the disease.
A map of North Carolina in ArcView helps us cross-reference the analysis. The analysis of lattice data benefits from knowing a "neighbor" structure. This neighbor object can be computed using the S-PLUS for ArcView GIS extension and then used to estimate autocorrelation for the variable of interest, SIDS rate.
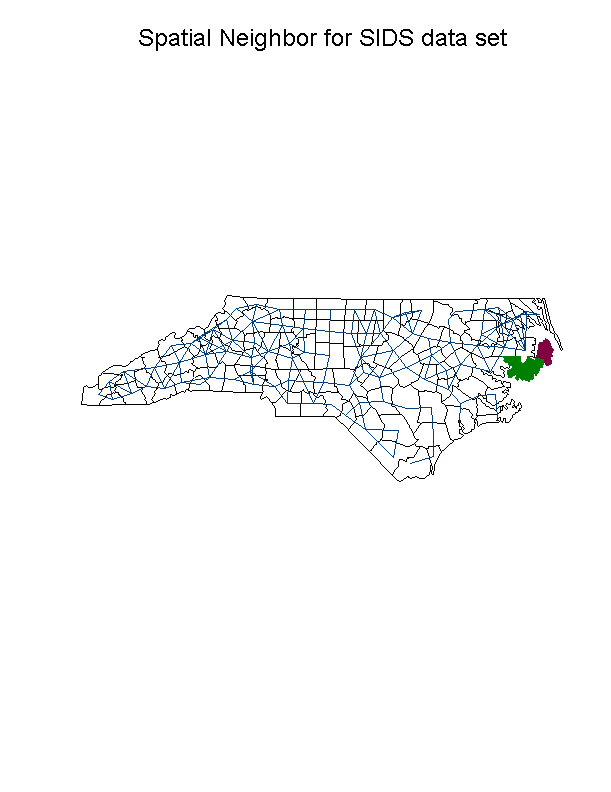
The figure above is drawn using S-PLUS to show how the neighbor object for the SIDS data looks. The two counties towards the east of the state have no neighbors according to the definition used in the analysis where neighbors were defined as those counties with seats within 30 miles of each other.
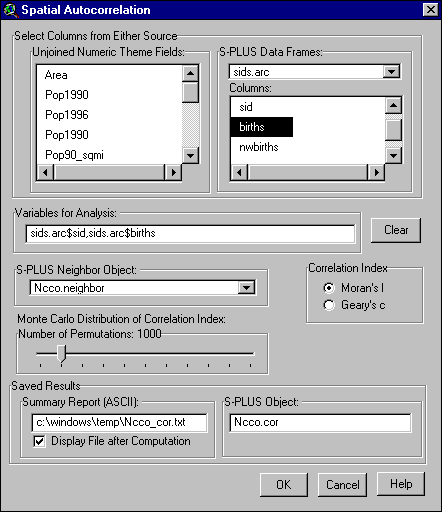
This is one of the dialogs in the S-PLUS for ArcView GIS extension that facilitates the computation of spatial autocorrelation for georeferenced data. Two indices can be computed, the Moran Index of spatial autocorrelation, and Geary's index of spatial aggregation. The input spatial data set can be either from ArcView GIS (a theme) or from S-PLUS (a data frame).
After concluding that there exists spatial autocorrelation in this data set, a spatial regression is applied where the SIDS rates are then regressed on race variables. The spatial regression methodology accounts for a covariance that does assume spatial dependencies in the data.
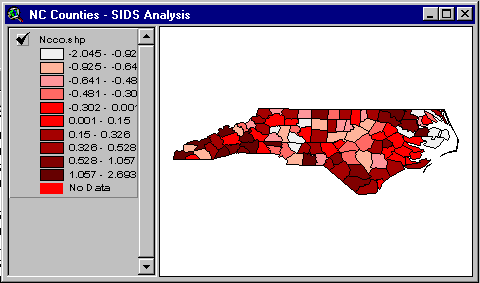
The figure above are the residuals from the spatial regression model depicted using ArcView.
SIDS rates for North carolina are spatially autocorrelated. Regressing on race variables and accounting for the spatial autocorrelation in the data shows a race effect on the incidence of SIDS.
The ArcView rainfall coverage consists of 10-year monthly mean rainfall measurements. The measurements were taken at 565 locations irregularly located over an area of 20 degrees longitude and 14 degrees latitude, in the Amazon River Basin. The data was kindly provided by the EOS-Amazon Modeling Project at the University of Washington, a NASA supported interdisciplinary science team, in support of research and development. The monthly data represents modeled output from original ground stations supplied by the Departamento Nacional de Aguas e Energia Eletrica (DNAEE) in Brazil.
Questions that one may want to ask include: 1) is the pattern of rainfall uniform throughout space; 2) do the rainfall data exhibit spatial correlation; and 3) is the spatial correlation the same for the wet and dry seasons. Modeling of the variation both in time and space can be assessed using geostatistical techniques, such as directional variograms, and kriging.
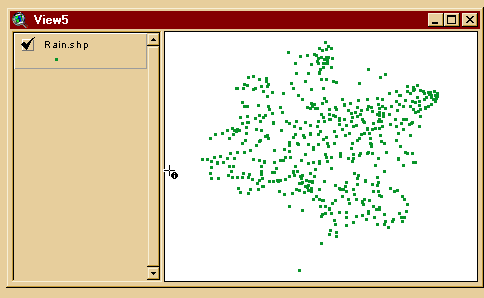
The figure above shows the locations of rain gauges through the Amazon river basin as an ArcView point coverage.
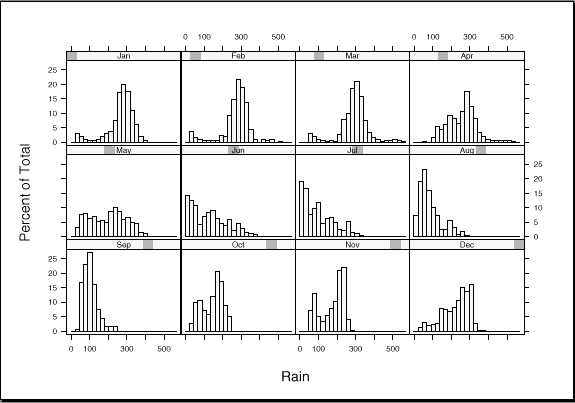
The figure above shows the variability for each month of rainfall data. We can see that the variation from month to month is significant, such as more dryer days for September while we have an accumulation of wet days in December. A variety of skewed and bimodal distributions are displayed making spatial uniformity doubtful.
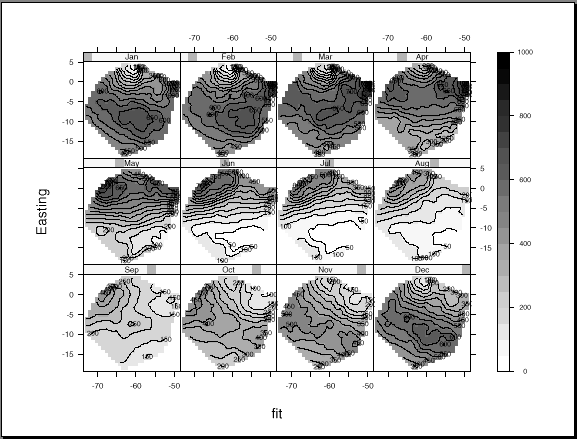
This figure depicts the kriging predictions for each month. Displayed values are actually the sums of predicted trend (fitted using a local polynomial regression surface) and the kriging predictions for its residuals. We used ordinary kriging for this data set.
The rainfall data appeared to be spatially correlated and kriging proved a useful method for obtaining rainfall predictions at unsampled locations; kriging incorporates the variogram model of spatial correlation into the estimates.
Rainfall in the Amazon River Basin varies not only temporally but spatially. Using trellis graphics for the monthly data allows us to observe seasonal variations and to model them using geostatistical techniques.
Effective spatial data analysis involves an iterative process that includes statistical tools as well as cartographic rendering. S-PLUS for ArcView GIS provides a well-integrated ensemble of software tools for statistical spatial data analysis that facilitates the process of extracting useful information from spatial data.
Kaluzny, S., Vega, S., Cardoso, T., and Shelly, A. S+SpatialStats User's Manual for Windows and UNIX, Springer Verlag, 1998.
Thanks to Stephen Kaluzny, and Tamre Cardoso for their various analyses of the data presented herein. Miles Logsdon provided the monthly rainfall data.