Prepared by: Michael A. Downs, Ph.D. and Eric Coughlin
KEA Environmental, Inc., San Diego, California
Using Commercial Fisheries and Marine Environmental Data in
Assessing the Differential Distribution of Social Impacts of
Marine Conservation and Development
Abstract: Marine conservation district planning in the
U.S. Virgin Islands has provided an example of utilizing
spatial data for the analysis of the differential distribution
of social impacts resulting from establishing offshore conservation
areas. The paper presents the lessons learned from that exercise,
and then focuses on ongoing analysis of commercial fisheries and
related socioeconomic impacts of development on California's
continental shelf. Data regarding bathymetry, habitat, gear types,
and harvest are integrated with data on the structure of various
sectors of the fishery to facilitate an analysis of the magnitude,
nature, and distribution of socioeconomic impacts resulting from
offshore development.
Overview
This paper examines the role of the use of geographic information
in anticipating social impacts associated with fisheries management.
Two case studies are chosen: one that focuses on resource protection
planning and another that focuses on subsea development. The former
is set in the United States Virgin Islands, while the latter involves
Southern California coastal waters.
Case Study #1: Marine Conservation District Planning
in the United States Virgin Islands
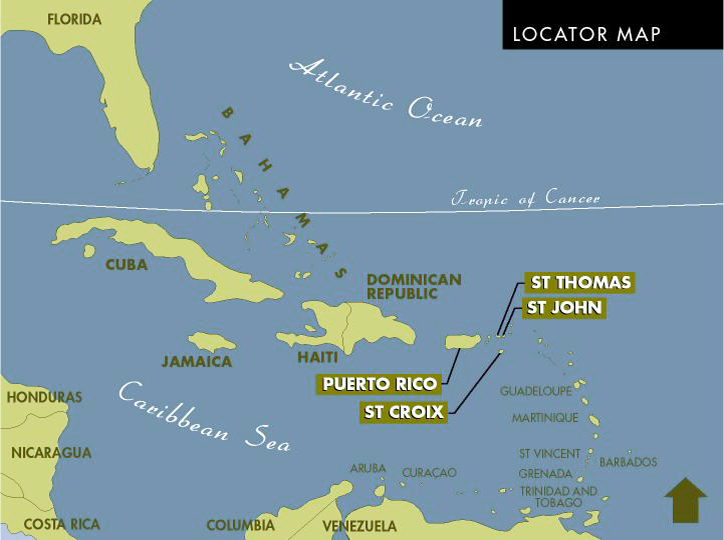
The establishment of a Marine Conservation District (MCD) in
waters off the United States Virgin Islands (USVI) involved the
type of social analysis utilized in the fishery management
decision-making process, and provides a good example of the
importance of spatial data to fisheries social impact assessment.
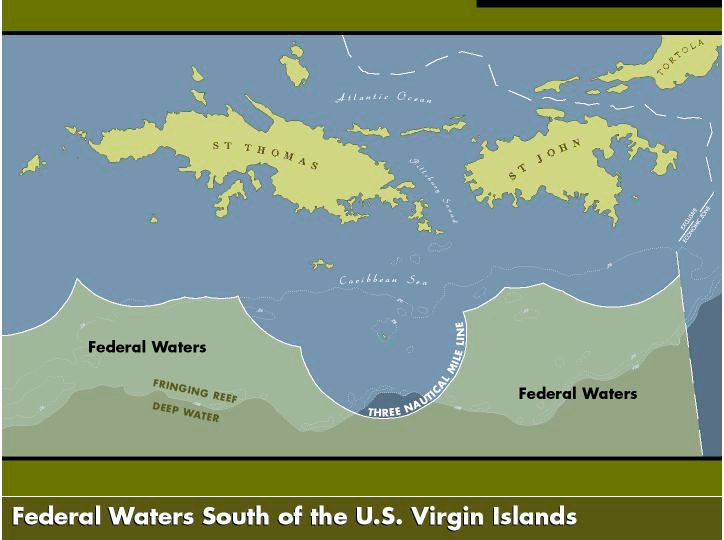
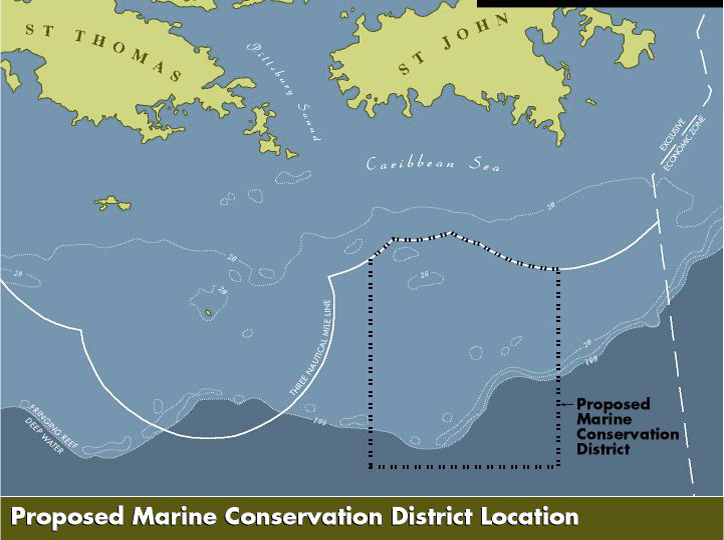
As part of the Coral Reef Fishery Management Plan prepared by the
Caribbean Fishery Management Council (CFMC), an MCD was proposed
for a portion of the federal waters immediately south of the
island of St. John in the USVI.
Specific alternatives for an MCD were formulated and discussed
at a series of public meetings in late 1993 and early 1994. The
alternatives varied in the specific geographic area they encompassed,
as well as in the types of resource management or access restrictions
that could be used to help conserve the resources in the area.
It became clear from the input received at the public meetings
that there was strong opposition to the creation of the MCD. Less
clear, however, was how representative this opposition was of the
opinions of the current users of the area, and the specific issues
that were driving the opposition. Given that cooperation of local
area users is essential to the success of an MCD, it was necessary
to understand the overall cultural, social, and economic context of
local use. The CFMC decided to contract for a Rapid Socioeconomic
Evaluation (RSE) to arrive at an understanding of the existing context
and the nature and distribution of potential socioeconomic impacts.
The RSE was conducted in the winter of 1996-1997. Its objectives
were to: (1) identify proposed MCD area users; (2) characterize patterns
of use; (3) identify and analyze concerns about the potential MCD; (4) develop
summary profiles of potentially affected areas; (5) develop user group
profiles; (6) identify information gaps and recommend work to address these
gaps; and (7) develop an ongoing collaborative relationship with potential
MCD area user groups. The portions of the study highlighted in this paper
concern the differential geographic distribution of social impacts uncovered
by the study.
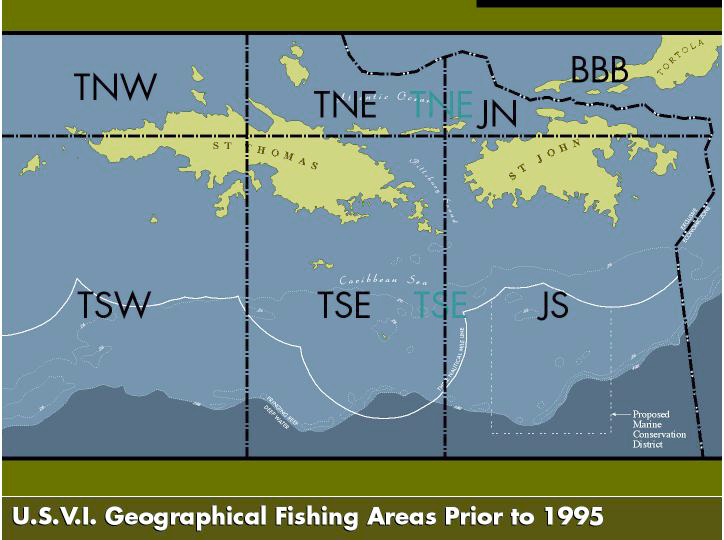
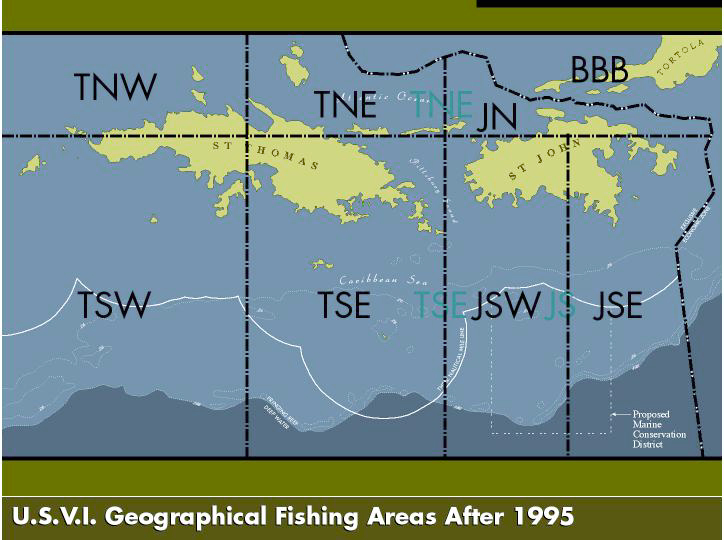
The evaluation relied to a large degree on direct interviews with
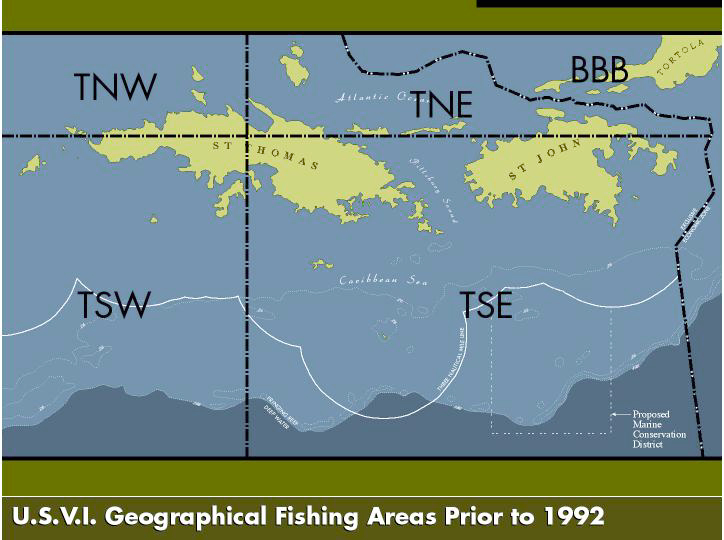
area users. Existing landings data were of limited use due to known
shortcomings in area-specific statistics for the proposed MCD area.
Problems with the data included the fact that the geographic units of
data collection and analysis had changed three times since 1992, and
ranged from lumping vast areas outside the proposed MCD with the
proposed MCD area, to bifurcating the proposed MCD.
To partially make up for the shortcomings of existing secondary
data, intensive key person interviews with fishery participants
were utilized. The interview sampling frame was constructed by
moving outward from known area users through a snowball sampling
method. One of the primary challenges to the field research was
that this had already become a highly politicized issue.
In large part, the goal of the RSE was to characterize current
use patterns of the proposed MCD area by sector in order to provide
data for analysis of potential social and economic impacts. The main
sectors were (1) St. Thomas commercial fishers, (2) St. John
commercial fishers, and (3) sport charter boat operations. These
sectors varied considerably in their use of the area as well as in
their internal composition. Further, the potential differential
geographic distribution of impacts likely from the creation of the
proposed MCD varied widely from sector to sector. Potential cultural,
social, and economic impacts were distributed differentially by island,
specific sub-island areas, vessel length, gear type, and ethnicity.
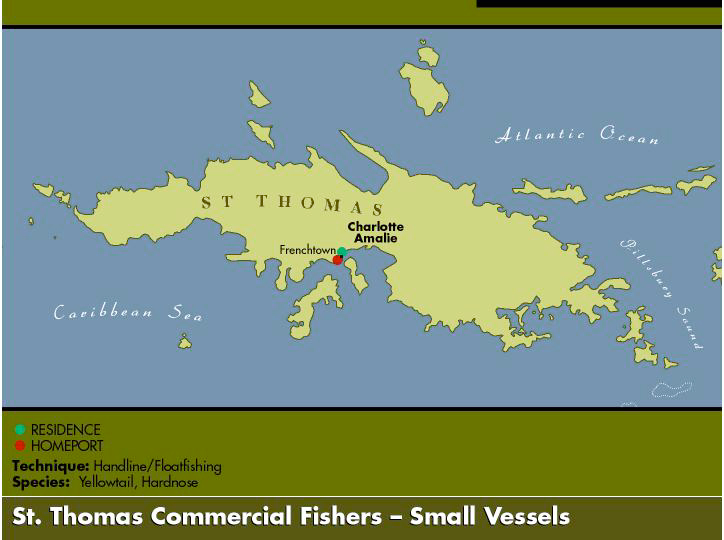
St. Thomas commercial fishers were among the heaviest current users of the proposed MCD area, and specifically, they were the group that most intensively uses the area for trap fishing. Use of the area was distributed by the "home port" location and the size of the vessel. Their small vessels included locally built open-skiff-type wooden boats, many of which were in the 16- to 19-foot range; boats around 22 feet that had at least partial cabins and a few that were in the 28- to 30-foot range were considered intermediate operations; and large vessels were typically those that were 30 feet and up. (The largest boat in the fleet was 42 feet). None of the St. Thomas commercial fishers interviewed used, or knew of individuals who used, small boats for fish trapping or lobster trapping in the area of the proposed MCD. Small vessels were, however, reported to use handline or floatfishing techniques in the area, and all of these were from St. Thomas' "southside."
All of the large vessels from St. Thomas that fish the proposed MCD used power winches to pull strings of pots. These operations were among the largest in the USVI commercial fleet (with, perhaps, a half dozen boats working several hundred traps each). St. Thomas fishers market their product in several different ways, including sale to the public at fixed market locations such as the haul-out ramp in Frenchtown and the stadium area in Charlotte Amalie, sales from the backs of trucks at known locations, sales to restaurants and hotels, and sales to residential customers. Depending on the amount of investment, in capital and in effort, commercial fishing can be a lucrative business on St. Thomas.
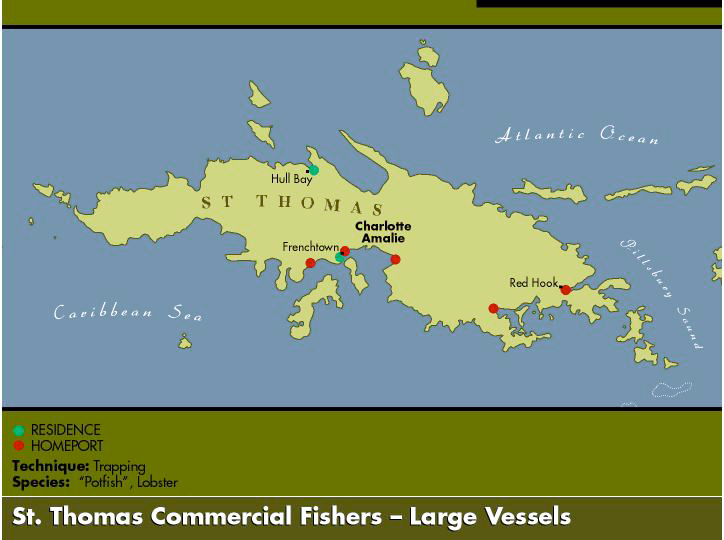
The predominant ethnic group engaged in commercial fishing on St. Thomas are people of French descent. At present, fishing effort in the proposed MCD is dominated by individuals living in the "northside" area around Hull Bay and in Frenchtown ("southside"). Both of these areas are considered to be traditional fishing communities of St. Thomas. Of the commercial fishers interviewed who were potential MCD area users, all but two were of French descent, with the remaining two being West Indian.
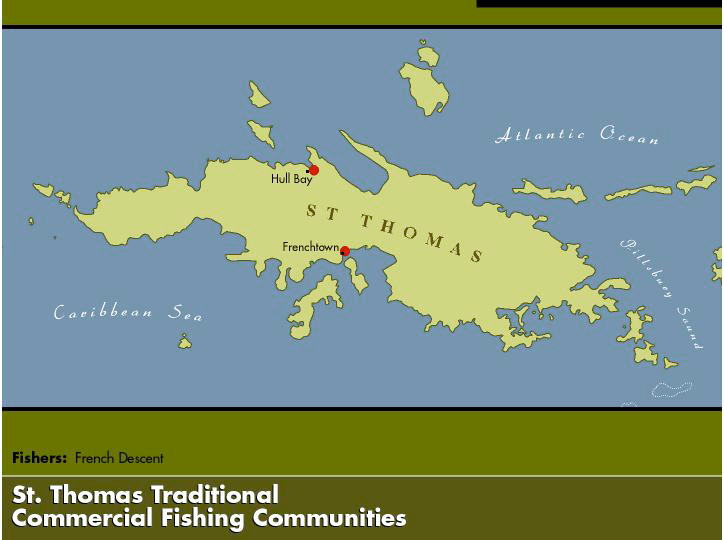
In summary then, the study found a bimodal distribution of vessel size for St. Thomas, with the largest and the smallest vessels in the fleet participating in the fishery in the area of the proposed MCD, with differences in gear type and species fished between the two sectors. These differences carried over into a differential geographic distribution of potential impacts based on residence, home port, and ethnicity.
The RSE found, for St. John, the fishery was quite different and more artisanal in nature. For the most part, the income derived from fishing was necessary to make ends meet for the fishers as other employment is often insufficient to support their families. Some provide fish to their family and friends. Others sold a portion of their catch to defray fishing expenses. The two main clusters of fishers were in Cruz Bay at the west end of St. John and Coral Bay at the east end.
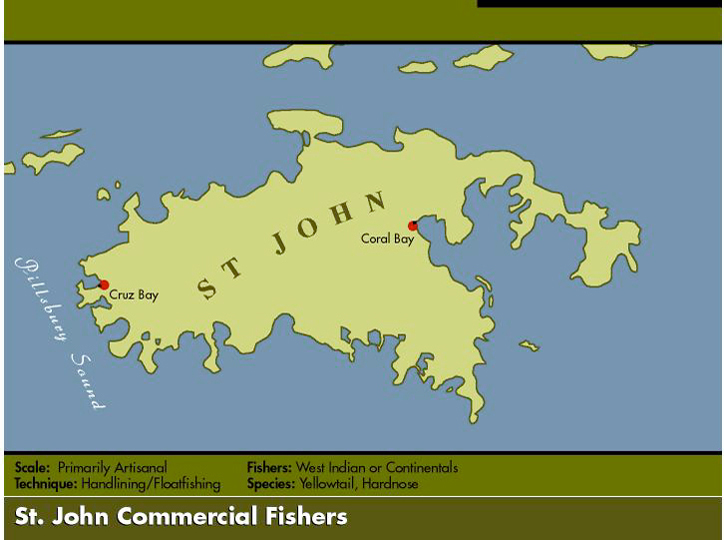
The market in fish were sold on St. John to walk up consumers and to restaurants, hotels, and residential customers. There appeared to be only two fishing operations from St. John that use the MCD area on a steady basis, with a number of others using the area intermittently. Only one St. John fisher stated that they used the proposed MCD area for trap fishing (and longlining). Other individuals reported that they used the proposed MCD area for handlining and they stated that it was one of the most productive areas for yellowtail and hardnose.
Two ethnic groups pursued commercial fishing on St John: West Indians, whose families may have been on the island for generations, and "continentals" (mainlanders), who are more likely to be recent arrivals. West Indians were the larger of the two groups. Continentals tended to focus on trolling and other sport fishing techniques, while West Indians tended to focus on trap fishing or handlining/floatfishing techniques. Continentals primarily targeted pelagic �sport' species, while West Indians tended to focus on �pot fish' or �plate fish' with handlining focusing primarily on hardnose and yellowtail. There is nearly an equal split in MCD area effort between West Indians and continentals, and locations of potentially impacted operations were split between Cruz Bay and Coral Bay.
In summary then, the commercial fishery in St. John varies dramatically from that of St. Thomas, although both utilized the same proposed MCD. The potential distribution of impacts on St. John, unlike St. Thomas, has a common geography for the factors of vessel size, home port, and residence. The sociocultural/ethnic divide among the participants in the commercial fishery from the two islands is also much more sharply drawn than for the population of the islands as a whole.
As for the charter fishing sector, a total of 10 businesses were identified in St. Thomas and St. John. The captains of all vessels were interviewed. Two operations had vessels based on St. John (in Cruz Bay) and eight were based on St. Thomas (in or near Redhook, at the east end of the island).
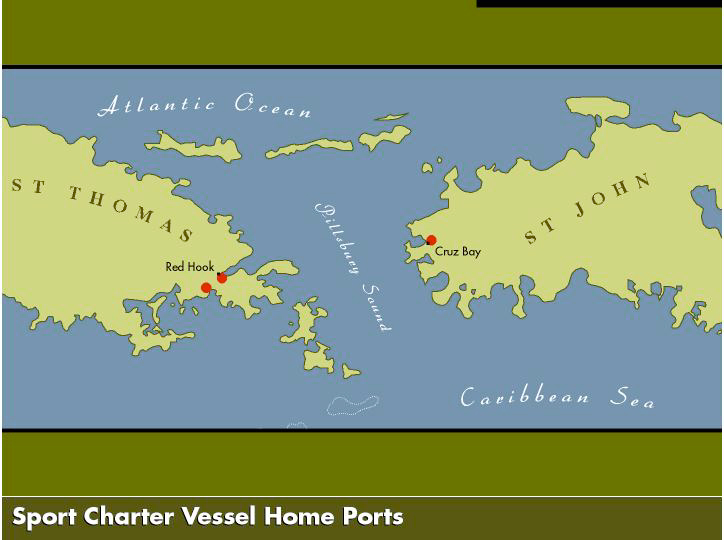
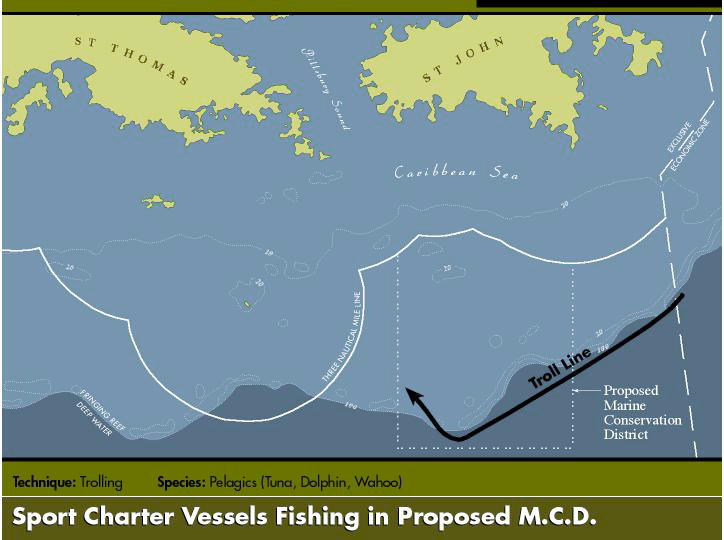
Most, if not all, sport charter vessels derived income from (a) taking charter customers out fishing and (b) selling fish. The relative importance of these two activities varied widely by vessel. For a portion of the year, the proposed MCD was used on a regular basis by all of the sport charter fleet (depending on weather conditions). The species targeted by the sport charter fishing fleet varied by the time of the year, and the preferences of the customers. For those vessels that commercially fished, the target species were tuna, wahoo, and dolphin.
Sport charter fishing was not viewed as a traditional activity or part of a cultural heritage in the same way as was, at least some of, the small-scale commercial fishing. In ethnic terms, of the 10 identified captains, seven were continentals, two were West Indians, and one was from elsewhere in the Caribbean. In terms of ownership patterns, all of the vessels were apparently owner operated, except for the two vessels captained by West Indians. In geographic terms, this sector is markedly different from either the St. Thomas or St. John commercial fishers as it is a relatively homogeneous group with respect to vessel size and gear/technique spread between two islands.
Data collection was conducted to obtain information on other potential MCD area uses, including dive operations, recreational fishers, and charter yachts. The potential impacts to these sectors do not appear to be significant. Interviews were also conducted with researchers/scientists, resource managers, environmental organizations, and other attentive organizations in order to characterize other stakeholders with an interest in MCD issues.
A range of proposed fishing restrictions were contemplated for the proposed MCD. These included designating the area as a no take zone, a no anchor zone, a no trapping zone, and various combinations of management restrictions. Depending on what type of management action was taken, the impacts of the actions would be differentially distributed by vessel size, gear type, home port, community of residence, community of market, and ethnicity � all of which have geospatial components.
When looked at on a sector specific basis, the RSE found that primary opposition to the proposed MCD area came from a subset of commercial fishers on both St. Thomas and St. John. The proposed MCD was (at its most restrictive) an area-based conservation measure rather than a vessel or gear-based measure. St. Thomas trap fishers in particular viewed it as a productive area, particularly for lobsters, as well as particular species of fish, which made it difficult to accept that this was an appropriate area for closure. That is, a number of fishers asked why areas that were already damaged were not being set aside for restoration if there had to be closures at all. The fact that the proposed MCD was not directed toward the conservation of any particular species was problematic, i.e., the commercial fishing community did not perceive that species currently "in trouble" would be restored by the closure, which had been the reason for previous area closures. Neither were they convinced that commercial fishing in adjacent areas would improve over the long run by resources "leaking" from the MCD area. For St. John fishers, handlining/floatfishing was not seen as having an adverse impact on the reef system, and the benefits of the closure were viewed as marginal at best in relation to potential impacts. Opposition also came from sport charter vessel owners who did not understand how trolling the edge of the dropoff in the area for pelagic species, considered essential to their operations, could negatively impact the coral reef systems that were the focus of the FMP.
After the RSE was completed, the CFMC again took the MCD proposal to public hearings. The CFMC then decided to adopt a recommendation provided by fishers and other user groups at these hearings. The MCD location was moved from the first preferred alternative site (considered burdensome by the majority of the user groups) to another that could accommodate the concerns of all parties involved while meeting the FMP conservation objectives.
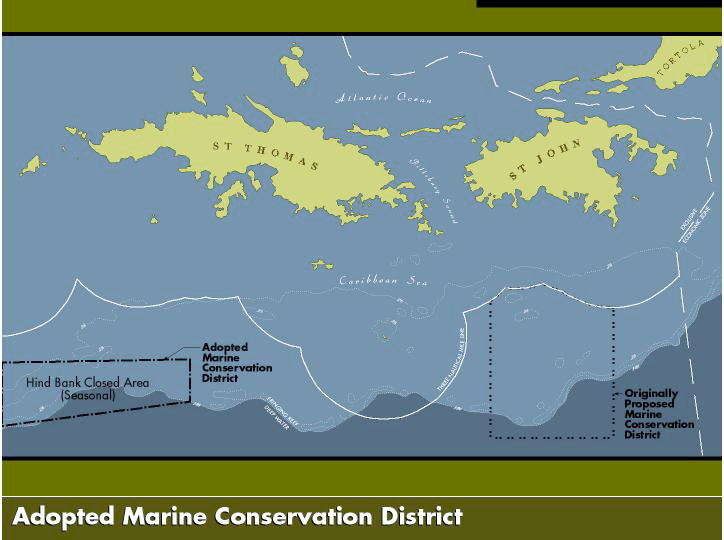
This new site was already closed three months out of the fishing year, so the impact of closing it for the additional nine months was not considered too onerous by most fishers. Additionally, choice of this area narrowed the user groups to the larger St. Thomas commercial fishing vessels, and concentrated the potential social impacts to much smaller geographies than was the case for the originally proposed district.
This case study provides a good illustration of how understanding the geographic dimensions of a number of different sector/social factors can illuminate the potential differential distribution of social impacts from management changes in a single geography. Depending on the specific management action taken, impacts will reverberate through the social structure of the fishery in dramatically different ways, and will involve a range of different communities and social groups.
Case Study #2: Underwater Fiber Optic Cables in Southern California
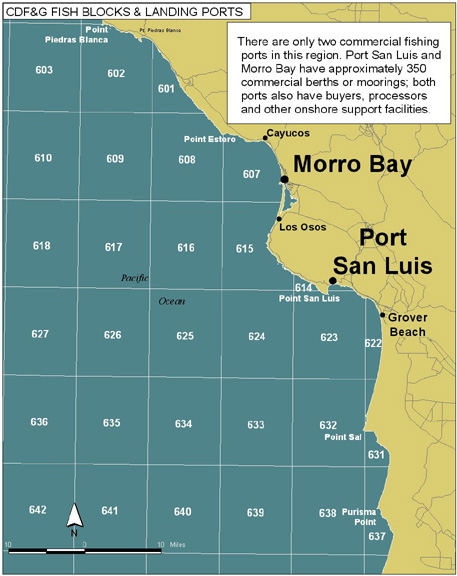
The second case study in the use of geographic data for the assessment of potential social impacts to fisheries is quite different from the first. Rather than setting aside portions of the ocean ecosystem as a conservation district, this case involves potential conflicts between existing fisheries and the use of the seafloor in the same area for the installation of underwater fiber optic cables. The setting for this case study is the Morro Bay to Grover City area of the California coast.
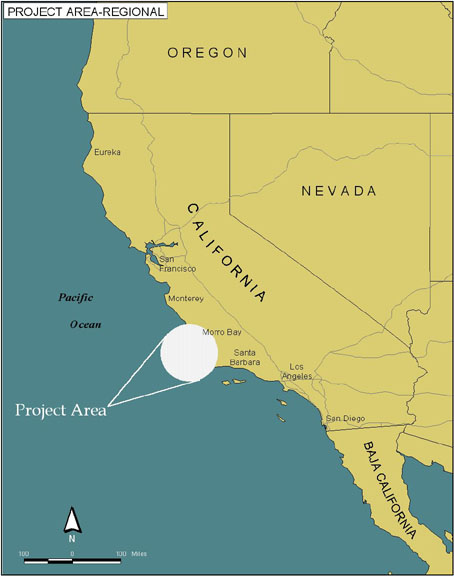
Source: Esri.
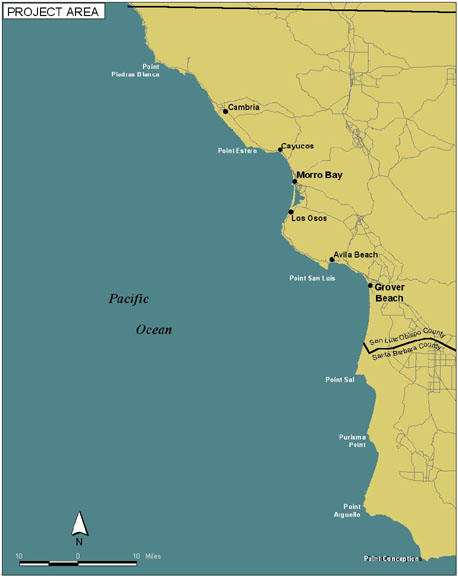
Source: Esri.
The key to assessing potential impacts to fisheries from subsea cables is understanding the nature and geography of the potential conflict. The next step is then to attempt to quantify the potential impacts to fisheries, and this is where GIS is able to play a prominent role in helping to analyze the magnitude and distribution of potential impacts.
One of the first issues is to address concerns in the form of the fisheries data themselves. Harvest data for California commercial fisheries are assigned to "fish blocks" which are units that are approximately 10 minutes of longitude by 10 minutes of latitude in the open ocean, and smaller where a portion of the coast or islands intersect the grid.
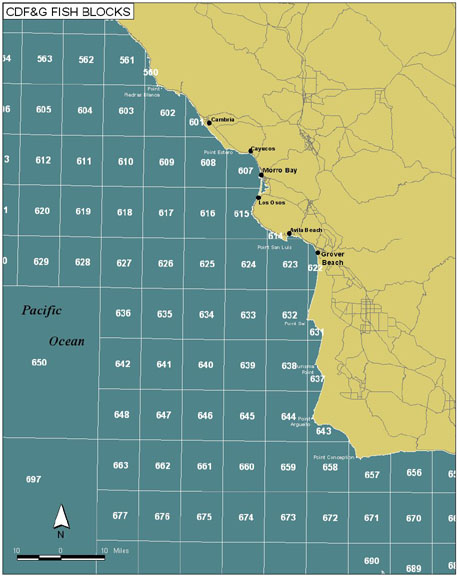
Source: Esri; PSMFC.
While harvest data are recorded by fish block, landings data are recorded by port. Data for volume and value of landings by species are available by port (although confidentiality restrictions prohibit the release of data where too few participants have reported landings to allow sufficient data aggregation to maintain the confidential data regarding the details of individual operations).
Source: Esri; PSMFC.
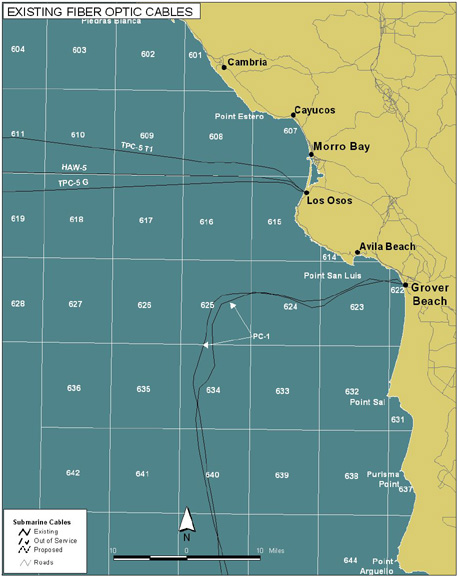
The study area is one where there are existing landfalls of underwater fiber optic cables. Fiber optic cables serve the coastal and trans-Pacific market, and represent a particularly fast growing component of the increasing domestic and international communication demand.
Source: Esri; PSMFC; SAIC.
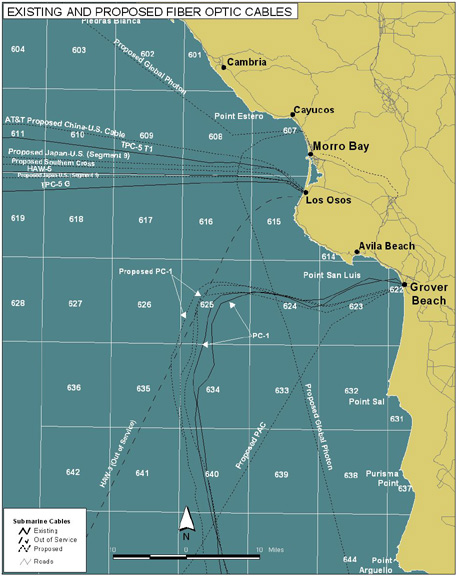
Evidence of this growing demand may be seen in the number of trans-Pacific fiber optic cable landings proposed for this part of the California coast. With this growth comes additional potential for conflict with area fisheries.
Source: Esri; PSMFC; SAIC.
Quantifying the potential for conflict, however, is not a straightforward task. Simply intersecting the harvest data with the cable route to come up with a measure of potential harvest impact does not necessarily produce satisfactory results, for several reasons:
Fish blocks are relatively large � the cable may only transit a small corner of the block, or it may cross
the entire block, but data are not available for smaller geographies.
The cable may run very close to the edge of a block, so it may impact fishing in adjacent blocks.
Fishing effort is not uniformly distributed within blocks � the cable may transit a portion of a
block where either intensive fishing occurs or where virtually no fishing occurs.
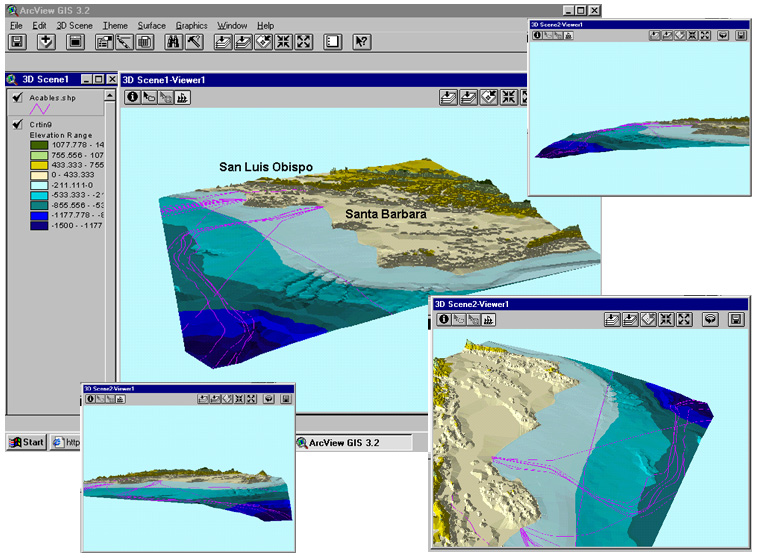
To address these and similar analytic concerns, additional data layers must be added that more closely show seafloor features, target species habitat type, and fishing effort areas. The first of these layers is simple bathymetry. Different commercially important species are found within reasonably well defined depth ranges.
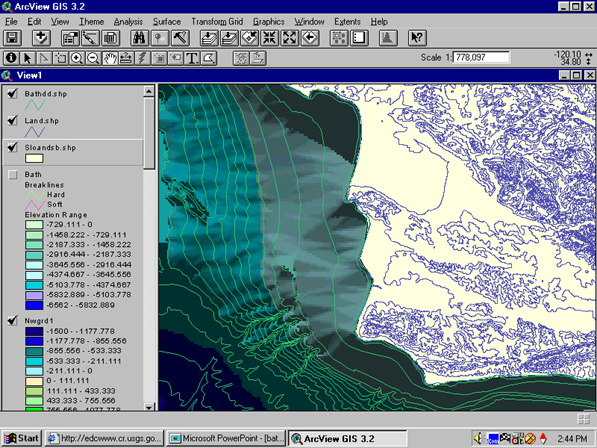
Adding the cables to the bathymetric data, the first step may be taken to highlight potential areas of gear conflict.
Looking at species data is more problematic. In our research we found that geographic distribution maps for individual species or species groups are often not available. The following map shows flatfish species distribution data that was developed in the 1970s for the Minerals Management Service (MMS) for the area. These are apparently the best available data of this type, and while useful, they do not allow calculations of impact for logical units of the fishery or specific target areas.
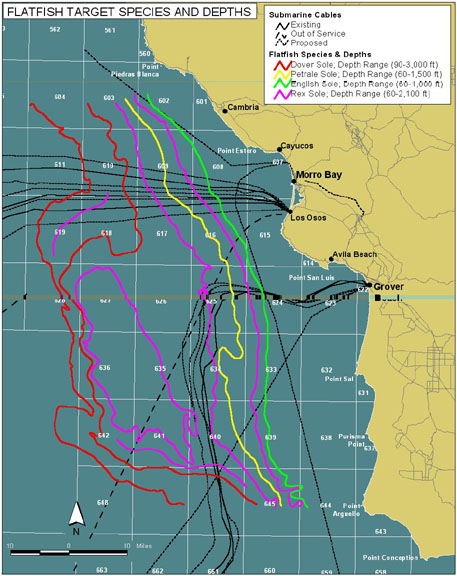
Source: Esri; PSMFC; SAIC; MMS.
Data that are more useful for this type of analysis show specific areas of concentration of fishing effort. That is, fishing effort is not randomly distributed throughout the target species range, and whether or not the cable intersects area of intense effort will in part determine the form and magnitude of the impact. For example, the following map, based on data developed for MMS through the use of interviews with fishing operations in the 1970s, shows sportfishing target areas within the study region as sorted by vessel type (skiffs [i.e., small privately owned vessels] versus �party boats' [i.e. commercial sportfishing operations]) as well as recreational salmon grounds differentiated by �general' and �prime' designations. All of these sportfishing areas are concentrated relatively close to and along the shore, such that the long axis of the fishing effort polygon is not typically aligned with the direction of the cable(s), which tend to be perpendicular to the coast close to the shore, such that relatively minor portions of any one target area is directly impacted. For small target areas, however, there may be preclusion issues. As shown, an area of party boat effort in blocks 607-615 is particularly densely transited by existing or proposed cables.
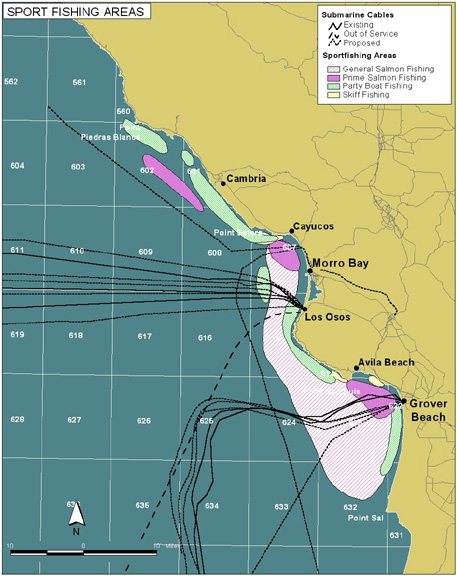
Source: Esri; PSMFC; SAIC; BLM.
The following map portrays more detailed information on the particular species fished within these areas. The information for this map was drawn from a California State Lands Commission environmental assessment document prepared by SAIC, with the map data cited as being developed by NRC 1999. Clearly these polygons are based on the MMS data developed in the 1970s, but the additional species data provided shows that the area of multiple cable transit for party boat fisheries is targeted on deep water rockfish. This is the only deepwater rockfish target area within the study region.
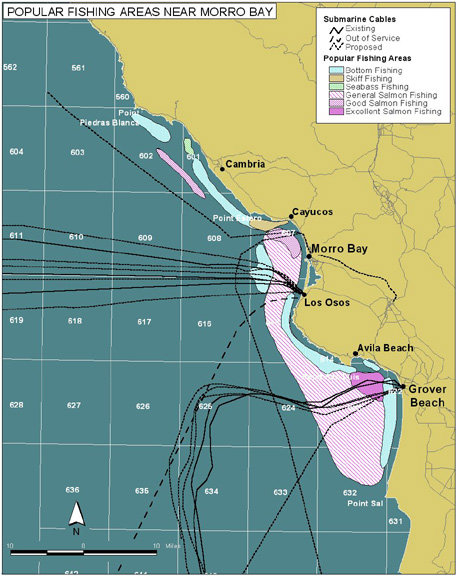
Source: Esri; SAIC; PSMFC; Fishing Areas Data: Morro Bay Fishery Economic Impact Study (NRC 1999) .
The following figure shows nearshore commercial fisheries in the study area. Again these data are based on MMS information from the 1970s. These data present information based not on vessel type or class, but rather on commercial species groups. These are the types of information that are most amenable to GIS analysis, where areal calculations can quantitatively show potential impacts in several different ways.
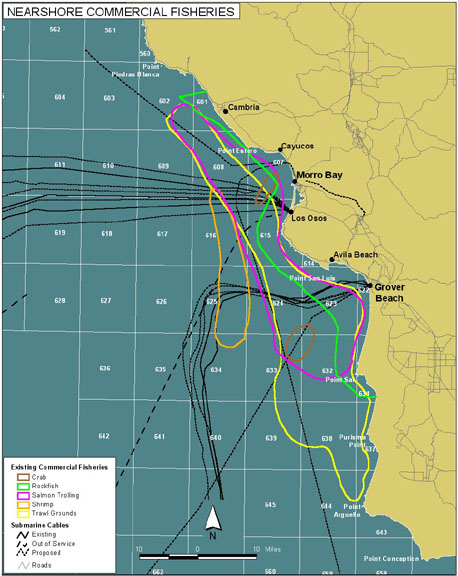
Source: Esri; SAIC; PSMFC; MMS.
For the purposes of simplification for this presentation and paper, we will now examine a subset of the commercial fisheries trawl data off of the Grover City area. Trawling is the specific type of gear that is most likely to come in contact (conflict) with cable operations. Whether or not conflict actually occurs depends on a number of factors, including the type of bottom substrate and depth of burial (if any) of the cable.
The following figure shows several different trawl areas offshore of Grover City. As can be seen, these areas are not randomly distributed within fish blocks, nor are there significant areas of overlap in the areas that are targeted for the different species groups.
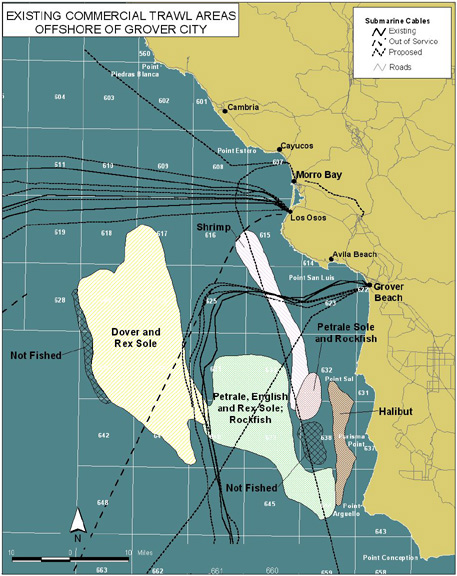
Source: Esri; PSMFC; SAIC; MMS.
There are two different types of area preclusion that can occur with the siting of undersea fiber optic cables. The first is preclusion during installation, and the second is preclusion during the operational period [and potentially post-operational/abandonment period] of the project.
During installation, typically fishing is not permitted within one nautical mile (nm) of the cable either during the cable laying process or, if the cable is to be buried, within that period between laying and subsequent burial. The following figure shows a 1 nm buffer on either side of the proposed cable routes for the specific fisheries illustrated offshore of Grover City.
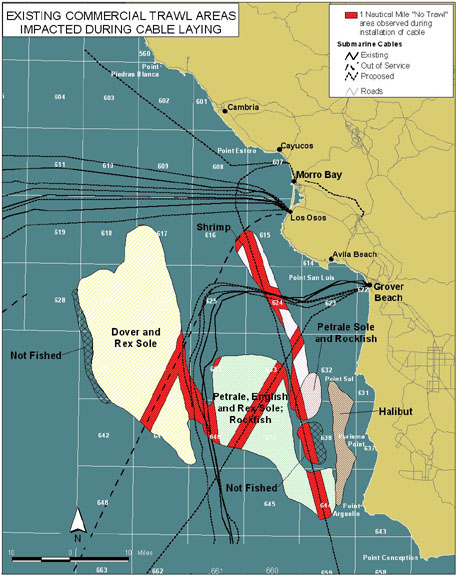
Source: Esri; PSMFC; SAIC; MMS.
Calculating the area within the polygons of the different target species then provides a total potential cumulative installation phase impact to the selected fisheries shown. The actual area of impact for any one project, and the magnitude of the impact would depend on two primary factors: (1) the timing of the project; and (2) the duration of the project. The timing of the project is important due to the seasonality of the fisheries. For some species a very large proportion of the total annual catch occurs during a short period after the season opening; for others, the catch is distributed over a longer period. Duration of preclusion is important for obvious reasons.
To understand the relative significance of potential construction preclusion to any individual fishery requires an assessment of the total area of the fishery target effort, the total area precluded, and the percentage of the total target area precluded. As shown in the following figure, the potential installation phase preclusion among the fisheries illustrated is especially great for the shrimp fishery. Again, these are potential areas of impact intended to display methodology and are not illustrative of actual impacts of these particular projects. Impacts maybe minimized or avoided altogether depending on timing of installation burial depth of cable, or a number of other factors.
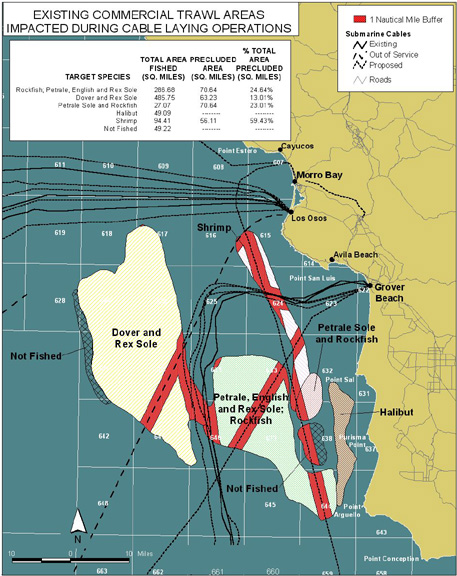
Source: Esri; PSMFC; SAIC; MMS.
For the operational period (and post-operational period, if the cable is abandoned in place), the area of potential preclusion is a great deal smaller, but not insignificant. If fishers observe an exclusion zone of one-quarter mile on either side of the cable, to avoid trawl gear snags, a one-half mile swath is cut through the fishing grounds for each cable. This is illustrated in the following figure.
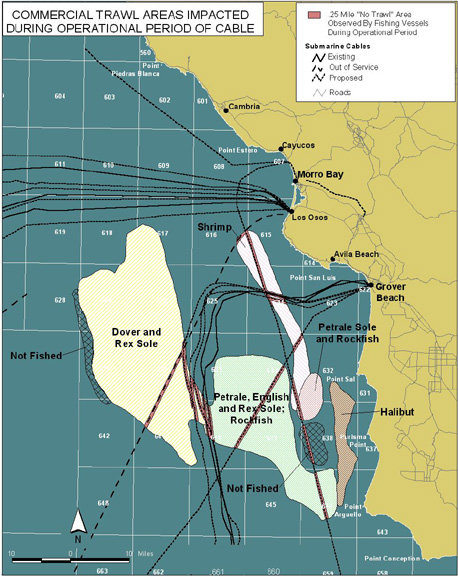
Source: Esri; PSMFC; SAIC; MMS.
Depending on the orientation of the cable as it crosses the fishing grounds, standard fishing practices may either accentuate or dampen the actual or realized magnitude of the potential impacts. Trawl tows are not random, rather, they tend to follow depth contours. Where the cable parallels the isobath, fewer tows will be interrupted. Where the cable is perpendicular to the isobaths, the vessel will have to discontinue the tow upon approaching the cable and retrieve the gear, and then, after passing the cable, reset the gear and resume the tow. This is obviously costly in terms of time and effort. Calculated areas of preclusion during the operational phase of the cables for the illustrated fisheries are presented in the following figure.
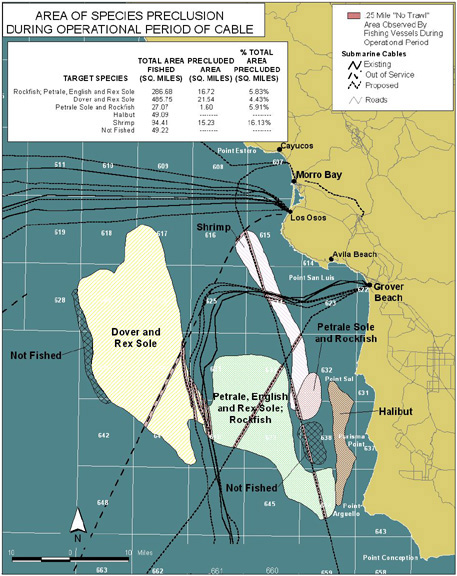
Source: Esri; PSMFC; SAIC; MMS.
The cumulative area of preclusion for all proposed projects is illustrated in the following figure. As noted in the previous discussion, actual impacts will be realized based upon specific fisheries involved, and the relative area of the fishery that will be effected.
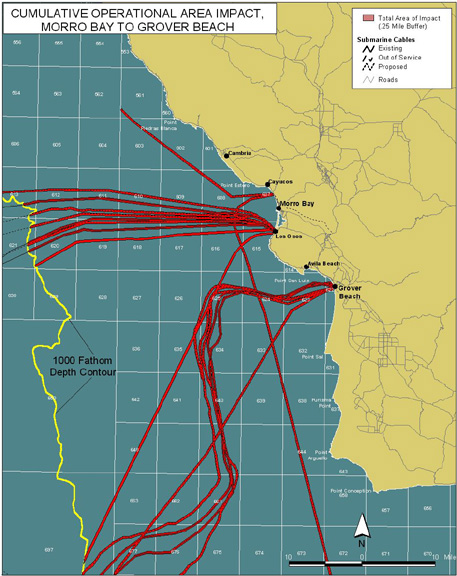
Source: Esri; PSMFC; SAIC; MMS.
Here, we have illustrated some of the factors involved in using GIS to analyze potential direct impacts to fisheries resulting from subsea cable development. To understand the distribution of related social impacts to communities and other economic sectors requires the attribution of impacts to landings, homeports, communities of residence of vessel owners and crew, and to the locations of primary and secondary markets. All of these are beyond the scope of this paper. This example, however, does serve to illustrate the potential for GIS data to show differential distribution of impacts among the various fishery sectors that are likely to result from development actions.
Summary
The two examples shown provide an illustration of the use of geographic data for fisheries social impact assessment. In both of these cases, the best available data sets were less complete than would optimally be the case. However, when existing quantitative information was supplemented with data gathered from key person interviews, impacts could be described in a way that was not possible without this information. In the case of the California fisheries in particular, a different type of quantitative analysis was made possible by the use of a data layer based on qualitative data. That is, traditional fisheries statistical data gathering utilizing harvest and landings transaction data was made much more useful by the addition of interview data that commonly result from ethnographic data collection methodologies typically employed in the social sciences. This suggests that to further increase our ability to manage fisheries in general, and to provide social impact assessment capabilities in particular, that both types of data collection need to be improved in terms of accuracy/precision as well as in extent of coverage.
References
BLM, 1978, Bureau of Land Management, Pacific OCS Office.
Downs, Michael A., Ph.D and Petterson, John S., Ph.D, February 26, 1997, Rapid Socioeconomic Evaluation of the Proposed Marine Conservation District St. John, United States Virgin Islands. Pepared for: The Caribbean Fishery Management Council
Esri, 2000, Environmetal Systems Research Institute:http://www.Esri.com/
MMS, 1972, Minerals Management Service.
PSMFC, 1999, Pacific States Marine Fisheries Commission:http://www.psmfc.org/
SAIC, Science Applications International Corporation, January 10, 2000, Draft Environmental Impact Report: AT&T China-U.S. Cable Network, Segments S7 and E1, San Luis Obispo County, California, Lead Agency: State Lands Commission, Sacramento, California, p. 4.1-3 and p. 4.7-5
Michael A. Downs, Ph.D.
Eric Coughlin
KEA Environmental, Inc.
San Diego, California
June 2, 2000