Maintenance personnel, customer service staff, surveyors, and managers at Anne Arundel County, Maryland are all using an enterprise GIS interface to query and view everything from maps to utility billing information and more. This MapObjects-based application, dubbed CountyView, has general interface components that serve all users, as well as specific functions designed for targeted audiences. For example, it has work order and service request interfaces to an infrastructure maintenance management system, displays as-built drawings, and contains a capital improvement projects database that can be displayed on the map. This paper addresses how Anne Arundel County's enterprise GIS provides a wide range of customized functionality to many types of users, and how it can be extended to do even more in the future.
Just a few years ago, GIS was in its infancy at Anne Arundel County, Maryland. Today, however, the County has deployed an enterprise GIS application to their maintenance personnel, customer service staff, surveyors, and managers in the County’s Public Works department.
Historically, the County managed its public works infrastructure and land use with paper maps, as-built drawings, and aerial photographs. This was no small fete. Anne Arundel County encompasses 416 square miles, and has a population that exceeds 475,000. Included in these numbers are the city of Annapolis and several Baltimore area neighborhoods. The County manages over 2,200 miles of water and sewer mains, 1,674 miles of roads, and 527 linear miles of shoreline on the Chesapeake Bay. Moreover, the County’s population increased 50% between 1970 and 1995. The county has over 780 Public Works employees.
In 1997 the county began looking for better ways to manage and access public works information. John Brusnighan, Director of Public Works, challenged his staff to migrate to a computerized infrastructure management system. After developing a scope of work and reviewing proposals, the county selected the RJN Group to provide a solution. RJN provided its CASS WORKS software and related services. CASS WORKS is an integrated software solution for the maintenance management needs of municipal infrastructure systems and equipment based facilities.
One of the requirements and goals of the original scope of work was the integration of the work order system with the county's GIS data. GeoNorth was brought in to fulfill this need, but ended up tackling several additional goals along the way. As a result, GeoNorth developed a multi-departmental mapping and database query application. The County named this application CountyView. This application provides the County staff with quick and easy access to essential information, regardless of where it resides or what format it is in. Specifically, this application provides access to GIS databases, property records, billing information, public works inventory and maintenance data, as-built drawings, scanned maps, deeds, capital improvement information, surveying monuments, orthophotos, and hydraulic model information. CountyView has general interface components that serve all users, as well as specific functions designed for targeted audiences.
Ultimately, the CountyView application may be extended to serve other departments, such as Planning, Health, Police, Fire, and the Executive Office.
Many organizations, and particularly local governments and utilities, maintain a diverse array of information and technologies for a wide range of users and uses. Without some level of standardization, this can be time-consuming and expensive because it can require many specialized training and technical support services. Enterprise software applications can reduce these service demands and costs. By providing a common look and feel for users of certain classes of information, enterprise solutions reduce the scope of specialized training that users need. Additionally, deploying an enterprise solution in lieu of multiple specialized applications reduces the scope of technologies the organization needs to support.
Key technical requirements for implementing the CountyView enterprise GIS were:
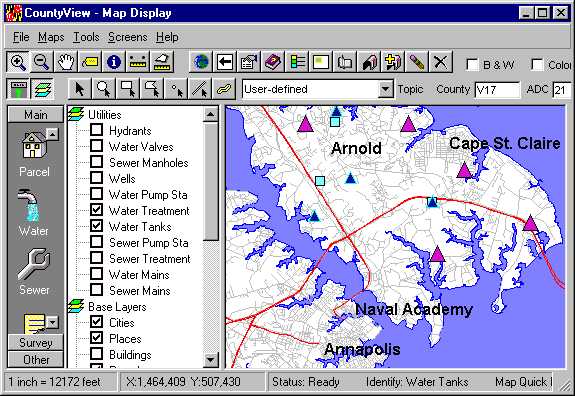
CountyView uses an Outlook-style interface that provides a categorized icon bar (list bar) to access multiple views (screens). Most views share the same pulldown menus and buttons for accessing common functions, but they also have their own distinct buttons, text boxes and other types of controls for specialized functions. Map layers are presented in a categorized tree control (the layer tree). Individual map layers can be turned on or off by simply clicking on the layer in the layer tree. The list bar and the layer tree can be toggled on/off to maximize screen real estate.
The application provides several general features that are available from any view. This includes map feature selection tools, a SQL query builder, measuring tools, map navigation, identify, map tips, print a pre-formatted map, copy map to clipboard, print any form, address searches, gazetteer, vicinity map, change the map layer properties, map legend, online help, and zoom to a grid location.
Some of the data sets that the application provides access to include: water and sewer infrastructure, streets, building footprints, shoreline, school districts, parcels, scanned operating maps, tax maps, color orthophotos, county grids, and many more. Users can also add their own data layers for display and query.
This section of this paper describes several application views including the Map Display view, Parcel queries, Capital Improvement Projects, As-Built Drawings, Work Orders, and Survey Monuments. Views not covered here include: water facilities, sewer facilities, water billing, service requests, metadata, survey requests, and survey projects.
Several of the images displayed in this paper have been modified to meet presentation guidelines. The actual application provides more graphical interface components than presented in this paper. Pulldown menus and tool bars are available in most views, but will not be shown in subsequent images.
The image below shows the Map Display view, which is the view typically displayed when the application starts. This view maximizes the size of the map and provides all of the general features available throughout the application such as map navigation, graphic selection, spatial queries, and printing the map in a pre-formatted layout.
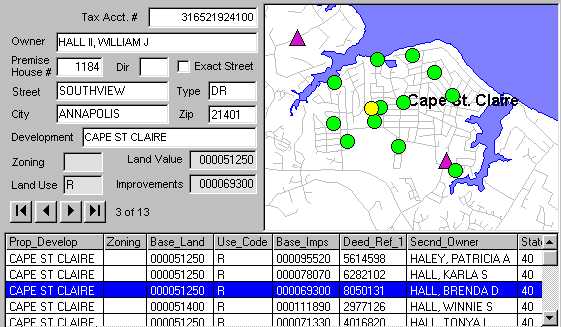
The Parcel view allows the user to search for property records by providing one or more pieces of information, such as name, address, city, development, or account number. Graphic selection tools (box, line, polygon, buffer) also can be used to select a set of parcels via the map. The search results are displayed in a data grid, and the text boxes are populated with information from the highlighted row in the grid. The highlighted row in the grid is associated with the yellow dot on the map; the remaining rows in the grid are associated with the green dots. The user can navigate through the selected set of records using one of the following methods: 1. Clicking VCR-style buttons (forward, backward), 2. Clicking a row in the grid, 3. Selecting a feature on the map. New information is displayed in the text boxes when the highlighted record is changed. The grid and map also are updated dynamically based on which record is highlighted. This process is called a sub-selection, and is available for most views in the application. Search results can be exported for external analysis and reporting.
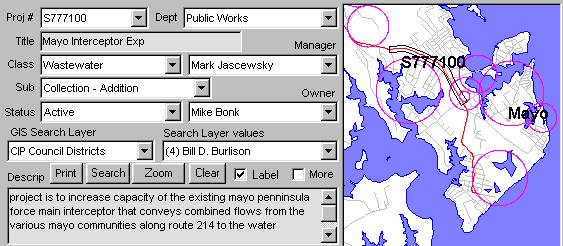
One of the features of CountyView that has a more focused audience is its ability to query a Capital Improvements Projects (CIP) database. The CIP view provides a detailed report of current and completed Projects occurring throughout the county. The user can search for projects based on one or more pieces of information, including project number, department managing the project, project class and subclass, and status. Map layers can also be used to search for all of the projects within a geographic region, such as a county council district. A user can also select a general area on the map using a variety of map selection tools. The search results display detailed information about the project, a description, and funding information for the full cycle of the project.
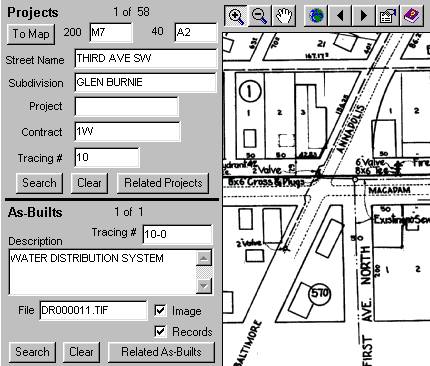
Scanned as-built drawings can be viewed directly within the CountyView application. The interface offers a variety of ways to search for the scanned drawings. A user can select a map feature or a general map area and inquire if there are any as-builts for this feature or area. Or the user can search for a project and find out if there are as-builts associated with the project. The user can also search for specific as-built drawings by name or description. This view integrates two legacy systems that lack a common keyed field. In the image shown below, the top portion of the view is linking to a Projects table, which stores general descriptive information for each project. Each project contains a tracing #, which is similar to, but not exactly the same as the tracing number in the As-Builts table. In the image below, the Projects tracing # is "10", the As-Builts tracing # is "10-0". This is one of the simpler examples of how the data can vary between the two data sets.
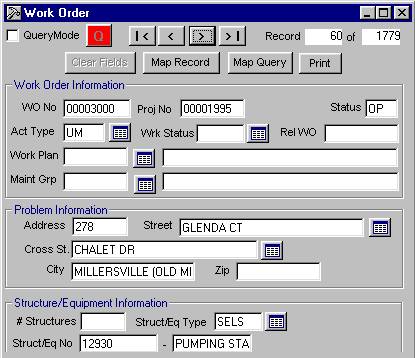
CountyView provides functions that allow the user to view the maintenance management data. One example of this is the ability to query the Work Order data. A user can search for work order records by status, work order #, address, or activity type. They can also use the map to select work orders in a geographic area. The query results are displayed in a form, shown below, that allows the user to step through the records. The user can ask to see the map location associated with the current work order record or all the selected records.
The application also offers the ability to point at a facility on the map, such as a water pipe, and inquire if any work orders are associated with the facility. If there are any, they will be selected and displayed in the work order view.
For the more technical user, CountyView allows a user to pass information (a query) between CountyView and CASS WORKS, or vice versa. This provides access to functionality that might not be present in one of the applications being used to analyze data.
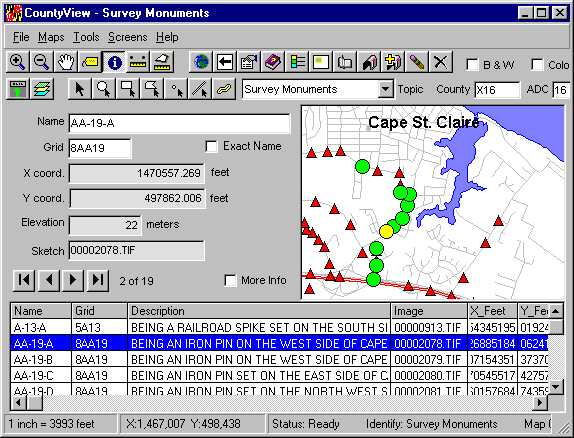
One of the newest additions to CountyView is the ability to view survey monument and project information. This provides county staff with access to the current inventory of survey data and project status, as well as the ability to submit a request for survey work to be performed. The image below shows a portion of the monuments view, which allows the user to search for monuments by name or grid value, or by selecting monuments on the map. The view provides detailed information about each monument, and a data grid that provides an overview of the selected records. The application will display a scanned sketch of the original paper monument card.
The Survey Monuments view is unique in that it also serves as the administrative interface for maintaining the survey monument data. After successfully navigating a special login form, the interface will change, exposing additional buttons that allow the user to manage the data. The Survey Request and Survey Projects views also offer dual query and administrative functionality.
It was a known fact that data locations, map layer names, and column names would change after developing this application. It was also known that each department would want to alter the behavior of the application. CountyView is designed to meet these needs through a series of initialization (.ini) files, lookup tables, and supporting files that dynamically change the look and feel of the application. When the application starts, it reads information stored in an .ini file to determine data locations and a wide variety of application environment settings. The ini file allows for the behavior of the application to be modified without having to change the source code.
Several ini file settings are used to determine where data sets are located. As an example, the "DataPath" setting is used to tell the application where the map data layers are located. The value for this setting can be changed to point to a local copy of the data instead of a remote copy.
[MainFiles]The application also reads the ini file to determine how the Gazetteer will function. The Gazetteer is a tool that allows the user to look at a list of feature names in a combo box. They can either select one of the names or type in a name they are looking for, select the appropriate name, and zoom to the selected feature on the map. The application has been designed so that any map layer (cities, neighborhoods, restaurants) can be used with the Gazetteer. The "MapLayer" setting specifies which map layer to use. The "SearchField" setting determines which column in the map layer contains the names.
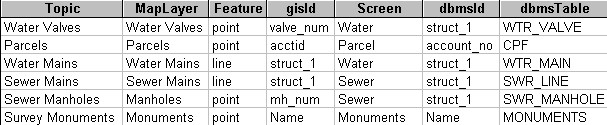
[Gazetteer]Similar to the ini file, the application relies on a series of tables in a "support" database to define its behavior and functionality. The "Topics" table separates several data dependencies from the source code. The application uses topics to control the geographic and tabular data sets used for queries. Each topic is associated with a map layer, a database table, a view (screen), and several other properties. Depending on user needs, there might be a single support database or there might be one for each department. The image below shows a few records and columns in the Topics table.
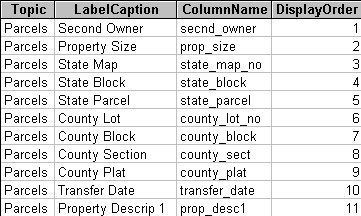
Some of the CountyView functionality is database-driven. What this means is that it's capabilities are defined by settings stored in a database. The advantage of this design is that functionality can be modified without changing the source code. For example, one of the features available on the Parcel view is a "More Info" checkbox that, when checked, replaces the map portion of the view with a detailed data screen. The information that gets displayed in the data screen is controlled by the "MoreInfo" table, which resides in the Support database. The image below shows a portion of the "More Info" data screen.
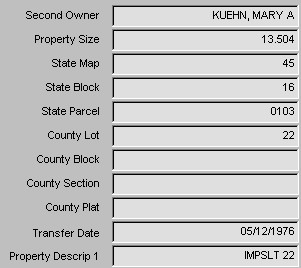
Each textbox in the "MoreInfo" screen is associated with a record in the "MoreInfo" table. The "LabelCaption" column contains the text string that will be displayed to the left of the text box. The "ColumnName" column is the actual column name of the data that should be displayed in the textbox. "DisplayOrder" determines where to display this information in the "More Info" screen.
Following is a list of the major software components used to develop the CountyView application:
CountyView is based on the CityMap™ application framework. CityMap™ is a customizable and extensible desktop application framework for searching and viewing tabular and spatial data. Developed by GeoNorth, CityMap™ is an application design concept and set of code libraries that GeoNorth can use to develop a wide variety of applications very cost-effectively.
In a typical CityMap™-based application, the interface design is a Microsoft Outlook-style that provides access to a series of views (screens). GeoNorth has developed model views, reports, and queries that can serve as "jump-starts" for many application needs. The CityMap™ design is extensible, meaning new views can be integrated into it. For a copy of a CityMap White Paper, contact Andy Sloop, asloop@geonorth.com.
The following people and organizations made significant contributions to the CountyView project: