Naval Warfare Publication 4-11 (NWP 4-11) requires that an environmental annex (Annex L) be developed for a Navy operations order or operations plan. The purpose of Annex L is to ensure that Naval operations achieve success while maintaining the highest level of environmental protection and compliance. PCCI has created for the United States Navy an ArcView GIS system utilizing the Marine Spill Analysis System (MSAS) created by Esri that will help fleet planners create an Annex L. The resulting process provides fleet planners the ability to quickly and economically create an environmental analysis to support the Annex L development.
NWP 4-11 was promulgated in March of 1999 and it requires that environmental considerations be included in operational planning. It further provides Navy and Marine Corps commanders and planners with doctrine to accomplish their assigned mission while achieving the highest possible degree of environmental protection and compliance. It also includes guidance on the preparation of an environmental annex (Annex L) to an operations order or operations plan.
To support fleet commanders and planners, the Navy is creating tools to support the creation of an Annex L. The resulting GIS allows the Fleet planner to combine many types of data including environmental data, infrastructure data, maps, and oceanographic data. This will give the fleet commanders and planners the ability to produce an in-depth analysis of the environment of an area in an easy to use graphic interface.
First, a pilot project was initiated for the Black Sea to examine the feasibility of GIS to support fleet environmental planning activities. The Black Sea was chosen because it is recognized as an ecologically important area and there were no available consolidated environmental data sets for the Black Sea region. (Platt [1]). Furthermore, The US Navy, in its effort to prepare for operations on the Black Sea, is working with regional navies on Black Sea oil spill contingency planning.
GIS was chosen because it has proved to be an effective method in environmental planning. Environmental planning requires attention to spatial considerations, and GIS technology provides a mechanism for maintaining spatial data in dynamic environments and enables the power of spatial associations to be more fully realized (Penland, et al. [2]). Secondly, environmental planning necessitates strong temporal considerations, and a GIS allows quick and accurate access to current information. Finally, GIS allows for the combination of Black Sea environmental data, country specific information and information derived from satellite imagery in a format that allows for easy analysis.
The Black Sea GIS went through six phases of development:
1. Environmental Information Collection 2. GIS Tool Modification 3. Study Area Selection 4. Satellite Imagery Classification 5. Country Specific Information Collection 6. GIS Formation.The collection of environmental information for the Black Sea coastal region was a concern because of the lack of harmonized environmental data sets. An abundance of Black Sea environmental data exists but is in different formats, languages and countries around the Black Sea and the world.
The World Conservation Monitoring Centre (WCMC) in Cambridge, UK was thus tasked to use their extensive environmental data resources to compile the first complete harmonized set of environmental data for the Black Sea region on the following subjects:
1. Important Coastal Wetlands of the Black Sea 2. Important Bird Areas along the Black Sea 3. Coastal Protected Areas of the Black Sea 4. Endangered Animal Species of Black Sea States 5. Marine Mammal Populations 6. Commercial Fish Stocks 7. Endangered Plant Species of Black Sea States 8. International Conventions and Agreements Covering the Black Sea Coast.
The information on each of these subjects was collected from a wide range of different sources and was delineated by country when possible. WCMC then created a vector map of the Black Sea Coastal area (from littoral zone to 50 miles inland) that contained polygons representing the boundaries of environmentally sensitive areas. The vector format for this data representation describes the features in lines and points allowing for it to be easily combined with other data sets as well as to allow for manipulation if correction was needed. The boundary vector information includes national parks, Ramsar sites (internationally designated important wetlands), World Heritage sites (internationally designated cultural site), recognized important bird areas, recognized important wetlands, fisheries, marine mammels, and red listed flora and fauna information.
Information gaps identified during the data collection effort are as follows:
It was possible to gather good data on the wetland habitats of the Black Sea and important bird areas, but it was not possible to research other important habitats (e.g., seagrass, sand dunes, beaches). Protected areas are listed by name, size and location, where possible. More detailed information (on management status, boundaries, national and international importance, etc.) was available in some cases but not all.
Such gaps were anticipated, as the resources to conduct this study were limited. However, recommendations were made as to how to improve the information in order to fill the gaps.
In order to utilize existing GIS capabilities, the Marine Spill Analysis System ArcView 3.0 version was reviewed and used due to its powerful analysis capability. MSAS was developed by Florida for emergency response to oil spills and for contingency planning purposes. The system is a modular approach, which has a core around which extensions fit. The system is therefore very flexible, allowing the customization of products for multiple uses.
The data that was received from WCMC was in two forms; a detailed textual report and ArcView shapefiles. We needed to combine the two in a tool that would allow the planner the ability to do several analyses of specific areas, and print reports that included the textual data from the printed reports and detailed, customized maps. Esri Professional Services Division was tasked and completed a new report writer extension that fits into and utilizes MSAS's analytic capability. The new report writer, or the "Navy Environmental Extension" allows a planner to draw a polygon, circle or rectangle around a specific area and then run a report on predefined data layers relative to the type of operation or user specified data layers. The system pulls together a list of the affected resources and the textual information that describes them. Reports can be saved out with maps, and these can be analyzed and incorporated into the Annex L.
Remote sensing applications were integrated as part of the pilot project to prove its feasibility. A study area for this part of the project was identified as the Black Sea coast of Bulgaria and Turkey. This area was chosen for several reasons. First, an analysis of the information gathered by WCMC indicated that the area contains a number of ecologically important wetlands and national parks. Furthermore, there has been an increase in the activity of the US Sixth Fleet in this region as part of Partnership for Peace (PfP) initiatives. This identified coastal region is also at greater risk, especially as general shipping traffic increases. This area also offered to be a good area that would allow different types of country specific environmental information and information extracted from the satellite imagery to be co-registered. Finally, Landsat Thematic Mapper (TM) has a polar orbit, and this region coincided with a Landsat TM cloud free image that maximized the coastal area study zone.
The use of satellite imagery is an important piece of the Black Sea GIS. First, satellite imagery allows for an accurate and up-to-date planimetric base map. The shoreline vector data provided by WCMC was taken from Digital Chart of the World. The Digital Chart of the World dataset was digitized from 1:1,000,000 Operational Navigation Charts and 1:2,000,000 Joint Navigation Charts. This data is adequate for global coverage but lacks detail and accuracy, and so a new shoreline was created for the entire TM scene. Secondly, Landsat TM data contains large amounts of information that can be used to create a regional environmental baseline. This can provide accurate information on the location of environmentally sensitive areas, such as coastal wetlands. Landsat data accomplishes this by analyzing the data from seven TM bands that measure reflectance values of the earth. By analyzing these bands, similar land types can be extrapolated from the entire image thus producing a classification of the scene. The classification data can also be used to pinpoint areas for more detailed investigation (Jakbauskas, [3]).
Landsat TM data was acquired by Space Imaging-EOSAT of Thorton, Colorado. An image taken on June 24, 1997 was used for the study. The TM scene chosen for the study covered the area from Burgas, Bulgaria southeast to Karaburan, Turkey. Some problems were encountered with obtaining the image from the ground station in Italy where the image was stored because the TM image was corrupted during the transmission from Italy to the US. However, it was decided to use the image because the corruption was minimal, and it had little effect on the ability to extract data from the image.
Vector data from WCMC was then imported by Space Imaging, and the two datasets were then co-registered. The vector data was georeferenced and in a geographic projection (latitude and longitude). The vector data was used to provide ground controls so that the imagery could be referenced to the same projection. This was accomplished by selecting multiple ground control points (GCPs). GCPs are locations where there are known coordinates from the source (vector data) that can be seen visibly in the imagery (Narumalani, et.al, [4]). By using several of the vector layers provided by WCMC, enough GCPs were collected to allow for adequate warp of the imagery. Figure 1 shows the georeferenced image where ground control has been applied.
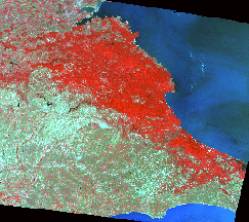
"Figure 1 - Georeferenced Landsat TM Image"
Once the image had been georeferenced, all of the vector data and TM imagery was registered to the same coordinate system and projected as illustrated by Figure 2, Ropotamo National Park in Bulgaria. This allows the datsets to be viewed concurrently at the proper scale and in the correct geographic location.
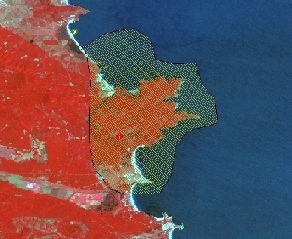
"Figure 2 - Co-registered Data of Ropotamo National Park, Bulgaria"
The image was then processed, and a multispectral classification was performed. A land cover map is the result of such a classification. The classifications were done primarily where wetland areas were known to exist. The vector data provided by WCMC was used to narrow down the areas to be classified thus narrowing the field to these areas.
It was now possible to classify the image based on the classification of the analysis of the different Landsat TM bands and to narrow down the exact locations of the wetlands to provide a quantitative appraisal (Jensen [5]). Other cover categories were also qualified for the Ropotamo area. In Table 1 area of each land cover type is listed. These values correspond to the subset areas.
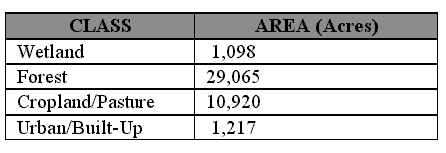
"Table 1 - Area of Different Land Cover Types of Ropotamo Park, Bulgaria"
In Figure 3 we see that the classification of the Ropotamo Park area gives us a precise location of the sensitive wetland areas.
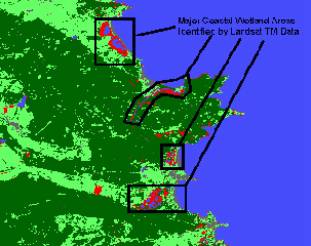
"Figure 3 - Wetlands Classification of Ropotamo Park, Bulgaria"
It was also important that the GIS include as much country specific base map information as possible. This includes the infrastructure information that would be required by the Sixth Fleet planners. This comprises such information as roads, cities, airports, boat ramps, port facilities and other infrastructure that would add subsequent layers to the Black Sea GIS (Jesson, [6]).
For this purpose we used available information from the US National Imagery and Mapping Agency (NIMA). Specifically, we used a number of their products including their Digital Nautical Charts, Arc Digitized Raster Graphics and World Vector Shoreline Plus products. All of these products contained a great amount of varied country specific information which was sorted and compared to the requirements of the responders and planners to determine what was useful and what was not. The useful information was then to be included in the Black Sea GIS.
The formation of the final GIS was a method of combining all the gathered information and formed into a functional, multi-layered Geographical Information System as illustrated in Figure 4.
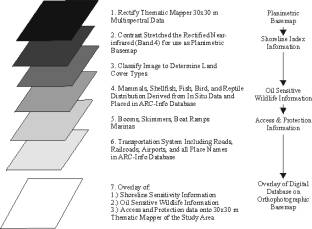
"Figure 4 - Schematic Diagram Showing GIS layer Formation and Overlay"
The final product included the base map created by WCMC, the satellite image and the NIMA information. Also, the textual data from the WCMC report was included in the system as attribute information describing each environmentally distinguished area. Therefore, a responder can choose an area and get instant information on the wildlife, bird nesting information, endangered species, management information, etc., on a certain area.
GIS, creates a powerful tool that is able to combine “data islands” into one complete “data continent” that is easy and efficient to use (Clark, [7]). The resulting tool gives the fleet planner the capability to do an environmental analysis of an area and to create an Annex L. It was also found that environmental data combined with satellite imagery can provide an inexpensive and highly accurate picture of the coastal area.
It must be noted that environmental data collected from historical sources and satellite imagery is not as accurate as the data obtained from ground truthing. However, it can provide an excellent first overview that would allow planners to make decisions that would maximize the protection of the environment for marine, amphibious, air, and land operations. It also allows the extraction of a precise planimetric base map for a coastal area which can be very useful, especially in many parts of the world where the coastal zone maps are out of date.
This method can easily be transferred to any part of the world. We can create a quick, accurate GIS system very quickly that can serve as a planning tool for Annex L support. This capability will only increase as new technology such as hyperspectral and higher resolution imaging becomes available.
[1] Platt, A., Black Sea: A Sea of Troubles, World Watch, Jan.-Feb., pp. 11-18, 1995.
[2] Penland, S., Wayne, L., MMS Gulf Region GIS Database For Oil Spill Contingency Planning, Proc. of the 1995 International Oil Spill Conference, eds. J.O. Ludwigson, Long Beach, California, pp. 851-852, 1995.
[3] Jakubauskas, M., Modeling Endangered Bird Species Habitat with Remote Sensing and Geographic Information Systems, Proc. of 1992 ASPRS-ACSM Annual Convention, eds. L. Gleasner, Vol. 2, Albuquerque, New Mexico, pp. 157-166, 1992.
[4] Narumalani, S., Jensen, J.R., Weatherbee, O., Murday, M., and Sexton, W.J., Coastal Sensitivity Mapping For Oil Spills in the United Arab Emirates Using Landsat Thematic Mapper Imagery and GIS Technology, Proc. of 1992 ASPRS-ACSM Annual Convention, eds. L. Gleasner, Vol. 2, Albuquerque, New Mexico, pp. 314-319, 1992
[5] Jensen, J.R, Ramsey, E.W., Holmes, J.M., Savitsky, B., & Davis, B.A., Environmental Sensitivity Index (ESI) Mapping for Oil Spills Using Remote Sensing and Geographic Information System Technology, International Journal of Geographical Information Systems, 4(2), 181-201, 1990.
[6] Jesson, E., Digital Data Collection Techniques for Land Use and Land Cover: Tacoma and Denver West Prototype Projects, Proc. of 1992 ASPRS-ACSM Annual Convention, eds. L. Gleasner, Vol. 2, Albuquerque, New Mexico, pp. 188-198, 1992.
[7] Clark, J.R., Coastal Zone Management Handbook, CRC Press, Boca Raton, New York, London and Tokyo, pp. 315-318, 1995.
William J. Hanlon Jr., Project Manager PCCI 300 North Lee Street, Suite 200 Arlington, VA 22204 Phone: 703.684.2060 Fax: 703.684.5343 E-mail: bhanlon@pccii.com