The American Community Survey
Nancy Torrieri, Lynn Weidman, Thomas Coughlin, K. Evan Moffett, Irina V. Sharkova and Risa S. Proehl
Abstract
The American Community Survey: Overview and Operations - Paper 857
The Census Bureau is developing the American Community Survey as a way to give the Nation critical information every year, not just once in ten years. Designed to replace the decennial census long form, the American Community Survey will be a tool to make programs more flexible to meet community needs and to determine how well programs are working by measuring results. American Community Survey data will provide geographers and planners with opportunities for the spatial analysis of demographic, housing, and economic information that will be refreshed yearly. The Census Bureau plans to conduct the American Community Survey nationwide in 2003. This presentation will provide an overview of the program, its operations, and data products.
The American Community Survey: A New Way to Collect Census Data - Paper 867
In response to a need to develop a more timely data collection system than the traditional decennial census, the Census Bureau developed "continuous measurement." This alternative data collection method calls for obtaining detailed social, economic, and housing information through an ongoing monthly survey -- the American Community Survey -- and obtaining population and housing unit counts and a few basic population characteristics through a decennial census. This presentation will provide information on the statistical design of the American Community Survey, and highlight some of the statistical issues we are addressing in providing data for geographic areas and population groups.
The Community Address Updating System: Maintaining and Updating the Census Bureau's Address List for An Annual Survey - Paper 868
The Census Bureau is developing a Community Address Updating System (CAUS) which will continuously update the address files used to conduct the American Community Survey and other surveys that the Census Bureau conducts. The CAUS program is now in the development and testing phase, with full implementation planned for 2002. This presentation will provide an overview of the CAUS program objectives, procedures, and plans.
Serving Those in Need: Utilizing American Community Survey Data in Housing and Community Development - Paper 894
This presentation reports on the utilization of American Community Survey data for a state-mandated program sponsored by the Oregon Housing and Community Services Department (OHCS). The OHCS sponsors a semi-annual competition to select the most meriting proposals from housing developer applicants and make awards for several grant and tax credit programs. One of the criteria in the OHCS evaluation of proposals is the soundness of an analysis demonstrating need for affordable housing. The Population Research Center conducted a study using American Community Survey population and housing data on behalf of a local affordable housing developer and according to the guidelines developed by the OHCS. The study area encompassed census tract 34.01 in Multnomah County, Oregon, an American Community Survey site.
Introduction
The geographic information system (GIS) industry has benefited greatly from the Census Bureau's development of a digital spatial database, the topologically integrated geographic encoding and referencing (TIGERÒ ) system. This development represented a revolution in the means of updating and maintaining the geographic tabulation framework responsible for the maps, computer files, and other products that support the Census Bureau's numerous census and survey operations, and the varied and growing number of users of geographic information systems everywhere.
Now, this industry is poised to benefit from another revolutionary development at the Census Bureau. Plans are for a new program, the American Community Survey (ACS), to collect every year the detailed, economic, demographic, and housing data now collected every ten years as part of each decennial census. The ACS is designed to replace the decennial census long form for the 2010 census. The Census Bureau will continue to count the population using a short form every ten years.
Background
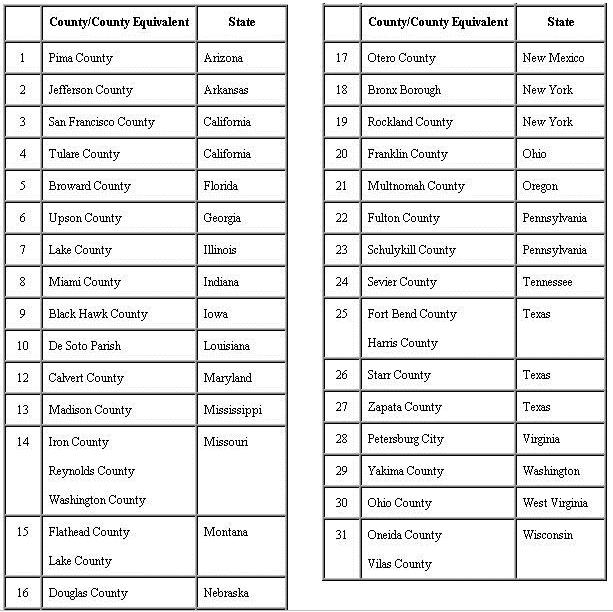
As early as the 1950's, mathematical statisticians at the Census Bureau and elsewhere began to envision a plan for a system that continuously collects data throughout the year and the decade to produce measures of change over time and more current data than the decennial census long form, a detailed sociodemographic survey data collection instrument that has accompanied the decennial census short form since the 1940 census. Leslie Kish, a mathematician from the University of Michigan, may be credited with much of the original design effort of a continuous measurement system. Later, mathematical statisticians at the Census Bureau refined and elaborated on plans suggested by Kish, and developed alternative implementation strategies reflecting different cost and resource models. The Census Bureau presented a detailed plan for implementing a continuous measurement system to an annual meeting of the Population Association of America (PAA) in 1993. After receiving and implementing comments received from the PAA and other organizations and data user groups, the Census Bureau implemented continuous measurement in 1996 as the American Community Survey. Initially conducted in four sites in 1996 to determine its operational feasibility, the ACS expanded to eight sites in 1997 to evaluate costs, procedures, and new ways to use the ACS information. In 1998, the ACS expanded to include two counties in South Carolina that overlapped with counties in the Census 2000 Dress Rehearsal. In 1999, the Census Bureau increased the number of sites to 31 (Figure 1).
Figure 1. ACS 31 Sites
These sites represented diverse combinations of characteristics relating to population counts and growth rates, difficulty in enumeration, and different characteristics of interest, including racial and ethnic characteristics of the population, the presence of unique population groups such as migrant workers, improving or worsening economic conditions, and predominant occupation or industry types. The Census Bureau will continue to collect data in these 31 sites through 2002. These sites make possible a tract-by-tract comparison between the 1999 and 2001 ACS cumulated estimates and the Census 2000 long form estimates. The Census Bureau will use these comparisons to identify both the causes of differences and diagnostic variables that tend to predict specific differences in responses to the ACS and the decennial census long form. In 2003, the Census Bureau plans to implement the ACS in every county of the United States, as well as in every American Indian and Alaska Native area, with a total annual sample of three million housing units.
The American Community Survey questionnaire and methodology are being used during 2000 to conduct a larger scale test called the Census 2000 Supplementary Survey (C2SS). This mandatory, nationwide supplementary survey of approximately 700,000 households across the country is designed to demonstrate the operational feasibility of collecting long form data during the same time frame but in a process separate from the census. If Congress approves funding, this survey will continue in 2001 and 2002 and data from this survey will become part of a 2010 long form transitional database.
Operations
Like the decennial census long form survey, the ACS uses the most current version of the Census Bureau's Master Address File (MAF), a complete listing of all residential addresses and group quarters in the country, for sample selection. Methods of data collection are different, however, for the two surveys, because the ACS is conducted on an ongoing and continuous basis. The decennial long form survey is conducted once a decade and the data collected is published approximately two years later. The ACS collects data every month; data collected from January to December are combined to give an annual estimate. ACS data tabulations for a given year are posted on the Census Bureau's web site by July or August of the following year; a CD-ROM containing this data is available approximately December of the following year.
A sample of addresses is randomly selected each month to receive the American Community Survey. The monthly sample size is designed to approximate the sampling ratio of Census 2000, including the oversampling of small governmental units, such as American Indian Reservations. The sampling rate for the decennial long form ranges from 12.5 percent to 50 percent; the approximate ACS sampling rates in 2003 will range from 1.8 percent to 7.5 percent, with a 2.5 percent base rate (the base rate will be determined annually so that the annual total sample size is three million housing units). No address will receive the ACS questionnaire more than once in any five-year period.
Addresses selected to receive the ACS receive a prenotice letter followed approximately one week later by the ACS questionnaire. A reminder card is sent to these addresses about one week after the questionnaire is sent. A replacement questionnaire is mailed out if the original questionnaire is not returned. Follow-up procedures are initiated if these efforts do not result in a completed questionnaire being mailed back to a processing office. These follow-up procedures are, in order, first, computer assisted telephone interviewing (CATI), conducted approximately six weeks after the ACS is mailed, followed by computer assisted personal interviewing (CAPI) for a sample of the remaining addresses that have not responded.
Data Products
In 2003, once the ACS is in full operation, ACS data will be available every year for areas and population groups of 65,000 or more beginning in 2004 (Figure 2).
Figure 2. When Will My Community See Results From the American Community Survey 31-Site Comparison Study?
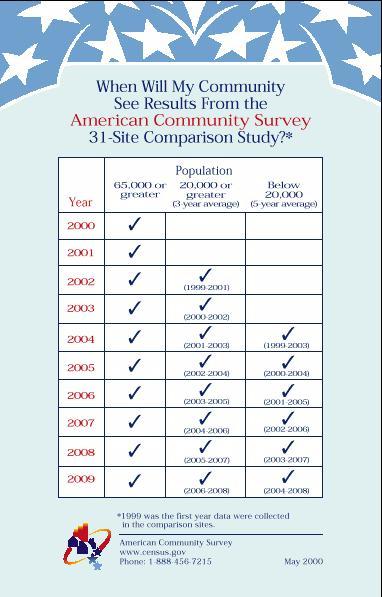
For small areas and population groups of 20,000 or less, it will take five years to accumulate a large enough sample to provide estimates with accuracy similar to the decennial census. That means that updated information for areas such as neighborhoods will be available starting in 2008 and every year thereafter (Figure 3).
Figure 3. When Will My Community See Results From the Full, Nationwide Implementation of the American Community Survey?
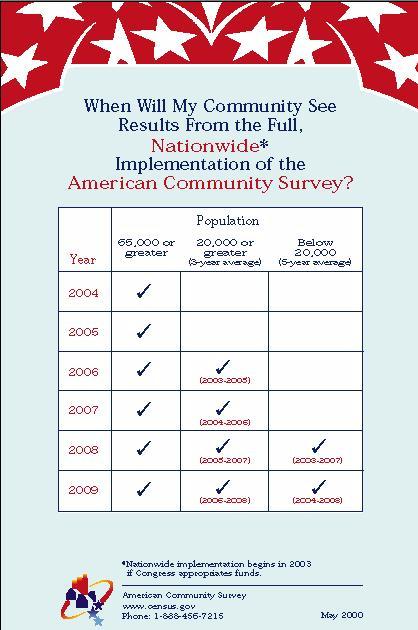
The goal of the ACS program is to disseminate data within six months of the end of a collection or calendar year. For states, counties, and other governmental units or population groups with a population of 65,000 or more, the ACS can provide direct estimates for each year. For smaller governmental units or population groups, estimates can be provided each year through refreshed multi-year accumulations of data. Plans also include the release of a Public Use Microdata Sample (PUMS). This microdata file includes as many records as possible and shows the lowest level of geography possible within confidentiality constraints. Users of the ACS data can customize tabulations to examine the information that best serves their needs. In addition, the ACS will provide summarized data for population and housing estimates, cross-tabulated by various characteristics, down to the block-group level. These data are designed to provide statistics with greater subject and geographic detail than is feasible or desirable in printed reports. Microdata files, tabulated files, and associated documentation are available on CD-ROM, as well as on a web site, http://www.census.gov/acs/www. The files may be directly downloaded into GIS software for use in applications.
Statistical Issues in Data Products for Geographic Areas
The ACS will publish data relating to economic, demographic, and housing characteristics of geographic areas as annual and multi-year estimates. A number of factors will determine what data is released, and for which areas data will be published.
Since the annual ACS sampling rate is much smaller than the long form rate, for quality and confidentiality reasons, it is not possible to publish single-year estimates for all geographic levels that Census 2000 will. In fact, it is only geographic areas having populations of 65,000 or more for which we will publish estimates using a single year of data. These areas have enough sample to meet our target standard error properties. What does this mean for smaller geographic areas? The Census Bureau must accumulate data over at least two years before attaining the target standard errors for estimates: at least two years for geographic areas of 30,000 to 64,999; three years for 20,000 to 29,999; four years for 15,000 to 19,999, and five years for all smaller areas. It is only by cumulating 5 years of data that we plan to publish estimates for the full range of geographical areas for which Census 2000 data is available. Each year, these averages will be updated by adding the most recent year's data and dropping the oldest data from the previous year's averages. This will result in a time series of averages to analyze and from which we can determine long-term trends. The interpretation of these multi-year average estimates is different from the single point in time estimates of the decennial census. Multi-year averages provide a general picture of change over time and reveal underlying trends in communities, for example, whether the average income of the population is increasing or decreasing. Data users will have to familiarize themselves with how to use these annual average time series appropriately. Even when cumulating over five years the data for a small place, the number of sample cases in that place will be somewhat smaller than it was for the long form, and, as a result, the standard errors will be larger.
Let's consider some statistical issues relating to specific geographic examples. Suppose the geographic boundaries for two different geographic entities, a city inside a county, for example, are nearly identical, and the areas formed by these boundaries nearly contiguous. If the Census Bureau published data for each entity, subtracting the estimates for one entity from those for the other entity would violate the confidentiality of data for the area representing the difference between the two areas. The Census Bureau must decide what data to publish in such a situation.
Geographic areas having populations of 30,000 to 64,999 will have data published for them as multi-year averages, because a single-year data estimate for such areas does not meet data quality standards. However, geographic areas having populations larger than 65,000 will have data published for them as single-year estimates. That means that should a data user want to compare geographic areas from these two size categories, the estimates would not be based on the same time period. In order to allow a more direct comparison, the geographic area larger than 65,000 will also have a multi-year average published, where the length of the multi-year average is the same as that for the area of 30,000 to 64,999. However, the availability of an estimate over more than one time period, where one period is a subset of the other, may introduce confidentiality concerns as explained below.
There are several options for publishing data for geographic areas having populations of 30,000 to 64,999. First, if the boundaries of a geographic area do not change, then we can use the data from housing units each year with the latest boundaries. Second, if the boundary changes between the first and the second years, we need to decide how to combine that data. We could use the data from all housing units each year within the latest boundaries. Or we could use data from the first year's housing units within the boundaries for that year, and data from the second year's housing units within the latest boundaries.
Consider a place having a population greater than 65,000 and having a boundary change resulting in an increase in area from one year to the next. Places of 65,000 may have single-year estimates and multi-year averages published for them. If we used the first option identified above, then by subtraction we can get the first year estimates for the additional area that was added in the boundary change. By using the second option identified above, this would not be possible and we can thus avoid confidentiality restrictions.
The issues raised for two-year averages also hold for longer averages. It is just the particular combinations of estimates leading to confidentiality violations that vary. There are more possible confidentiality problems if we publish estimates for all y-year averages with y = 2, 3, 4, 5. The advantage of dropping the 2- and 4- year averages is that no combination of adding and subtracting the published estimates that include a specified geography can result in an estimate for that geography that includes data from only a single year. From a user standpoint, it also has the advantage of reducing the array of multi-year estimates that are available to possibly cause confusion. In view of these advantages, the Census Bureau has decided not to publish 2- and 4- year data averages. Once the ACS has completed five years in full production, all areas will have estimates refreshed annually.
The ACS will require a systematic and automated method of identifying boundary changes that might cause confidentiality problems. Such a system will be necessary to ensure that the Census Bureau can easily review the magnitude of each boundary change and the number of persons affected by each boundary change. This review will make possible a decision regarding what data can be published.
Address Improvements to Support the ACS
A critical element in the overall success of the ACS is the ability to keep the Census Bureau's Master Address File (MAF) up-to-date and accurate from year to year. The MAF serves as the sole source of the housing unit sample for the ACS. In addition, the housing unit counts contained in the MAF play an important part in the editing, weighting, and data tabulation process. Thus, the overall accuracy of the MAF is a paramount concern.
The need for an up-to-date MAF spawned the development of a new program called the Community Address Updating System (CAUS). This program, which is currently under development, has two major objectives:
We estimate there are approximately 1.5 million new housing units per year nationwide. About 80 percent of these new housing units have city-style mailing address, and the remaining 20 percent have non city-style mailing addresses. New city-style mailing addresses can often be added to the MAF by matching the mailing address to our TIGER database, resulting in the assignment of geographic codes, known as geocodes, to that address. In other cases, it is necessary to insert new streets and the associated address ranges into the TIGER database before assigning the geocodes to these new addresses. Non city-style addresses present a greater challenge because these addresses cannot be geocoded using automated methods. These addresses generally require a field visit to verify the location of the new housing unit and assign the geocodes.
Under the current CAUS design, we plan to obtain the information on new housing units by working with county, tribal, and local governmental units. We will contact these governments each year and attempt to obtain a list of new housing units within their community. Our definition of new housing units includes those recently constructed, recently moved into a governmental unit, recently moved within a governmental unit, and recently converted from a nonresidential use to a residential use.
In addition, we plan to use other sources, such as the Delivery Sequence File produced by the US Postal Service (USPS), various administrative records files, and our current field representatives to obtain additional information about new housing units.
Where address lists of new units are not available from the county, tribal, or local governmental units, we will work with those governments to identify areas within the community where new growth has occurred. Our regional office staff will contact various offices within the community, in both the public and private sector, to obtain specific information about where new growth is occurring. Our field representatives who work on the ACS will then conduct targeted address listing operations to capture the address information in these growth areas.
The use of our experienced, permanent field representatives is expected to result in a better quality address list for two reasons. First, the field representatives working on CAUS will benefit from a continuing relationship with officials who are most knowledgeable about the growth in their community. Second, the field representatives who work on CAUS are the same representatives who travel throughout the community each month to conduct the nonresponse follow-up activities for the ACS and who possess some local knowledge about the community that they work in.
The second major objective of CAUS involves the update and correction of existing addresses in the MAF. As we use the MAF to conduct the ACS, we will note address records that require updates because of situations involving structures that were renumbered, apartment unit designations that have changed, the demolition of structures, street name changes, or incorrect geocodes. The field representatives will receive update assignments that will focus on checking the accuracy and completeness of all housing units within specific census blocks.
The local governments can play a key role in CAUS by providing address lists of new housing units or information on growth areas within their community. The local government participation is this program is voluntary, and it will benefit their community because it helps ensure that the entire community is part of the ongoing ACS.
The CAUS program includes a set of field procedures to update and correct the MAF, a control system for monitoring housing unit growth and scheduling update activities in each county or American Indian Reservation, and processing systems to update the MAF and the TIGER database. The program design will utilize three basic field update methods:
The "locate address" method will be used in areas where a county, tribal, or local governmental unit has provided an address list of new housing units. The lists of new housing units are processed and matched to our existing address file. The new addresses are provisionally added to the MAF, then sent to the field staff who will locate the address, verify the housing unit status, unduplicate the address with other MAF records, and assign the geocodes. The locate address method will be used in areas having both city-style and non city-style mailing addresses, although to a lesser degree in city-style areas.
The "find growth" method will be employed in areas where no county, tribal, or local governmental unit list is available. The field staff will identify areas of new growth through a process known as "targeting." The targeting process uses a variety of information sources, such as local officials, local community agencies, population estimates, USPS mail delivery statistics, and administrative records, to identify areas where new housing unit growth is present. The local communities are a critical source of information for the field staff as most communities are well aware of where the new growth is occurring. Using this targeting information, the field representatives will identify the specific geographic areas where the growth has occurred and begin to update the MAF in these areas. These geographic areas could be a ZIP Code, a new housing subdivision, a census tract, or clusters of census blocks.
The third CAUS update method is "update block." This method is used in specific census blocks where we have noted problems in the current MAF that require a field recanvass of the block in order to correct and update the address file. The update block assignments may result from problems noted during the monthly ACS activities, or via feedback from our field staff during their personal visit interviews in this block.
A key component of the CAUS update methods is our Automated Listing and Mapping Instrument (ALMI) which was developed to capture new addresses and address updates to the MAF, as well as corrections to our TIGER database. This instrument will operate on the same laptop computer that the field representatives use to conduct the ACS personal visit interviews and other current surveys. The use of the ALMI will allow the field staff to take an extract of the MAF and an extract of our TIGER database to the field with them. All updates and corrections are captured in an electronic format, making the transfer of this information more efficient and cost effective.
Under the aegis of the ACS, the initial CAUS program design and development began in 1998. During 1999, we conducted an initial small-scale developmental test in six counties to gain an increased understanding of our ability to acquire local address lists, and to update the MAF using various field methods.
In the Fall of 2000 we will conduct a second developmental test that includes 24 counties and a more refined set of field update methods. We will continue to gain experience in acquiring and processing local address lists, and in developing targeting methods. Our 2000 CAUS Field Test will be bolstered by the addition, from each Census Bureau Regional Office, of a CAUS geographer experienced in census address list development activities.
During 2001 we plan to conduct a pilot test in approximately 50 counties to refine the CAUS procedures in preparation for a large-scale implementation of CAUS in 2002. The actual implementation of the CAUS program is contingent upon the approval and receipt of the required funding to support this program.
ACS Benefits
The ACS brings the users of GIS technology a source of current, accurate demographic information to use in conjunction with a TIGER database. This will result in a powerful new tool for community decision-making, marketing, policy analysis, and the numerous other geographic applications that take advantage of census data.
The federal statistical system, as well as area estimates programs, also will benefit from the ACS. For example, the ACS can screen for households with specific characteristics. These households could be identified through the basic survey, or through the use of supplemental questions. Targeted households can then be candidates for follow-up interviews, thus providing a more robust sampling frame for other surveys. Prohibitively expensive screening interviews now required would no longer be necessary.
Data users have asked for timely data that provides consistent measures for all areas. Decennial data are out-of-date soon after they are published, about two years after the census is taken. Their usefulness declines every year thereafter. Yet billions of dollars in government and business dollars are divided among jurisdictions and population groups each year based on their social and economic profiles in the decennial census. With the ACS, communities, policy analysts, and businesses can use data to track the well-being of families and unique population groups, such as the elderly or Hispanic populations, to determine where to locate new highways, schools, and hospitals, to show a large corporation that a town has the workforce the company needs, to evaluate programs such as welfare and workforce diversification, and to monitor and publicize the results of federal, state, and local programs.
A Case Study in the Application of ACS Data
ACS data are already being used by a number of areas for local applications to benefit communities. One example concerns a state-mandated housing program sponsored by the Oregon Housing and Community Services Department (OHCSD). This program awards funds to housing developer applicants who submit their proposals in semi-annual competitions. In 1999 alone, the OHCSD provided grants and tax credits for 57 affordable housing developments; statewide, 439 housing units for the elderly and disabled were financed by the OHCSD.
One of the criteria in the OHCSD evaluation of proposals is the quality of their market studies demonstrating need for affordable housing. Applicants are required to collect and analyze a variety of community-level data including local demographics, employment trends, and rent structures in order to establish that the proposed development will fit the needs of the local market -- that of low-income households, elderly, disabled and other disadvantaged population subgroups. While only 1980 and 1990 data are required by the OHCSD, the applicants are encouraged to use "more current data" whenever possible.
With no detailed and straightforward guidelines available to applicants regarding the process of data collection, and the most recent community data collected being of 1990 vintage, many applicants have voiced frustration with the application process. Similarly, the OHCSD has expressed concerns over the quality of market studies and reliability of the data provided by the applicants.
It is in the light of these deficiencies of the program that the Population Research Center (PRC) of Portland State University was approached by a local affordable housing advocate and developer. The Center was asked to perform a market analysis to determine a need for low-income multi-family housing for an area within the City of Portland, OR. The purpose of the project was to produce an objective and comprehensive report that a developer could use to fulfill the requirements when applying for State funding for affordable housing development.
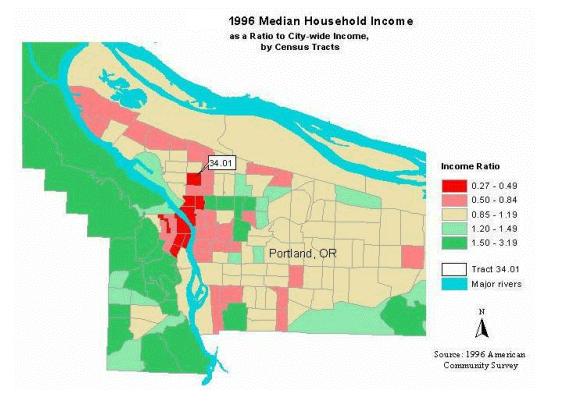
The PRC devised a systematic method of research producing a standardized affordable housing market assessment that could be used for any given area with regard to its recent demographic and socioeconomic trends and to its current housing situation. Besides the data collected by the 1980 and 1990 Censuses, the results of the 1996 ACS for Multnomah County, Oregon, were used in the analysis since the study area -- Census Tract 34.01 -- was located within the City and the County. Specific variables that influence and determine the need for affordable housing were analyzed. They include data on age, race and ethnicity of persons in households, household size and type, age of householder, employment status, adjusted household income, poverty status, vacancy and tenure of housing units, gross rent, gross rent as a percentage of household income, quality and age of housing, as well as related variables.
The availability of 1996 ACS data allowed the PRC to present very strong evidence of the need for affordable multi-family housing in Census Tract 34.01. The results of the analysis would have been a lot less convincing had it been based on only 1980 and 1990 data. In fact, some of the changes in the area were impossible to decipher if we were to produce 1996 estimates based on 1980-90 trends. For example, while during the 1980s the study area lost 15 percent of its residents, it sharply reversed the trend in the1990s and added over 500 persons, or 19 percent of its 1990 population, by 1996. During the same 6-year period, the area experienced a 6.5 percent increase in the number of persons below poverty, a rate somewhat lower than in the previous decade (14.3 percent during the period of 1980-90) (Figure 4).
Figure 4. 1996 Median Household Income
However, the number of households that paid 30 percent or more of their income on rent grew by 52 percent between 1990 and 1996.
Figure 5. 1996 Renter Households Paying 30% or More of Their Income on Rent
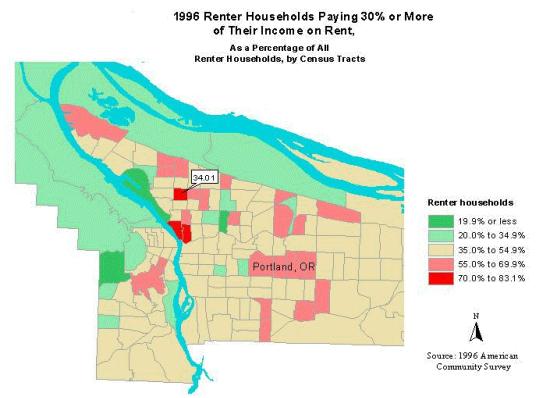
If we were to judge by the 1980-90 trend alone, we would have to estimate the 1990-to-1996 growth in such households at less than 3/4 of a percent -- a 70-fold difference! The number of vacant housing units in the study area decreased by 70 percent during the 1990-96 period, while it had grown by 55 percent during the previous decade. The number of renter-occupied units grew three times slower than owner-occupied units; in 1996 the rental housing vacancy rate was only 1.4 percent. The 1996 ACS data shows that over 70 percent of all renter households in the study area had 1996 income below a federally mandated minimum for 1-person households; since only 51 percent of all 716 renter households were one-person households in 1996, this estimate is conservative. Using the data from the ACS, the PRC was able to establish the need for 110-146 affordable housing units in the Census Tract 34.01.
In addition to fulfilling the needs of a particular affordable housing developer, the exposure of the study to other developers and government agencies has led to an increased awareness on the part of the OHCSD of the necessity of a standardized state-wide assessment of local need in affordable housing. This resulted in a request from the OHCSD that PRC create a series of Oregon Community Housing Profiles, a database and an analytical tool available for local communities and developers across the state. The Profiles were designed so they could be updated easily once the ACS is well established and produces community-level data on a regular basis. Availability of timely, detailed, comparative, and accurate governmental data at the local level via the ACS will be indispensable for the success of affordable housing programs in Oregon and elsewhere.
Conclusion
The ACS is well on its way to achieving its goal of providing timely annual economic, demographic, and housing characteristics information on the U.S. population to federal, state, and local decision makers. Assuming continued Congressional support for the necessary funding, the ACS will go nationwide in 2003. In 2004, the ACS will begin providing community profiles every year for geographic areas with populations greater than 65,000. By the year 2008, communities of all sizes will have profiles based upon multi-year estimates that will be updated every year. This will allow the American Community Survey to replace the long form in the 2010 census, thereby focusing that effort solely on counting the population.
Disclaimer
This paper reports the results of research and analysis undertaken by Census Bureau staff. It has undergone a more limited review than official Census Bureau publications. This report is released to inform interested parties of research and to encourage discussion.
Author Information
Nancy Torrieri, Ph.D. Program Analyst, American Community Survey Analytic Staff, Demographic Surveys Division, US Census Bureau. Phone: (301) 457-3602. Fax: (301) 457-2901. Nancy.K.Torrieri@ccMail.Census.Gov
Lynn Weidman, Ph.D. Chief, Continuous Measurement Design Branch, Demographic Statistical Methods Division, US Census Bureau. Phone: (301) 457-3600. Fax (301) 457-8611. Lynn.Weidman@ccMail.Census.Gov
Thomas Coughlin. Geographer, Continuous Measurement Office, Demographic Surveys Division, US Census Bureau. Phone (301) 457-8055. Fax (301) 457-8077. Thomas.M.Coughlin@ccMail.Census.Gov
K. Evan Moffett. Geographer, Continuous Measurement Office, Demographic Surveys Division, US Census Bureau. Phone (301) 457-8055. Fax (301) 457-8077. K.Evan.Moffett@ccMail.Census.Gov
Irina V. Sharkova, Ph.D. Research Assistant Professor, Population Research Center & School of Urban Studies and Planning, Portland State University. Phone (503) 725-5160. Fax: (503) 752-5162. sharkovai@pdx.edu
Risa Swirsky Proehl. Research Assistant, Center for Population Research, Portland State University. Phone: (503) 725-5103. Fax (503) 752-5162. proehlr@pdx.edu