Gavin Fleming
Marna van der Merwe
Spatial Disaggregation of Greenhouse Gas Emission Inventory Data for Africa South of the Equator
The aim of this project was to spatially disaggregate 1990 emissions inventory data to a 20km grid for Africa south of the equator and temporally extrapolate them on a monthly basis for the period 1999 to 2001. Southern Africa experiences a relatively closed atmospheric circulation that recirculates air over the subcontinent. Emissions from one region are therefore transported and deposited in other regions of southern Africa. There are several studies underway that aim to identify emission hotspots, understand emission-transportation-deposition dynamics and close the budgets of various nutrient cycles, especially that of nitrogen. These studies and the models they use require as input spatially and temporally disaggregated emission data. For most of the region the best available emissions data are those published for1990 National Emissions Inventories by signatory countries to the United Nations Framework Convention on Climate Change. The inventories state emissions of several greenhouse gas species broken down by sector and were developed independently by each country. Emissions from each sector, such as transport or electricity generation, were treated differently. ARC/INFO and GRID were used to model area and linear sources and to spatially disaggregate the emissions to known point sources, the modelled areal sources and the modelled linear transport sources. Emissions of each species were then extrapolated for the period 1999-2001 and decomposed into monthly figures, then totalled over all sectors.
Contents
Introduction
Methods
Results
Conclusions and Discussion
Appendix: Related Web Sites
References
Contacts
Introduction
Southern Africa experiences a relatively closed anticyclonic atmospheric recirculation (see Figure 1; (17)) that integrates emissions and recirculates air over the subcontinent, thousands of kilometers across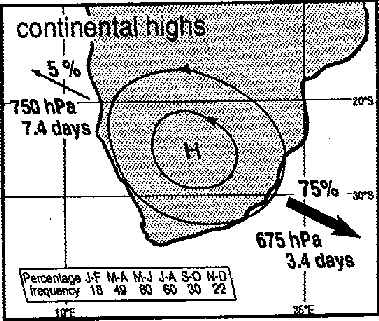 . Emissions from one region are therefore deposited in other regions of southern Africa. There are several studies underway that aim to identify emission hotspots, understand emission-transportation-deposition dynamics and close the budgets of various nutrient cycles (5,6; especially those of N and S) and investigate the impacts of trans-boundary air pollution. These studies and the models they use require as input quantified location, magnitude and timing data for all significant regional emission sources (6). SAFARI 2000 (Southern African Regional Science Initiative) will be the initial user of these data. It is an international project that aims to understand linkages among physical, chemical, biological and anthropogenic processes in southern African systems (5). The study described here provides the spatial anthropogenic emissions input into the broader SAFARI 2000 project. These anthopogenic emissions will be investigated along with biogenic and pyrogenic emissions and incorporated into atmospheric transport, transformation and deposition models. The new Terra2 satellite products will play an important role in SAFARI and the emissions database will play a role in the validation of these measured gaseous concentrations (5). The emission inventory could also provide guidance on the location of new monitoring sites.
The aim of this project was to spatially disaggregate 1990 national emissions inventory data to a 20km grid for Africa south of the equator and temporally extrapolate them on a monthly basis for the period 1999 to 2001. This will partially answer two SAFARI 2000 'science questions', namely "What are the sources, magnitudes, locations and temporal patterns of aerosol and trace gas emissions to the atmosphere in southern Africa" and "What are the main urban, industrial and transport activities within southern Africa responsible for aerosol and trace gas emissions and what are the magnitudes of these sources?" (5).
Back to top
Methods
Build database
Data was gathered from various sources (Table 1) and processed until all spatial data to be used in the model were in 20km GRIDs, registered to the same point and in Albers projection (central meridian 25o, 1st parallel -30o; 2nd parallel -6o; Cape datum).
Table 1: Data sets used
| Data set |
Type |
Attributes |
Source |
| 1990 Greenhouse Gas Emission Inventory |
Table |
Emissions (Gigagrams) in 1990 of CO2, CH4, N2O, NOx, CO, NMVOC, SO2 per country. |
National government departments responsible for the national greenhouse gas emissions inventories as part of countries' obligations under the UNFCCC (4,19)
|
| Roads and railways |
Arc coverage |
Class |
Surveyor General of South Africa, DCW |
| 1990 Population Density |
GRID |
People / km2 |
UNEP |
| Thermal Power Stations |
Point coverage |
Capacity (MW) |
Eskom, Esri, (14) |
| Vehicle density |
Table |
Cars per 1000 people per country |
Newsweek |
| Mines |
Point coverage |
Mineral mined (mainly coal); quantity; emission factors where possible. |
Surveyor General of South Africa, various maps and publications |
| Industry |
Point coverage |
Type of industry and emissions (mainly smelters) |
(14) |
| Base data, e.g. country boundaries |
Polygon coverage |
various |
DCW |
| Reported or measured emissions |
GRID |
species and emissions |
GEIA, DEAT (SA), CSIR, (15) |
The Inventory data was available only for South Africa at this stage. These South African data together with emission figures from various sources and estimates were compiled into an INFO table that stored Country, Emission Species and Emission Values for each of the following sectors for 1990. The methodology followed and sectors included in the inventory were done according to the guidelines provided by the IPCC (16). All countries that signed and ratified the UNFCCC (19) are required to follow these guidelines in order to compare emissions on an equal basis:
- Energy: Fuel Combustion: Energy Industries
- Energy: Fuel Combustion: Manufacturing Industries
- Energy: Fuel Combustion: Transport
- Energy: Fuel Combustion: Other Sectors (where fuel combustion sources were not included under the abovementioned headings)
- Energy: Fuel Combustion: Other (mining)
- Energy: Fugitive Emissions from Fuels: Solid Fuels (such as charcoal production and coal mining)
- Energy: Fugitive Emissions from Fuels: Oil and Natural Gas (mainly petroleum refining)
- Industrial Processes: Mineral Products (non-energy-related emissions)
- Industrial Processes: Chemical Industry (non-energy-related emissions)
- Industrial Processes: Metal Production (non-energy-related emissions)
- Industrial Processes: Other Production (non-energy-related emissions)
- Solvent and Other Product Use (mainly volatile emissions)
Emissions of SO2 in 1990 from various sectors were obtained (1;2;3;14) and included in the emissions database for Botswana, Lesotho, Mozambique, Namibia, Swaziland and Zimbabwe. Zambian SO2 emissions were obtained from the mineral industries sector only (1;2;3;20). These were averaged to provide sample values for other countries in the study area. Though they were not standard emission inventory values they provide examples that enabled disaggregation to occur in countries other than South Africa for the purpose of this paper.
Set up master country GRID
To facilitate modelling emissions in all countries simultaneously and keeping all spatial inventories in one contiguous data set, a zone GRID was created in which each country represents a homogeneous zone. A 100km buffer zone was created beyond the study area to allow for the inclusion of offshore sources such as oil rigs at a later stage. This zone GRID was used in most operations. With it, for example, spatial driver values or emissions could be summed by country or country-specific emission values could be read via relates to the emissions INFO database during GRID operations.
Derive Spatial Driver Surfaces
The spatial distribution of emission sources in each sector varies. Therefore, a sector-specific surface was modelled where possible. Each cell in a 'spatial driver' GRID represents the proportion of the country's total emissions for all emission species in that sector. These spatial driver surfaces were modelled for Energy Industries, Transport, Domestic Biomass Combustion and Mineral Industries (the latter for SO2 only). Emission sources can be grouped into point and area sources.
Energy Industries
These are examples of point source emissions, whose location can be defined by a geographic coordinate. They are spatially distinguishable and thus do not need to be disaggregated themselves (13). Other point sources are mines and some industries.
A point coverage representing all thermal power stations in the sudy area was compiled (Fig 2). Generating capacity was used as a proxy for emissions. POINTSTATS was used in GRID to create a 20km grid of power generation capacity. This function summed generation capacity where more than one power station was present in a cell. This GRID was then divided by the total generating capacity per country to give the driver surface in which each cell represents a proportion of its country's emissions in this sector.
 Figure 2: Map showing thermal power emission sources, classified by energy production capacity.
Transport
An arc coverage representing roads and railways was weighted according to the type of road, with National Highways receiving the highest weight and dirt tracks the lowest. LINEDENSITY was used in GRID to derive a GRID representing weighted length of transport network per grid cell. Next, A GRID of cars per thousand people was multiplied by a GRID of population density (people / km2)to estimate the number of cars per grid cell. Finally the GRID representing number of cars was multiplied by the transport network density GRID to further weight the transport network according to the distribution of cars. This GRID was then divided by the country totals (derived with ZONALSUM) to get the proportion that each cell contributes to the country's transport emissions (Fig 3; Fig 5). For this study it was assumed that all vehicles are restricted to roads and that the intensity of vehicle use and thus emissions was directly proportional to the population density, road density (km / grid cell) and road type.
 Figure 3: Map showing the transport driver surface. The log10 of the proportions are shown to allow the whole range to be visualised. As in all the figures, each country is treated independently. The surface in South Africa is spread more since input data on more road types was available.
Other Sectors (domestic biomass combustion and the domestic use of coal for energy purposes)
Population density was used as a proxy for domestic biomass and coal burning (10). Population density was divided by total population to get the proportion each cell contributes to national domestic combustion emissions. We will improve this model by classifying population into urban and rural and by including data on fuel types and fuel use habits (10). Population density and hence domestic biomasss combustion is an example of an area emission source. These either come from a continuous surface such as soil or vegetation or veld fires, or from many points that cannot be distinguished. Most non-point-source anthropogenic emissions, including domestic combustion, fall into the latter category (13).
 Figure 4: Map showing the biomass driver surface. The log10 of the proportions are shown to allow the whole range to be visualised.
Other sectors
For South Africa only, a proxy consisting of reported emission distributions per emission species was used for all other sectors, since information to build sector-specific spatial driver surfaces (mainly industry locations) was unavailable.
Previous related work includes the development of a 1o resolution SO2 emissions inventory for southern Africa (14). This study used similar information to estimate point and area sources. As with (14), accurate data is unavailable or inaccessible at the time of this study for the industrial sector, which contributes emissions through energy production and operational processes.
Temporal extrapolation and disaggregation
Proxies of economic growth in the sectors contributing most to each emission species were used to apply simple exponential growth of national emissions to the study years (4,18; Table 2), whereupon national totals were disaggregated again. To do this we assumed that the rate of emission increase is the same as the rate of economic growth in that sector. Some known changes in emissions, for example a reduction in CO and NMVOC emissions from 1996, were taken into account. Otherwise we assumed that change in emissions was consistent from year to year and among emission species and sectors as well as being equal throughout each country.
Table 2: Temporal extrapolation factors used
| Emission species |
Rate of change |
Reference |
| CO2 |
6 |
Since electricity generation is the main source of CO2, nearly 60% of total national emissions, we used the mean annual increase from 1994 - 1997 of Eskom (4,18) as the estimate of annual increase in all sectors and species (see below). |
| N2O |
1.5 |
Eskom is a relatively small contributor (18% of national total). Transport is the major source. |
| CH4 |
1.5 |
See CO2. Eskom contributes 35% to national total. Coal mining is the major source within these anthropogenic sectors, nearly 60%. |
| SO2 |
6 |
See CO2. (Electricity contributes about 73% to the national total) |
| NOx |
6 |
See CO2. (Electricity contributes about 47% to the national total) |
| CO |
1990 - 1996 use 5% (+), 1997 -2001 use 1.5% (-)/yr |
Transport contribute about 48% to national total, and 62% within the industrial and mobile sectors. Petrol and diesel consumption was increasing at about 5% per year from 1990 - 1996 and since 1997 it declined by 2%. This is based on national diesel and petrol consumption and not vehicle sales. |
| NMVOC |
1990 - 1996 use 5% (+), 1997 -2001 use 1.5% (-)/yr |
Transport & industry contribute 45% (of which road transport is the major source & 15% respectively, ie. 60% in total of national total. See CO |
Very little data on within-year variation in emissions could be obtained. At this stage monthly emissions for each of the study years are simply 1/12th of annual emissions. Once monthly or seasonal distributions become available, we will apply these to obtain more accurate within-year temporal disaggregation.
Automation
Once the database and workspace structure was standardised, AMLs were written to automate the creation of spatial driver surfaces, disaggregation of emission values from the database and temporal extrapolation and disaggregation. Figure 5 shows the model that the AMLs follow.
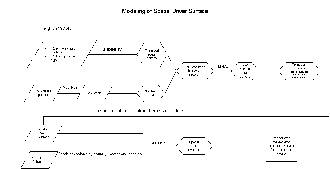 Figure 5: Model of the process used to create the emission inventory described in this study.
Back to top
Results
The model is structured so that one can edit the emissions database and edit or replace driver surfaces or annual rates of change and run the AMLs to recreate the output database, reflecting any changes made. While the input of a model run consists of emission values from the database, spatial driver grids and temporal driver values, the output consists of one workspace per emission species that contains grids for every sector, for each year (1990, 1999, 2000, 2001). Figure 6 shows the 1990 SO2 emissions from one sector.
 Figure 6: Map showing Log10 1990 SO2 emissions from sector 2a (mineral industries).
In addition, monthly and annual totals over all sectors are output. Figure 7 shows 1990 SO2 emissions summed over all sectors.
 Figure 7: Log10 1990 SO2 emissions summed over all sectors.
In the case of transport emissions, the fact that different density data (e.g. roads) were available from each country does not make a difference to the total emissions in a country, as the road density function and subsequent normalisation resulted in cells representing proportion of road length per country. Thus all emissions remain accounted for, which fulfils one aim of this study. More accurate density data such as those that were available for roads in South Africa serves to spread that national emission over a wider area, retaining the total yet diluting it (Fig 3).
Simple comparisons from the annual total grids have been made at this stage with measured data. Points were investigated ad hoc and their values compared with those of corresponding and neighbouring cells in a grid of measured SO2 emissions (15). This test was by no means robust, yet values were close considering that errors and inaccuracies can easily result in emissions being assigned to neighbouring cells in different studies and that unless measured emissions reflect source emissions, they inevitably include some ambient emissions transported from other sources.
Back to top
Conclusions and Discussion
National Greenhouse Gas Inventory data was derived using standardised procedures involving top-down (this approach is used to calculate CO2 emissions based on the total national consumption of fossil fuels) and bottom-up (this approach is used to calculate non-CO2 emissions which are process dependent, as well as CO2 to be used as a check, i.e. comparing the CO2 emissions calculated in two different ways) calculation of emissions according to the Intergovernmental Panel on Climate Change guidelines (16). The reasons for using these as baseline data were that they would be consistent among countries and in most cases were the only integrated data sets available. They also are the baseline that mitigation activities will aim toward achieving. In other similar studies (7,12) detailed local emission inventories and models have been developed prior to spatially disaggregating the emissions. For the purposes of this presentation the database was populated with non-Greenhouse Gas Emission Inventory values for several countries, since the emission inventories for these countries were not published officially. Once these data are available, they can be loaded into the database and the model run again. This will bring the output of the model to a level that is consistent among countries.
Where addresses and detailed descriptions of emissions sources are known, address geocoding can be used to allocate emissions to specific points (11). For this study, however, an address-coded street database of South Africa was not available. Where point sources were known, these were captured from published coordinates or digitised. Areas and lines were obtained from published data sources. A resolution of 20km was chosen because that is roughly the input resolution required by air transport models and is sufficient to give an indication of where emissions are occurring on a regional scale while at the same time smoothing out errors introduced through slight inaccuracies in emission allocation to points or small areas. This resolution also resulted in a small overall number of grid cells, allowing for rapid processing in a large spatial extent stretching from the equator to the southern tip of Africa. The time and budget available and the requirements of the emissions database users did not warrant returning to the individual inputs to the National Greenhouse Gas Emissions Inventories. The objective was to find a quick method to spread emissions in a first attempt that can be subsequently improved. Other methods are described in (7).
The overall accuracy of the output of this model varies among sectors and emission species and is difficult to quantify because of the accumulation of errors inherent in the creation of the input data and in the modelling process. Input data were derived from various sources for this preliminary presentation of results and many were missing. Once officially published 1990 emission inventories are obtained, the input errors will be identifiable and will be due to errors in actual emission data and emission factors used to compile the inventories. Modelling techniques used to derive spatial driver surfaces and temporal change factors are open for improvement. Despite this, the major sources of emissions, which also have a higher degree of accuracy associated with them, have been included and nothing has been lost from each country totals.
In the case of transport emissions, this study disaggregated national inventory totals according to modelled activities, as opposed to combining emission factors with activity (7). Ideally, road use, driving modes, fleet size and other statistics should be used to model transport emissions accurately (12). These are available in South Africa at municipal level but not at a national scale suitable for this project. Fuel sales data and road use data will improve the transport emission allocation.
Further validation and calibration of the disaggregation model needs to be conducted on modelled and measured data sets (8,13). Improved temporal disaggregation will be achieved by simulating emission generating activities with continuous functions (9).
Back to top
Acknowledgments
We would like to thank the SAFARI 2000 LEAD project for funding the research and the CSIR and the SAFARI 2000 LEAD project for funding this paper and G.Fleming's conference attendance.
Appendix: Related Web Sites
SAFARI 2000
CSIR: Environmentek
Back to top
References
- Burger,L.W. and L.A. Coetzee. 1997. Proposed Konkola Deep Mine and Upgrading of Mufulira Smelter - Zambia. Impact Assessment Report: Air pollution. Environmental Management Services cc. South Africa.(Zambian smelter emissions)
- SADC-ELMS (Southern African Development Community - Environmental and Land Management Sector) et al. 1998. The Policy dialogue on the Prevention and Control of Regional Air Pollution inf Southern Africa and its Likely Transboundary Effects. p.51.
- Masinja, J.H. The Dilemma of Development, Air Pollution and Environmental Sustainability in the Southern Africa Region, in SADC-ELMS and others. The Policy dialogue on the Prevention and Control of Regional Air Pollution in Southern Africa and its Likely Transboundary Effects. 1998.
- van der Merwe, M.R. and Scholes, R.J. (eds) 1999. South African Country Study, Phase 1: Greenhouse Gas Emission Inventory for the year 1990. Unpublished report done for the National Committee on Climate Change of the Department of Environment Affairs and Tourism.
- Swap,R.J and H.J. Annegarn. 1999. Southern African Regional Science Initiative: Safari 2000: Science Plan. http://safari.gecp.virginia.edu/
- Scholes, R.J. and Otter, L. 1999. SAFARI 2000: Nitrogen and sulphur deposition in southern Africa. Science plan for the SAFARI LEAD project, CSIR.
- California Air Resources Board Emissions Inventory and related websites. http://www.arb.ca.gov/emisinv/eib.htm
- Dignon, J. and G.R. Major. 1996. NOx and SO2 emission databases for atmospheric chemistry studies from the Lawrence Livermore National Laboratory. http//:www.neonet.nl/ceos-idn/datasets/LLNL_TRACE_GAS.html
- Kalchmayr, M. and R. Orthofer. 1997. The use of continuous functions for a top-down temporal disaggregation of emission inventories. Seibersdorf Report OEFZS-A--4239, November 1997. Published in Emission Inventory: Living in a global environment; AWMA Publ. July 1999, p. 1209-1219. ISBN 0-923204-18-0.
- Marufu, L., J. Ludwig, M.O. Andreae, J. Lelieveld and G. Helas. 1990. Spatial and temporal variation in domestic biofuel consumption rates and patterns in Zimbabwe: implications for atmospheric trace gas emission. Biomass and Bioenergy 16: 311-332.
- Dai, J. and Rocke, D.M. 1997. Using GIS to Evaluate Spatial Variations in Area Source Emissions. Esri User Conference 1997 Proceedings.
http://www.Esri.com/library/userconf/proc97/proc97/to400/pap367/p367.htm
- Lindley, S. 1997. Development of a spatially resolved
emissions inventory for the north west of England and its role in local air quality
management. Atmospheric Research and Information Centre, Manchester Metropolitan University. http://www.doc.mmu.ac.uk/aric/phdsjl.html
- AEA Technology. National Atmospheric Emission Mapping. http://www.aeat.co.uk/netcen/airqual/emissions/mapping.html
- Sivertsen, B., C. Matale and L.M.R. Pereira. 1995. Sulphur emissions and transfrontier air pollution in southern Africa. Report 35: Southern African Development Community Environment and Land Management Sector.
- Wells, RB, Lloyd SM and Turner CR, 1996. National air pollution source inventory (Inventory of Scheduled Processes), in Air Polution and its Impacts on the South African Highveld, eds G Held, BJ Gore, AD Surridge, GR Tosen, CR Turner and RD Walmsley. Environmental Scientific Association, Cleveland, 144pp.
- Intergovernmental Panel on Climate Change (IPCC). 1996. Revised guidelines for national greenhouse gas inventories.http://www.ipcc.ch
- Tyson, P.D, M. Garstang, R. Swap, P. Kallberg and M. Edwards 1996. An air transport climatology for subtropical southern Africa. Int. J. Climat. 16: 265-291.
- Eskom http://www.eskom.co.za/envreport98
- UNFCCC http://www.unfccc.de
- Meter, S. 2000. Thesis in preparation on emissions in the Zambian Copperbelt. Schonland Research Centre, University of the Witwatersrand.
Back to top
Gavin Fleming
GIS specialist / Environmental Modeller
CSIR: Division of Water, Environment and Forest Technology
Box 395
Pretoria
0001
South Africa
Tel: +27-12-841-2489
Fax: +27-12-841-2028
e-mail: gfleming@csir.co.za
Marna van der Merwe
Systems analyst
CSIR: Division of Water, Environment and Forest Technology
Box 395
Pretoria
0001
South Africa
Tel: +27-12-841-3397
Fax: +27-12-841-2028
e-mail: mvdmerw@csir.co.za
Back to top


