The purpose of the following tactics, techniques, and procedures (TTP) is to present terrain analysis options for units who do not have access to U.S. Army topographic units, in particular Army Reserve and Army National Guard units. The TTP discusses the development of three tactical decision aids (TDAs) using the combined functions of two software packages which can be downloaded from the WWW -- ArcExplorer™ and NIMAMUSE™.
NIMAMUSE™ is primarily used to develop ArcView™ shapefiles, although it has the ability to develop a whole host of terrain-related functions, some similar to TerraBase™. ArcExplorer™ is used to develop terrain overlays, perform some vector analysis, and export graphic images for terrain briefings for use with software packages such as Microsoft's® PowerPoint®. When combined with the terrain visualization features of the U.S. Army's TerraBase II, soldiers can develop a wide range of terrain TDAs such as slope, vegetation, cover and concealment, and hydrology overlays. The combined use of ArcExplorer™, NIMAMUSE™, and TerraBase II allows soldiers the ability to develop and produce a wide range of TDAs in a manner that enhances terrain analysis as part of an intelligence preparation of the battlefield (IPB).
The function of the U.S. Army's terrain teams is to provide battlefield commanders with terrain analysis products to support tactical decisions. In the past, these products were created manually through a process that is time consuming and requires a great deal of skill on the part of the analyst. With the advent of topographic systems such as the U.S. Army's Digital Topographic Support System (DTSS), TDAs can be produced and provided to the battlefield commander in a less time-consuming manner. That is, of course, if the commander has access to a topographic unit. Many engineer and intelligence soldiers (in particular Army Reserve and Army National Guard units) lack accessibility to army topographic units and the terrain products they provide. For those warfighters, terrain analysis is relegated back to evaluating the terrain through a map analysis, which provides little or no terrain visualization for the commander. It is to those warfighters that this TTP is directed, although the TTPs discussed are equally useful to all warfighting soldiers.
The first step is knowing what data is available and where the data exists. The National Imagery and Mapping Agency (NIMA) is the proponent agency for digital data. NIMA's digital data products are commonly produced on CD-ROM in raster and vector format.
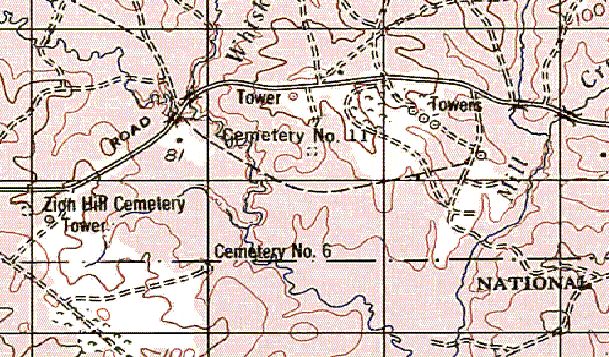
Raster data (see Figure 1) is a rectangular picture of something made up of many tiny colored dots which, when viewed together, looks like a smooth, cohesive picture to the human eye. A television screen and a computer screen are good examples of a raster of colored dots, which define a picture for your eye. A raster format product is sometimes considered a dumb map because it is a picture of a map. NIMA produces several raster data formats: ARC Digitized Raster Graphics (ADRG), Compressed ARC Digitized Raster Graphic (CADRG), and Controlled Image Base (CIB) are the most common.
ADRG data consists of raster images and other graphics generated by scanning source documents. The typical source documents for ADRG are existing hard copy charts produced by NIMA at various scales from 1:100,000 to 1:50,000 Some of the most desirable/functional of these are the TLM-50s or Topographic Line Maps at 1:50,0000. These can be used in conjunction with NIMA's vector products and Digital Terrain Elevation Data (DTED) to produce a fairly complete database.
Figure 1: Raster image of Joint Readiness Training Center, LA - Scale 1:25,000
CADRG is a general-purpose product consisting of computer-readable digital map and chart images conforming to the ARC projection system. CADRG area data is derived directly from ADRG and other digital sources through downsampling, diltering, compression, and reformatting to the Raster Product Format (RPF) standard.
CIB images are panchromatic (grayscale) images, which have been georeferenced and corrected for distortion due to topographic relief. They are similar to digital orthophoto quads and have similar applications, such as serving as a base or backdrop for other data or as a simple map.
Vector data (see Figure 2) is a positional list of all of the cultural and physical features and objects of interest in a given area. When portrayed on a computer screen, all of the features and objects appear in the proper physical relationship to each other. Vector format product is a smart map because it contains added information that further descries a particular map feature, such as a road or bridge. For tactical users, NIMA's Vector Product Interim Data (VITD), Vector Map (VMap) data, and Feature Foundation Data (FFD) are the most important.
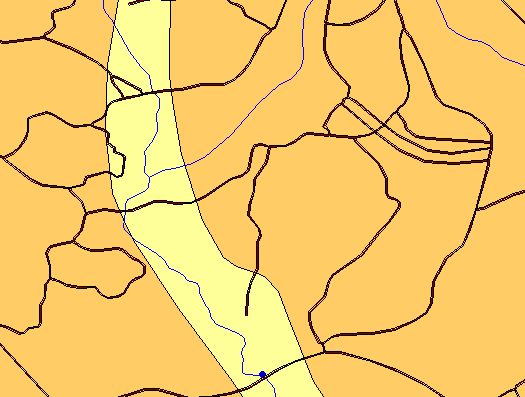
Figure 2: Vector image of Joint Readiness Training Center, LA - Scale 1:25,000
Intelligence and engineer soldiers should be familiar with the Tactical Terrain Analysis Data Bases (TTADB) which were produced by the Defense Mapping Agency (DMA) and consisted of seven hard copy overlays: cross-country mobility, transportation systems, vegetation type and distribution, surface drainage and configuration, surface materials (soils), ground water, and obstacles. The TTADBs were converted to Interim Terrain Data (ITD), which now have been converted to VITD.
VITD is simple ITD in a new VPF (Vector Product Format) and distributed on CD-ROM. What is nice about VITD is its ability to be used in conjunction with DTED, ADRG base maps, and CIB. VITD is produced to support both strategic and tactical ground operations and applications including terrain analysis, cross-country mobility modeling, and visibility studies.
VMAP (Levels 0-2) data is a collection of databases that provide vector-based geospatial data at low, medium, or high resolution. These data are separated into nine thematic layers (boundaries, elevation, hydrography, industry, physiography, population, transportation, utilities, and vegetation) and are topologically structured. The VMap Level 0 database is designed to provide vector-based geospatial data of the entire world's land mass at low resolution. The VMap Level 1 data is designed to provide vector-based geospatial data at medium resolution, and the VMap Level 2 data is designed to provide vector-based geospatial data at high resolution.
FFD are key natural or manmade features, which are represented in a vector file as a point, line, polygon, or text. The features are positioned accurately, based on source material. Within this data set, features include transportation and surface drainage networks, vegetation, built-up areas, international boundaries, and selected spot elevation data. Many of these features contain attributes, which further characterize information associated with the feature. For example, a road would be depicted as a line and would carry attributes which describe its location, surface material, and operational status.
Lastly, there is the Digital Terrain Elevation Data, or DTED, which users of TerraBase are most familiar. DTED is a uniform matrix of terrain elevation values. DTED was originally developed in the 1970s to support aircraft radar simulation and prediction. However, DTED now provides basic quantitative data for all military systems (such as Fort Leonard Wood's TerraBase) that require terrain elevation, slope, and/or surface roughness information. There is a large amount of DTED available at various scales for a large portion of the world. These data are very useful for a variety of applications including visibility and intervisibility studies, observation and fields of fire overlays, and providing a foundation for cross-country mobility modeling. DTED Level 1 has a post spacing of 3 seconds or 100 meters. DTED Level 2 has a post spacing of 1 second or 30 meters.
Most intelligence soldiers are aware of TerraBase II, developed by the U.S. Army Engineer School. TerraBase II is a terrain evaluation tool for the exploitation of readily available NIMA standard grid and raster products, namely Digital Terrain Elevation Data (DTED). TerraBase allows soldiers to produce a wide variety of TDAs to include: line of site (LOS) overlays, weapons fans/visible area plots (VAP), oblique and perspective views, elevation tints, contour plots, slope tints, and reflectance plots.
NIMA's Mapping, Charting, and Geodesy Utility Software Environment (MUSE) software utilities like TerraBase II, represent an effort by NIMA to develop a standard suite of software to access its digital data sets and work with standard NIMA datum transformations and coordinate conversions. MUSE consists of eight utilities, three of which are discussed, in this TTP.
To operate the Raster Importer, you need to (1) identify one of eight types of NIMA rater data (ADRG, ADRI, CIB, CAC, CADRG, DBDB5, DBDBV, or DTED) you are importing, (2) select one of four methods of geographic area definition, and (3) select an output format (ArcView™ Rater).
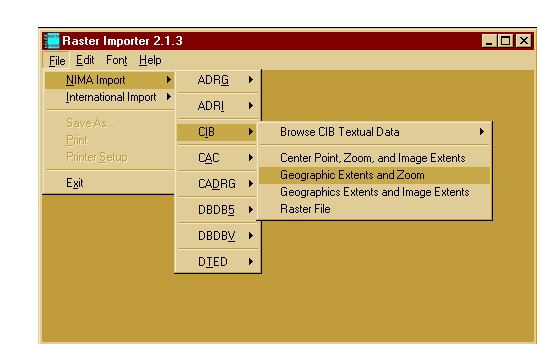
Figure 3: NIMAMUSE Rater Importer
To operate the Vector Importer, you need to (1) identify one of the nine types of NIMA VPF vector data you are importing; (2) pre-set the output format; (3) select the VPF library (map sheet), VPF coverage (obstacles, slope/surface configuration, soils/surface materials, surface drainage, transportation, or vegetation), and VPF feature class you are interested in (rivers, streams, roads, slope, etc.); and (4) identify the geographic extents from which your vector data is selected.
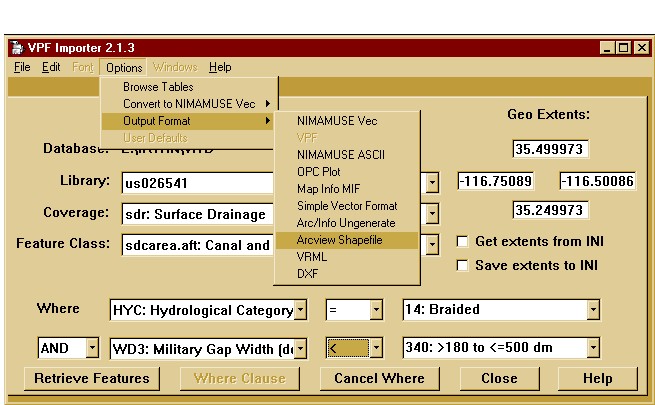
Figure 4: NIMAMUSE™ VPF Importer
The MUSE suite of software also has utilities that allows you to drape rater data (like CADRG) over elevation data (DTED) to obtain a 3D appearance and perform visibility analysis (PSCENE & LOS) similar to TerraBase.
ArcExplorer™ is a geographic data explorer/viewer developed by Environmental Systems Research Institute, Inc. (Esri). With the ArcExplorer™ suite of tools you can:
ArcExplorer™ is a Windows® desktop application and can be downloaded from Esri's Web page. Figure 5 shows ArcExplorer™ being used to view MrSids imagery data of the National Training Center, Fort Irwin, California, which has been overlaid with a cross country movement (CCM) theme and an annotation layer showing key terrain features.
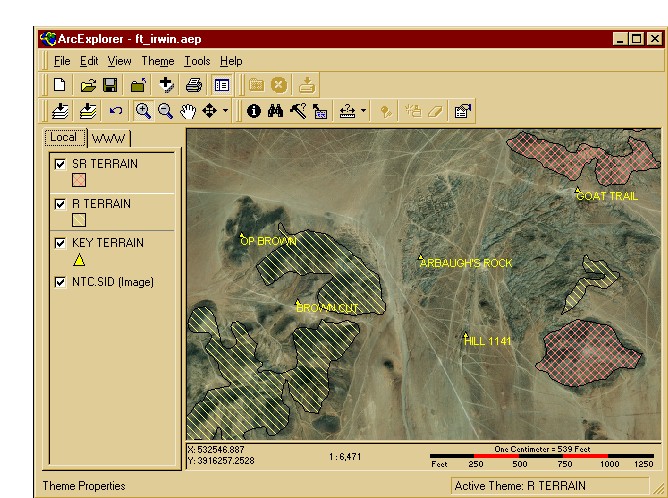
Figure 5: Esri's ArcExplorer™ GIS Viewer
Terrain Analysis
A great deal has been written about ". . . briefing a good picture of the battlefield," ". . . illuminating the effects of terrain," preparing terrain mission folders, and developing non-standard terrain products. However, a 1:50,000-scale map, some PowerPoint® graphics, and six Staedtler pens will only go so far. With that, the following paragraphs and figures provide a brief overview of the sort of terrain products available.
Visualize the Terrain
In a joint article titled "Intelligence Preparation of the Battlefield with a Purpose," LTC Smith and MAJ Puppolo write that S2's should not "brief a MCOO," but rather should "take their commanders on a tour." Most S2's are relegated to briefing enemy courses of action via their modified combined obstacles overlay (MCOO), a two-dimensional lifeless sheet of acetate. On the other hand, by utilizing the MCOO to provide the overall picture, an S2 can supplement the briefing with key snapshots to provide the commander a truly visual feel of the terrain.
Figure 5 provides such a snapshot. The slide was developed first by extracting imagery from using MUSE Raster Importer and then saving it as an ArcView™ Raster Format. ArcExplorer™ was then used to import the rater image (which is geographically correct in decimal degrees) to which the key terrain features were added. Once the raster image is loaded into ArcExplorer™, users can pan or zoom in and out to obtain the image they need. The image was then exported as a *.BMP file to add the OPFOR graphics and to import the file into a PowerPoint® briefing.
Bridge and Fording Site Analysis
A staff engineer looking at potential fording sites requires a surface drainage overlay detailing the river and stream widths, depths, velocity (meters per second), bottom composition, and bank slopes. Figure 6 depicts an example of a surface drainage overly that was overlaid onto a MrSIDs image using ArcExplorer™. The rivers and stream theme provides drainage codes (122221111) that describe the river and/or stream type (intermittent, braided, etc.), military gap (meters), the channel bottom material (clay, sand, rock, paved, etc.), the height of the banks (meters), the bank slopes (percent), the channel's average velocity (meters per second), and the average depth (meters). For example the fording sites at 15RWQ0065442420 and 15RWQ0112842177 indicates that the streams located at these points are intermittent (1st digit -1), 4.5 to 18 meters wide (2nd digit - 2) with silty/sand bottoms (3rd digit - 2). The right and left bank heights are 0.5 to 1.0 meters (4th and 5th digits - 2/2), with banks slopes less than 30 percent for both the right and left sides (6th and 7th digits - 1/1). The streams average velocity is less than 1.5 meters/second (8th digit - 1) with an average water depth of less than 0.8 meters (9th digit - 1).
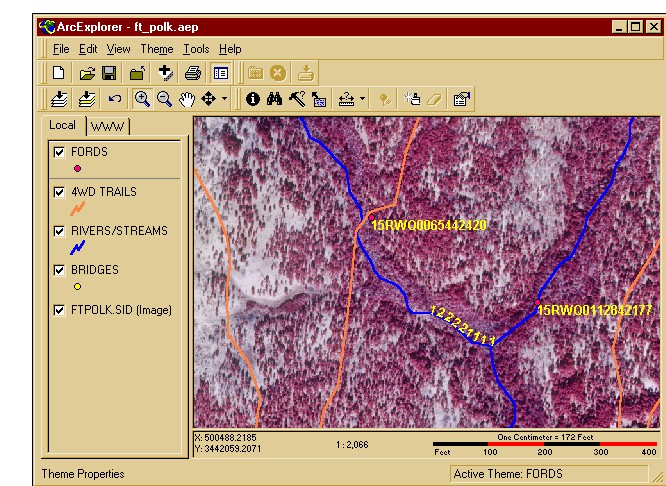
Figure 6: Surface Drainage/Trails/Ford themes draped over a MrSIDs raster image
Line of Communication (LOC) Overlay
Maintaining and improving main supply and alternate supply routes (MSRs/ASRs) is a big job for an engineer group. The engineer and intelligence staff needs to determine where key bridges and fording sites are located, the location of steep gradients and sharp curves which might impede movement, and MSR/ASR load characteristics. The LOC overlay shown in Figure 7 shows the commander a key bridge with a military load class of 30 tons for two way wheeled traffic. Additional information could be included to tell a commander:
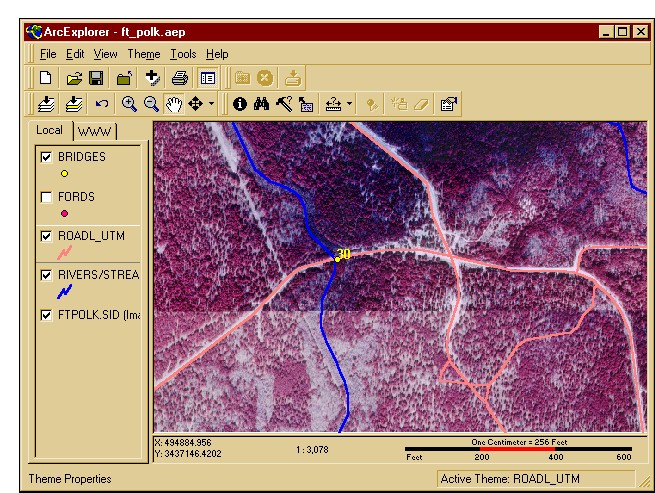
Figure 7: Lines of Communication Overlay
Build your own TDA
There are three major steps involved in building TDAs using ArcExplorer™ and NIMAMUSE™:
To begin, the NIMA digital data you use as input must be identified, accessed, and prepared for input into ArcExplorer™. This is done with the MUSE support applications -- Raster Importer and Vector Importer. Both of these applications allow you to identify and define exact pieces of raster and vector feature data for eventual layering together in ArcExplorer™. ArcExplorer™ is the primary tool you will use to view and manipulate your data. The software allows you to select certain types of map information and present it in a manner you choose. The focus of ArcExplorer™ is the building of individual layers of data and then outputting those layers as single map objects which can be cut and pasted to brief the terrain data. Typically, a raster base layer is chosen first, with one or more layers of vector map data overlaid next. Since the layers are always visible, you can continually refine the appearance of the displayed map layers by choosing any color and line weight of the vector layers. Once you are satisfied with the final TDA, you can perform some analysis of your AO such as identifying features with your mouse, building query expressions, generating statistics, and measuring distances between features. After you have developed your TDA you can save it as a single project (*.aep) for future recall or export the image as either a *.BMP or *.EPS file.
Digital Exercise Support Packages
Using DemoShield™, a multimedia graphical user interfacing software package, NIMA has developed a prototype geospatial package called a Digital Exercise Support Package or DESP. Figure 8 shows an exercise package developed for the 1st Brigade 91st Division (Exercise), Camp Parks, California.
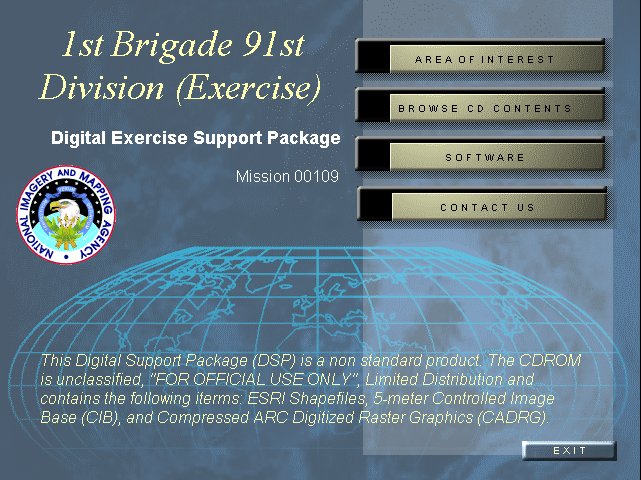
Figure 8: NIMA's Digital Exercise Support Package
A DESP's provides a custom made geospatial package complete with imagery, raster, and vector data which has been converted and reprojected for use with Esri's ArcExplorer viewing software, See Figure 9. Customers can view the projects files developed by NIMA's geospatial analyst's which could include lines of communication, cross country movement, weapon fans, etc, or create their own using NIMAMUSE.
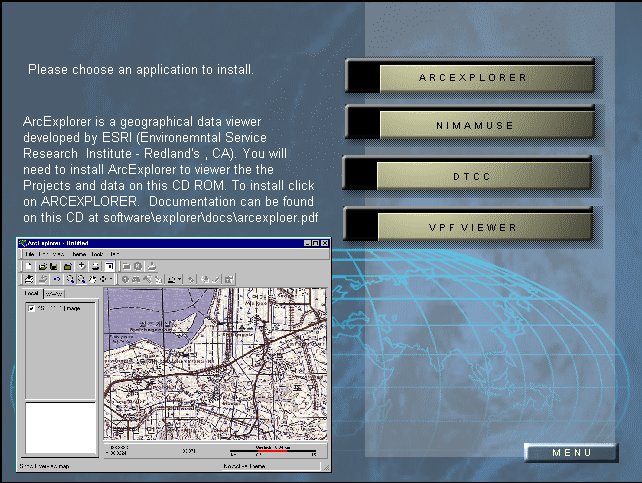
Figure 9: Optional software provided in the Digital Exercise Support Package.
Key Techniques and Procedures
At the tactical level, engineer and intelligence warfighters need to develop topographic skills in light of the fact that not every unit has access to topographic support. This is possible, to a limited extent, with readily accessible data and software. The computer-based systems identified in this article can provide automated assistance to the engineer and intelligence warfighter's terrain analysis function. However, these software systems and utilities have limitations, as they are not full-featured geographic information systems (GIS). Even so, the greatest limitation is your ingenuity and the data used. These systems have the capability to receive, (re)format, create, store, retrieve, update, manipulate, and condense digital terrain data to produce terrain analysis products such as: modified combined obstacle overlays, hydrology overlays, slope maps, on and off-road mobility maps, line-of-sight intervisibility plots, concealment maps, on-road chokepoint maps, and tactical fording/bridging maps. For the engineer or intelligence officer, these systems further enhance your ability to provide the commander terrain-related products currently only available to units with access to topographic units.
Defense GIS Data Sources Workbook, Environmental Systems Research Institute, Inc., Redlands, California, July 1997.
DMA ARC Digitized Rater Graphics (ARC7XNJ5223), Series: ARC7, Item: NJ5223, Edition: 002, National Imagery & Mapping Agency, Fairfax, VA.
DMA Vector Smart Map (VMAP1 095), Series: VMAP1, Item: 095, Edition: 001, National Imagery & Mapping Agency, Fairfax, VA.
DMAMUSE Version 2.0 Defense Mapping Agency Mapping, Charting & Geodesy Utility Software Environment, National Imagery and Mapping Agency, Washington DC, September 1996.
FM 34-130, Intelligence Preparation of the Battlefield, 08 July 1996
FM 5-105, Topographic Operations, 30 September 1993
FM 5-33, Terrain Analysis, 11 July 1990
Glenister, Cynthia A (CPT). and Richerson, John E (MAJ), The Engineering Intelligence Process, Engineer Professional Bulletin, U.S. Army Engineer Center, March 1997.
NIMA Digital Data Sampler (SAMPXNTCXPOLK), Series: SAMP, Item: NTCXPOLK, Edition: 001, Fort Hood, Texas.
TerraBase II Version 2.04 User's Guide with Tactical Applications, US Army Engineer School, Fort Leonard Wood, Missouri, May 1998.
Author Information.
Name: Jeffery S. Reichman
Title: Geospatial Analyst
Organization: National Imagery and Mapping Agency
3200 South Second Street
GIDAH6, Mail Stop: L-40
St Louis, Missouri 63118
Telephone: (314) 263-4006
E-Mail: ReichmanJ@nima.mil