IN TRANSPORTATION PLANNING AT
THE CITY OF SAN DIEGO

GIS APPLICATIONS
IN TRANSPORTATION PLANNING AT
THE CITY OF SAN DIEGO
Abstract
The City of San Diego's Planning Department
plans future roads using traffic modeling procedures that have been integrated
with Esri's Arc/Info GIS. This presentation will demonstrate the
types of transportation planning information contained in the Transportation
Planning GIS, from street classification to turn prohibitors. Examples
will be shown on how the section uses the GIS to maintain, display and
analyze traffic model input and output.
Introduction
The City of San Diego is the sixth largest city in the United States and has a population which is expected to grow from about 1.25 million people today to about 1.7 million within the next twenty years. In anticipation of this growth the City must look ahead and plan for the necessary infrastructure, such as roads. Using traffic models and a Geographic Information System (GIS), the City of San Diego's Planning Department conducts the planning of the future roads in the City.
The traffic modeling procedures and related data bases that the City uses for planning were developed at the San Diego Association of Governments (SANDAG), the San Diego regional planning agency. These procedures and data bases are managed using Esri's Arc/Info GIS. By sharing the data sets with SANDAG, the City is better able to achieve its goal of providing efficient and accurate traffic forecasting and planning, while also helping to maintain the regional traffic model.
This paper introduces some of the types of transportation planning-related
information that are contained in a transportation planning GIS, from street
classification to turn prohibitors. Through out this paper examples will
be given on how the GIS is used to display and analyze traffic model information.
Displaying Traffic Model Inputs
Because the traffic models and related data bases are complex and spatial in nature, a GIS is used to manage, maintain and analyze the inputs and results of a traffic forecast. The GIS and traffic modeling procedures employ various software, including Arc/Info and TRANPLAN (Urban Analysis Group), plus SANDAG FORTRAN programs.
The first graphic contains a detailed view of a portion of the Scripps Miramar Ranch Community Plan land use map. This map is used for checking Traffic Analysis Zone (TAZ) land use coding. A TAZ is a level of geography that, when overlayed on the land use layer, is used to tabulate land use by TAZ for trip generation. Trip generation is the type and amount of person or vehicle trips that are generated by various land used types. Accurate land use coding is essential trip generation and a key component to the traffic modeling process.
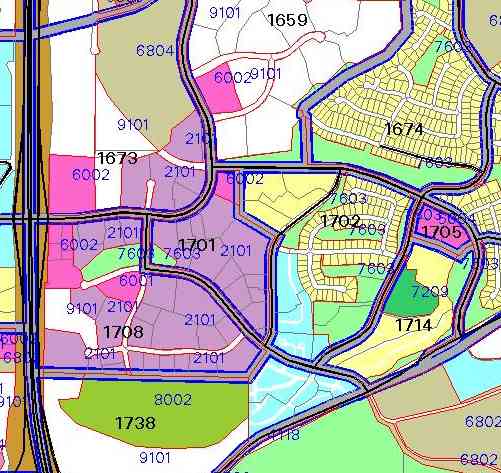
A total of four layers of information are contained in this land use map. The first layer is the land use, which is colored according to type and category. For further identification, specific land use codes are also shown in the blue numbers. The second layer of information is the parcel or property boundaries which are plotted as grey lines. The third layer on the map is the street network, which are shown as black lines. The fourth layer is plotted in a thick grey line with accompanying black text, which are the TAZs boundaries and their identification number, respectively.
Another example of the GIS display capabilities is seen in the next graphic of Year 1995 street network for a portion of the North City Transportation Study. Using various line and marker symbols, certain street network attributes like roadway classification and intersection control type are readily viewed to assist field checking and editing of the street network layer.
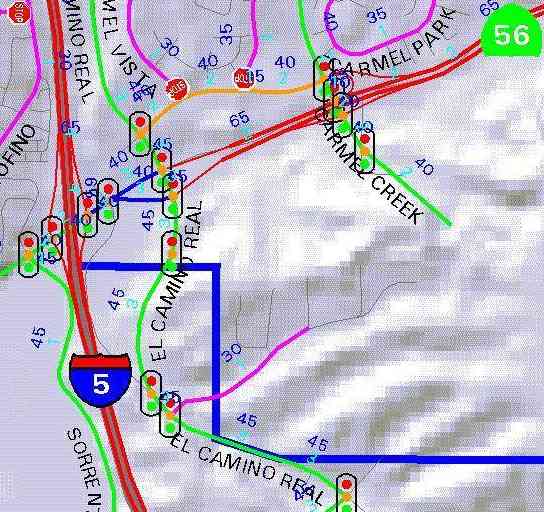
An accurate street network data base is another essential input to the
traffic model, as this information is used to determine roadway vehicle
capacity and transportation routes. To provide the user with additional
information about the study area, topography is shown in the background
using hill-shaded relief.
Editing Traffic Model Inputs
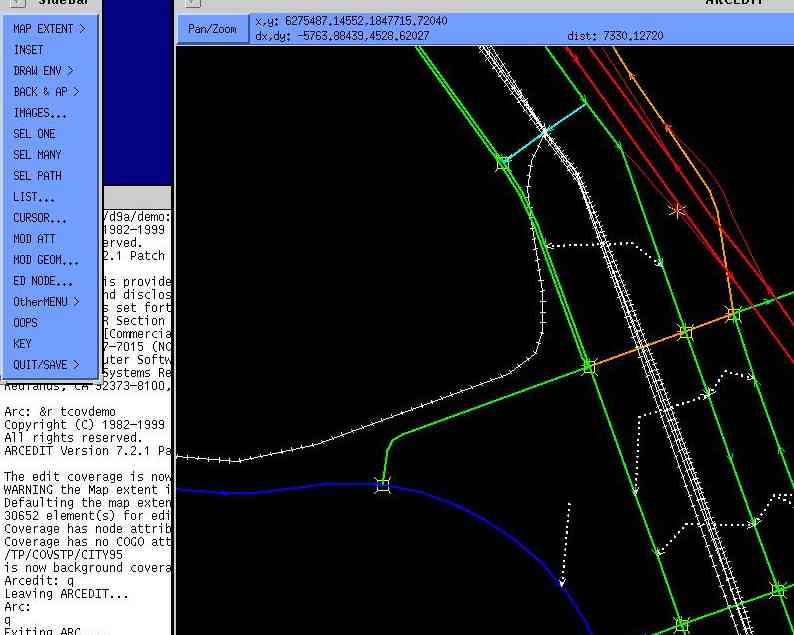
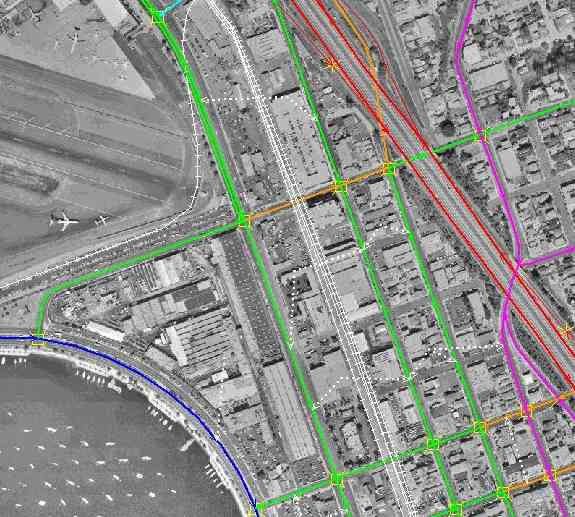
With user-developed menus, and link and node attribute symbology, street networks can be viewed and edited quickly and with less error. This example of the circulation element for San Diego's downtown area shows the alignment and classification of various streets and rail lines, plus existing and future intersection control types.
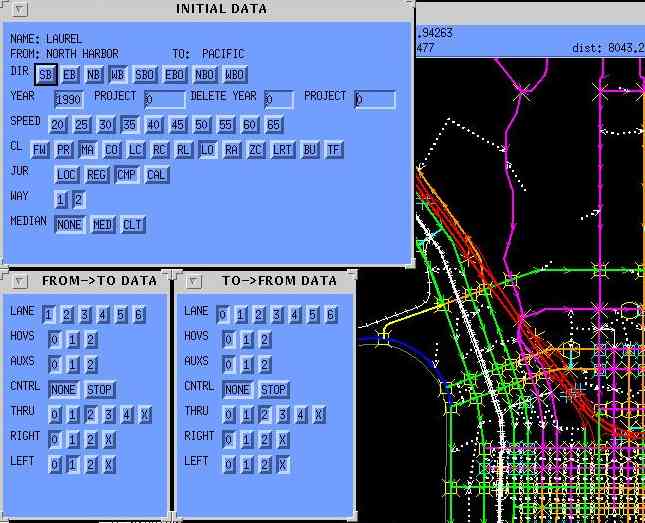
The next graphic illustrates the menus that the traffic engineer or planner can use to query and edit the street network prior to a traffic forecast. Here we see that host of street network characteristics can be viewed and edited by making a choice from a selection of choices.
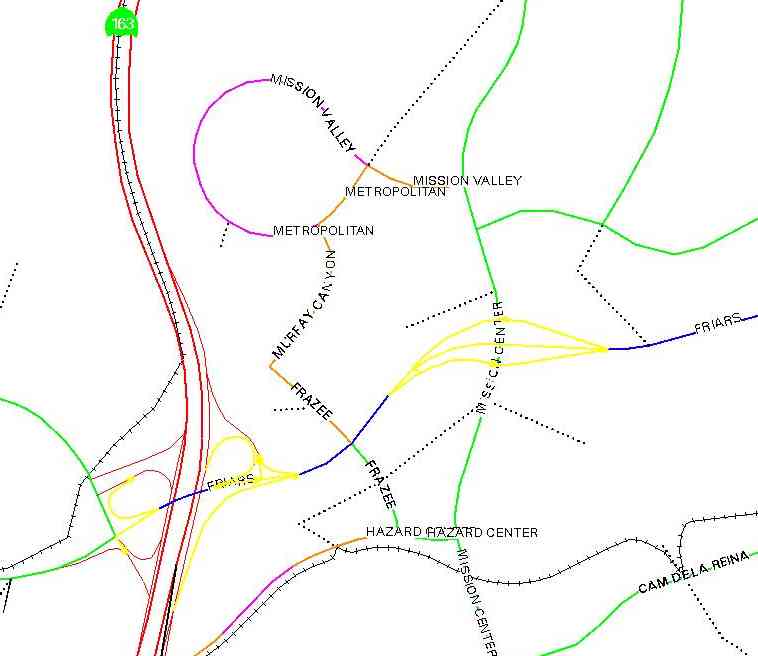
In addition to coding arc and node attribute information, Dynamic Segmentation route and segment attributes are maintained to inventory turn prohibitor information used in the traffic models. The accompanying graphic for a portion of the Mission Valley community shows the turn prohibitors as the yellow, arrow-headed arcs. Each route is comprised of two road segments and the arrow indicates the direction of the prohibited movement.
Other features can also be displayed in the background to assist the street network editing process. In this example a digital orthophoto image is used to verify roadway alignment and coding, intersection control location and coding, and TAZ centroids and loadings.
Analyzing and Displaying Traffic Model Results
The standard output from the traffic modeling process is forecasted average daily traffic (ADT) volumes. A simple plot of the ADT numbers and the street network usually provides sufficient information to describe the results of a traffic forecast. Other times it is necessary to perform more detailed analysis using the traffic model and GIS.
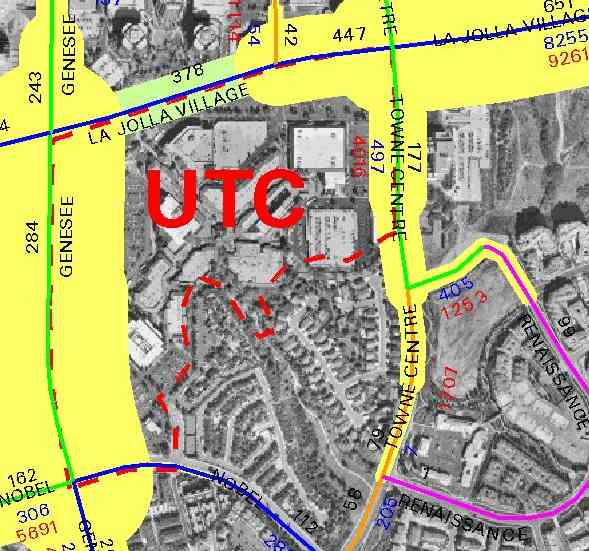
This graphic shows how the GIS can be used to view the results of a select zone assignment, the modeling process of distributing and tracing project traffic. In this example of a select zone assignment for the University Towne Centre (UTC) shopping center, the traffic volumes associated with the center were buffered and plotted to scale.
Differential shading was used in the plot to distinguish arterial and freeway volumes, as well as traffic distributions from other projects. Also contained on the plot are the specific ADT numbers, street names, street classification, project boundary, and the aerial photography. This type of information is useful when determining project impacts and the allocation of developer impact fees.
Another example of how to better view traffic distributions using GIS can be seen in this next graphic of a select link assignment bandwidth plot. Using buffering and overposting of information layers it is possible to see at a glance the distribution of traffic that uses a particular road segment.
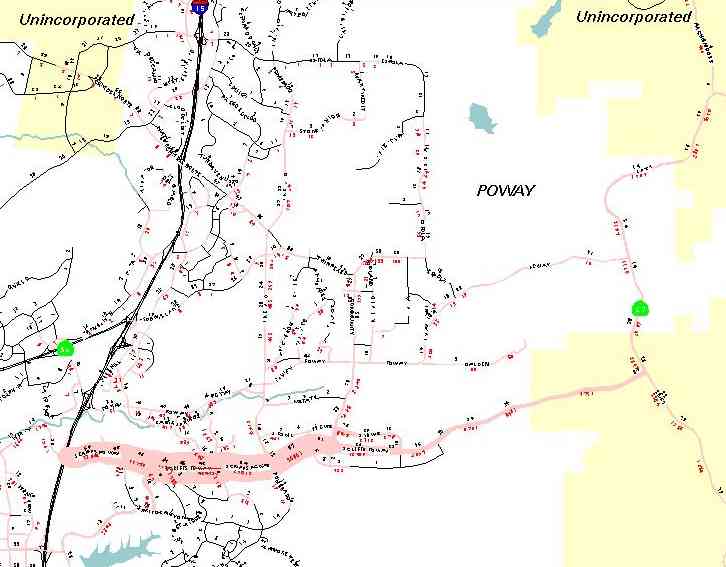
In this example in the Scripps Miramar Ranch Community and City of Poway area, we can see the origins (O) and destinations (D) by jurisdiction of traffic using this segment of road. By further analyzing this data with the GIS, the actual jurisdiction O and D amount could be tabulated by overlaying the affected TAZs loadings with a GIS layer of jurisdiction boundaries.
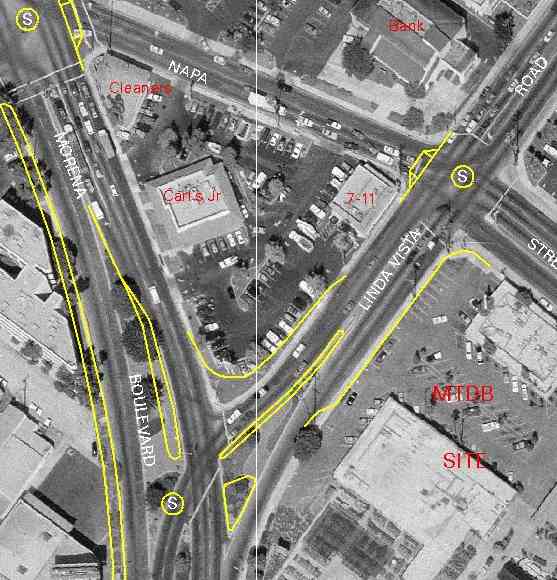
The graphics capabilities of the GIS area also used to present design scenarios for transportation projects. The accompanying graphic for the Napa Street Traffic Study was produced to illustrate a proposal for improving traffic flow at the heavily congested intersections in this area in the Linda Vista Community. By superimposing new curb lines and intersection controls atop an aerial view of near-current development, engineers and decision makers gain a sense of how right-of-way and property lines could change with the project proposal.
Conclusion
Using SANDAG routines and data sets, Arc/Info
software, and in-house methodologies, the City of San Diego Planning Department
uses GIS to achieve its goal of providing efficient and accurate
traffic forecasting and transportation planning.
These routines and methodologies employ menus, overlays and spatial analysis
procedures, to efficiently maintain, analyze and display complex transportation-related
data sets to help the City plan for the future.
Acknowledgements
William McFarlane, Senior Transportation
Planner, San Diego Association of Governments.
Author Information
Andrew G. Abouna
Associate Traffic Engineer, GIS Coordinator
Planning Department
City of San Diego
202 C Street, MS 5A
San Diego, CA 92101
(619)235-5793, (619)236-6478 fax, d9a@sdcity.sannet.gov
June 1, 2000