This paper presents research on using aerial photography with GIS/GPS for large-scale vegetation mapping of ecological restoration at the UWñMadison Arboretum. Creating orthophotography from historic and recent aerial photography using software developed at the UW-Madison Environmental Remote Sensing Center provides images for more accurate and efficient mapping of vegetation and detecting changes over time. Aerial photos taken at different times of year, at different scales, and using four types of film are compared for effectiveness in detecting and monitoring vegetation including 9 troublesome plant species. Various interpretation methods are compared including: 1) manually digitizing from original photos 2) classifying scanned photos using image processing software, 3) on screen digitizing of scanned unrectified and orthorectified photos, and 4) using GPS for mapping and ground control.
Introduction
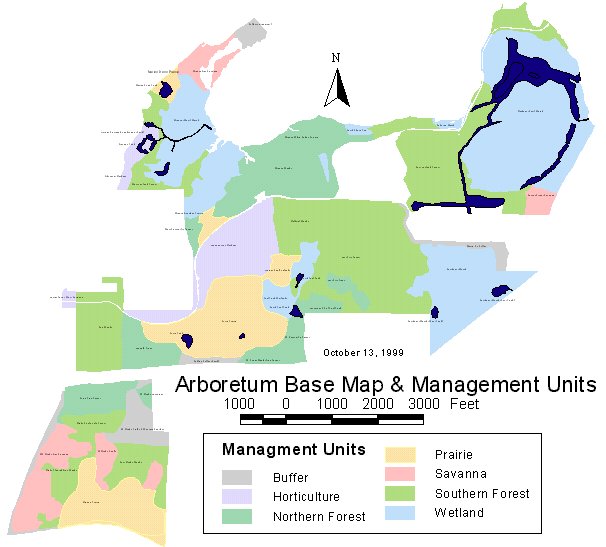
The UW Arboretum (http://wiscinfo.doit.wisc.edu/arboretum/) was established in the 1930ís, as a laboratory for Restoration Ecology and contains over 1100 acres of remnant and restored Wisconsin native plant communities including various types of prairie, savanna, wetland and forest (see the following figure to see the different communities, listed as management units, at the Arboretum). The species composition of these communities have changed over time as a result of many factors including, succession, invasion of weedy plants, disturbance and management designed to increase the biodiversity of native species and reduce weedy species. Monitoring these changes in the landscape often relies on traditional on-ground sampling techniques and observations that result in species lists and other information for sample plots but provide incomplete data on the overall geographic extent of these species. In addition we have over 3,000 woody horticulture specimens in 70 acres that need mapping yearly due to turnover of species. Since 1986, the Arboretum has been testing the feasibility of using aerial photography in conjunction with geographic information systems for mapping and managing its biological communities, horticulture collections and cultural features, supplementing the more traditional methods.
Since 1937 over 30 different aerial photography flights at different scales and film types have included the Arboretum creating a wealth of historic data for interpreting and mapping. Several attempts were made even early on to create base maps and vegetation maps directly from these original photographs, or even from rectified photos. But with the inherent distortion in aerial photography these maps have not been accurate enough for some GIS analysis like overlaying vegetation maps from different dates to detect changes over time. In addition most historic aerial photography (prior to the study period 1997-1999) was flown early in the spring before leaves are on the trees to facilitate mapping cultural features and getting ground elevations. Some species are best detected in early spring (i.e. honeysuckle and buckthorn) but many others are best seen at later dates when phenological characteristics makes them most distinct.
One successful attempt to map vegetation in 1988 used a stereo plotter, the same kind of instrument traditionally used to create all the USGS topographic maps. However, the setup of the photographs in a stereo plotter is very complicated and mapping requires one to focus a dot of light while moving it around on the photographs ground plane, a difficult task to learn.
Methods & Results
With the help of a grant from the Institute for Library and Museum Services the author was able to acquire aerial images from eight different flights over the Arboretum during 1997 and 1998. Different phenological dates were chosen (from April 28 through October 10), different film types (color positive, color negative, color infrared, and black & white) and different photo scales (1 inch = 250í to 1 inch = 800í) to compare how effective each set of photos were in detecting certain targeted species. The targeted species were those considered most troublesome because of there invasive weedy nature or in some cases desirable species indicative of a successful restoration or healthy biological community. There also was no one time in the season best for taking pictures, optimal dates depend on which species one is trying to capture on film (see following table)

Color positive, negative and color IR film types all had their own advantages. Color positive transparencies were the easiest to interpret. Color negatives were scanned and converted to positive images. These images had the least contrast making areas in shade or shadow easier to see. Color IR film captures differences in vegetation not seen in normal color but was more difficult to interpret. Having sets of color and color IR together was ideal.
Several methods were explored for interpreting and mapping vegetation from the photos keeping in mind that ultimately map features would have to be orthorectified using a digital elevation model (DEM) and photogrammetry software to remove the distortions caused by relief displacement, tilt and scale differences in the original photos.
One method tried was to have an image processing program perform a classification of landcover and vegetation using the spectral reflectance of the image pixels. Unsupervised and supervised automated classification of the scanned photographs did not produce satisfactory results however. The vegetation classes were not distinct with much overlapping of spectral signatures between vegetation types. This variability may be a result of the high level of detail found in large-scale photography.
Another method tried was visual interpretation of the photos and manually outlining boundaries of vegetation and other features. Interpreting directly on the original photographs using transparent mylar was attempted but the scale of the original photographs was too small for detailed mapping. Interpreting from photo enlargements may have worked but was considered too expensive.
Manual interpretation from digitally scanned aerial photography in a program like Arcview offered the most number of advantages. You can capture as much of the detail in the original photographs as needed if you are willing to manipulate very large files. Digital images can be enlarged on the screen of course by zooming in, enhanced by changing the contrast, brightness etc. to bring out specific features, orthorectified to remove distortion, clipped and mosaiced. Vector files can be overlayed such as GPS data for ground truthing and printing out.
On-screen digitizing of scanned raw photographs in Arcview was also considered and tried but the resulting vector files were never orthorectified because of the difficulty. When orthophoto software became available and affordable we switched to digitizing directly on digital orthorectified photos.
To capture most of the detail in the original photographs they were scanned at a high resolution. A color image scanned at 15.7 microns produces an image about 640 MB in size, small enough to fit on one CD but a huge file to work with. Images scanned at 23 microns create an approx. 320 MB file, 2 to fit on one CD and they were much easier to work with. The compromise was less detail in the image.
Orthophotos were created using OrthoMapper, softcopy photogrammetry software developed at the UW-Madison Environmental Remote Sensing Center (see following figure for some examples of photography taking at different dates, scales and film).

Ground control for relatively recent photographs was obtained using GPS and either panels for targets or photo identifiable points such as sidewalk/driveway intersections. A minimum of 5 points was used for each photograph (see following figure for location of GPS control). Control for historic photos was obtained from existing recent orthophotos. Orthomapper simply allows one to select any points on an existing orthophoto or digital raster graph (scanned topographic maps) and select the corresponding point in the photo to rectify. GPS or ground survey is not required.

Knowing the focal length of the camera lens is also not required. A camera calibration can be used but is not required. What is needed is a DEM to model the terrain and remove distortions. Any areas where the DEM does not model the physical landscape (i.e. trees, buildings, bridges, areas away from roads, etc) will be affected by relief displacement. (See photos below of tree canopies for an example) DEMís are often created as a by-product of producing orthophotos and once they are created they can be reused with other photos to be orthorectified. Adjustments to the DEM may have to be made though to reflect differences over time in the terrain due to construction or other alterations. The accuracy of DEMs varies in places as well. DEMs are often created from Digital Terrain Models (DTM) using a photogrammetric process that defines elevations along streets, water bodies, streams, ridges etc. At the Arboretum we enhanced the Dane County DEM that was used for the county wide orthos in 1995 with GPS and total station elevation data to get a more accurate DEM in areas we were concerned about.

Tree canopies positioned correctly over center of tree trunks. Notice the tops of the trees lean to the right from relief displacement even in this orthophoto.

Tree canopies in this color orthophoto lean to the left giving an incorrect position. The circles, based on the leaf-off B&W photo, define the correct position for the canopy and center of trees.
Examples of Using Orthophotos at the Arboretum
We used orthophotos created from a series of historic and recent aerial photography to map Reed Canary in Greene Prairie over the years. Reed Canary is a very invasive, weedy grass that eliminates most other plants where it grows. Early photos from the 1970ís show little if any Reed Canary while photos taken in the last 12 years show a tremendous increase in the area covered

Another example of using the orthophotos is in mapping a wetland community called Wingra Marsh. October color photography was best for this area. GPS was used to ground truth the interpretation and actually do some of the mapping.

One last example is using the orthophotography to update the horticulture maps for Longenecker Gardens where each tree and shrub is located and identified.

Conclusions
Creating orthophotography from low-altitude color aerial photography has proven very feasible, useful and economical for large-scale mapping in relatively small areas with. The OrthoMapper software product was easy to use and inexpensive. Orthophotos provided a much more accurate base for mapping then simple rectified photos. Historic aerial photography can be scanned and orthorectified rather simply if some control can be found for features on the ground. Existing topographic maps and orthophotos can be used for control on historic photos. Changes in the landscape over time can be quantified using a time series of orthophotos but are only as accurate as the least accurate orthophoto used.
The best dates for flights will vary considerably depending on what species or features are targeted to map. Generally color negative or positive film was better then B&W or Color IR. Low altitude photos had more detail but required more frames to cover the same area and contained more relief displacement. Real time GPS was a very valuable tool for ground truthing images. Digitizing on the screen from orthophotos was the easiest way to interpret the images and capture features but required working with very large files. The Image Analysis extension for ArcView provided an essential set of tools for displaying very large images with the pyramid file format and better image enhancement tools then Arcviewís.
Even with orthophotos relief displacement is a problem when mapping features with height like buildings and trees. Either the DEM has to be adjusted to model the actual geometry of 3D features, tops of features need to be shifted to their correct locations, or these features need to be captured using stereo vision tools.
This project has received an exceptional amount of interest and use from many different types of Arboretum community members and projects. The Arboretum staff has used the results to better understand and characterize the biological communities being restored by having an accurate and quantifiable method of mapping vegetation and other natural and cultural features.
Please contact the author if you wish to have an updated report on the project results since this is a work in progress.
Acknowledgments
This research was supported by a grant from the Institute for Library and Museum Services and assistance from the UW Environmental and Remote Sensing Center (ERSC).
OrthoMapper is a software program available from Prof. Frank Scarpace, scarpace@facstaff.wisc.edu
, 608 263-3973.References
Lillesand, Thomas M. and Ralph Kiefer, Remote Sensing and Image Interpretation third edition, John Wiley and Sons, 1987
Author Information
Tom McClintock ñ GIS Manager UW Arboretum, GIS Training Manager UW LICGF
1207 Seminole Hwy, Madison WI, 53711
tlmcclin@facstaff.wisc.edu 608 265-2540