David Koss and Cheryl A. Karrer
Bang for the Buck: City of Tucson Real Estate Division Leaps Ahead with ArcView GIS
Abstract
The City of Tucson Real Estate Division automated sixty 36" x 36" hand-drawn Real Property Inventory maps. It would have taken 1000 man-hours to manually reproduce the maps. COTRE created the new maps in days using ArcView, the existing Pima County parcel base and street network, and an HP 755 plotter. The cost to the department for the ArcView 3.0 license was less than 5% of the Division’s equipment budget, which is less than 0.1% of the Division’s gross budget. The money saved from this and other projects undertaken is estimated at $200,000 - $250,000: a return on investment of over 250%.
Introduction
The City of Tucson, Arizona is located in
the Sonoran desert region of the southwestern United States, approximately 100
miles south of the capital city of Phoenix, and 60 miles north of the
International border with Mexico. Tucson is a rapidly growing metropolis with a
population of over 500,000, and many booming adjacent suburbs.
The primary responsibility of the GIS
section of the Department of Transportation Real Estate Division (http://dot.ci.tucson.az.us/realestate/ ) is to track an inventory of over 4,000 City-owned
real properties. The initial GIS goal within the division was to reproduce a
set of hand-drawn Real Property Inventory maps showing the city-owned parcels.
ArcView proved to be a quick, easy, and inexpensive way to accomplish this,
without an insurmountable learning curve.
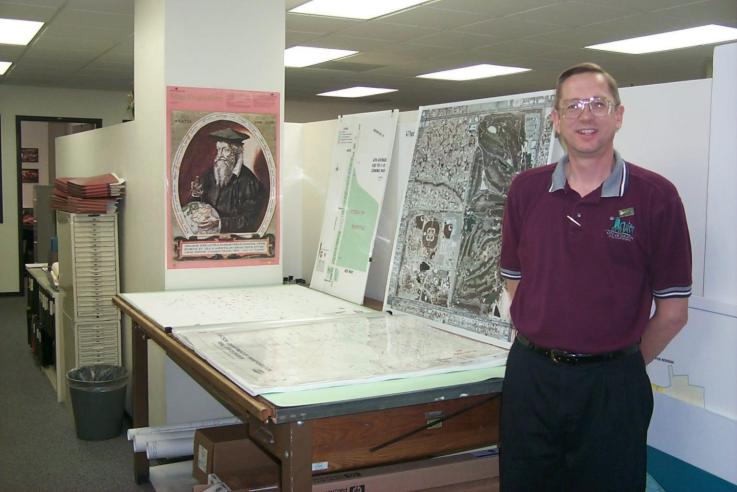
Figure
1: Dave Koss
From
Simple Beginnings…
Prior to 1997, the Real Estate Division used
a Microsoft (MS) Access database to organize information on the 4,000 city-owned
parcels. At that time, GIS within the division consisted of approximately 60
pages of 20-year-old base maps, with City-owned parcels drawn in by hand. Newly
platted subdivisions and other updates were made using the "pencil and
eraser" or "cut and paste" methods. The maps were never
comprehensively updated; consequently, the pages were "dog-eared",
torn, and unreadable. (See Figure 2) To overcome this, a protocol for easily
updating and reproducing this map set was needed. ArcView provided the solution.
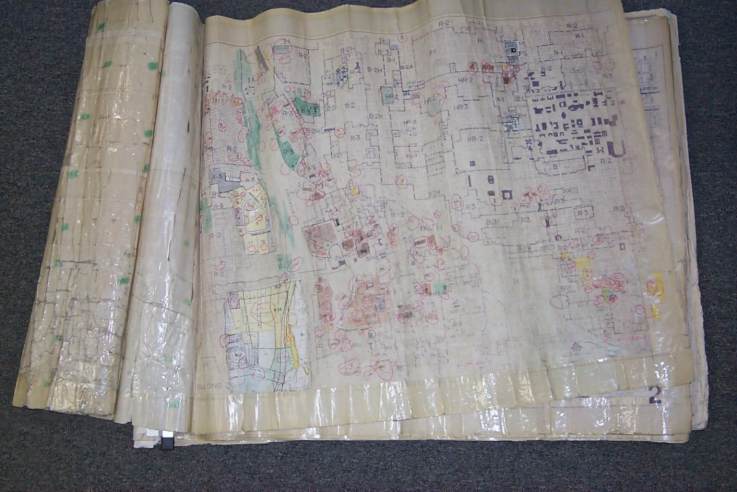
Figure
2: The Old Map Set
The Real Estate Division’s foray into
ArcView began in 1997 with a visit to Pima County’s Technical Services division
for a short demonstration of the software. The City’s GIS efforts were very
small scale and dispersed at the time. The County was miles ahead, with several
up and running mapping programs, including the Pima County Land Information
System, a cd-rom containing a run-time version of ArcView 2.1 (Data Publisher)
and more than forty shapefiles. Most importantly, the County had created a
digital parcel base for the entire county, as well as an associated street
network. The division looked to the support of Pima County’s GIS Manager at
that time, Howard Ward, for guidance on the semantics of linking the Real
Estates Division’s Access database to the parcel shapefile coverage. After
review of both databases, it was determined that the Taxcode field in
the Access database and the parcel field in the parcel shapefile
contained the same data, and could be easily joined in ArcView. The seed was
planted, and the Real Estate Division purchased a single license of ArcView.
The first task after Dave Koss had completed
a local Introduction to ArcView course was to plan the Real Property
Inventory Map Reproduction project. The Tucson metropolitan area is made up of
more than 30 Townships, containing over 341,016 parcels. Because of the
tremendous number of polygons in the parcel shapefile, it was decided to divide
the area into smaller, more manageable pieces than had been used in the
original Real Property Inventory maps. Since the parcels are relatively small
and numerous in the center of the City, it was decided to divide the map pages
up into quarter townships. By working with only nine sections at a time, we
could easily plot the parcels onto a 36" x 36" page for inclusion
into the replacement map set. For the maps showing the outskirts of the City
where the parcel size is typically larger, the scale was increased to show an
entire township. The first project file was set up to include all views,
themes, borders and layouts that would become standard throughout this effort.
(See Figure 3)
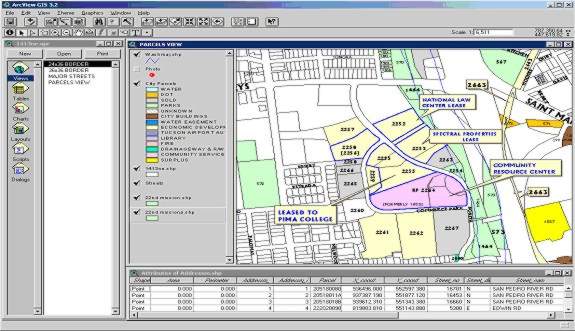
Figure
3. Project Design
Next, the County’s parcel shapefile was
joined with the City’s property database based on the common field. The City
property database was imported into ArcView using an ODBC connection in the
"SQL Connect" menu. A field was created in the City property database
called "color", and attributed accordingly for each controlling
department: "blue" for parcels controlled by the Water Department, "red"
for parcels controlled by the Fire Department, "green" for Parks
Department properties, and so on. The legend was then created using the
"unique value" option on the legend editor, and the standardized .avl
was saved. The final step entailed creating the layout and the final
"look" of each map page. (See Figure 4)
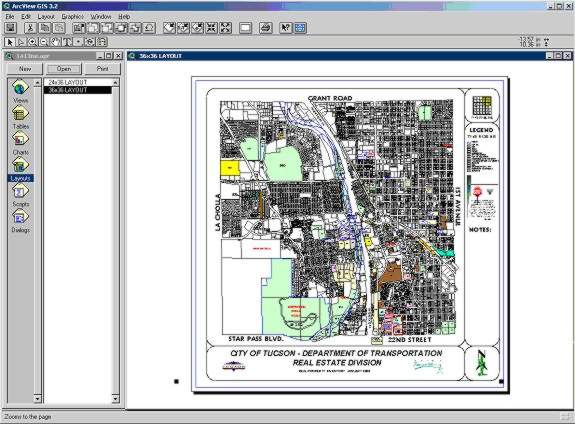
Figure
4. Final Map Layout
ArcView project files were then created for
each quarter township, thus creating a separate project for each map
"page". The original project file was copied for each quarter
township or whole township, and renamed to reflect the map location. After the
project files were copied and renamed, the original parcel theme from the
template project file was deleted and replaced with the correct theme tile for
that area. Finally, layout legends were adjusted accordingly, and the maps were
plotted using a Hewlitt Packard 755 color plotter. The project wrapped up as a
resounding success, as the old map set was quickly replaced. A cover page was
added for quick indexing. (See Figure 5).
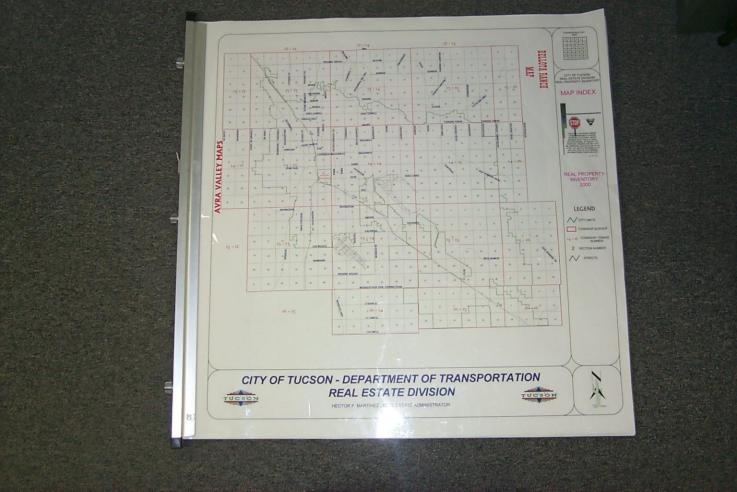
Figure
5: The New and Improved Map Set
Word traveled quickly through the City
departments, and several requests for copies of the map set were made. There
was no doubt within the Real Estate division that the one copy of ArcView paid
for itself many times over in man hours saved related to this project alone,
and that the resulting benefit to the City was almost immeasurable.
In early January 2000, the Division
contracted with a local consultant, TerraSystems Southwest, Inc., to write an
Avenue script that further automated the map production procedure. (See
Appendix A) The script selects quarter
township and whole township "tiles" out of the parcel base shapefile
and saves each tile as a new shapefile with the township, range and section as
the file name. The script is run on a weekly basis using the most current version
of the County’s parcel base, and the updated tiles are automatically placed in
the designated directory. Each project then is automatically updated when the
.apr is opened, allowing for easy update of the map set. The master Real
Property Inventory Parcel database is kept on a different server and updated by
clerical staff on a daily basis to reflect any new additions or deletions to
our inventory. Updated themes are posted on the City’s intranet for use by
Property Agents and other City of Tucson departments. Staff continues to make
hand drawn entries on the hard copy map set, which is replaced only once every
six months due to the cost of printing. Single map pages with numerous changes
are plotted more often, on an as needed basis. The old pages are removed from the
map set and the new pages inserted in their place. In the end however, the
division has a fresh copy of the map set every six months instead of every
twenty years, and the labor effort is minimal.
Making
this Success Possible: The Good, the Bad, and the Not so Bad… The Start of GIS
in Pima County, AZ
The availability of the parcel base in
shapefile format from Pima County played a key role in the City’s ability to
easily recreate the Real Property Inventory map set. Thanks to strong
inter-governmental cooperation from a grass-roots level, data sharing and
coordination have become the norm, with the City accessing the City/County
jointly supported MARS server – providing the most up to date parcel data
available. Recently, the City and the local Council of Government (Pima
Association of Governments) have contributed back to the effort by sharing high
resolution digital orthophotos for the Tucson metropolitan area, which are also
available on the MARS server in both ArcView and ArcInfo compatible formats.
However, the foundation for GIS in the City of Tucson was laid by a Pima County
project a decade earlier.
Pima County began its adventure into GIS in
1984, with the passage of a $5 million dollar bond package for "a
computerized mapping system" to be installed in all public libraries. Pima
County Planning and Development Services, now known as the Development Services
Department, was placed in charge of this venture. In 1986, Gene Trobia, who is
currently the Arizona State Cartographer, was hired as the Pima County GIS
Manager. Mr. Trobia named the effort the Integrated Mapping and Geographic
Information Network (IMAGIN) Project and kicked-off a multi-year needs analysis
and demonstration project.
During the demonstration period 1988-1990,
the IMAGIN Project leased Arc/Info software and ran it on a variety of
platforms, including a Prime minicomputer, UNIX boxes from Hewlitt Packard and
Sun, and a VMS workstation from Digital Equipment Corporation. In 1990, a Sun
system was installed and production of the GIS database began.
In 1990, it was determined that the
implementation of a County-wide GIS program would cost between $12-$20 million
dollars, which was not easily available due to the economic and political
conditions of that time. Five participating County departments agreed to
support the expanded program, only to withdraw because of the economic
downturn. The program was left with no additional money forthcoming, and the
situation for GIS was bleak. County Management communicated that the GIS
program should become an "Enterprise-Fund" department, which meant
raising all operating funds from the provision of data and services. This
seemed like a reasonable solution in the beginning. The GIS group, now called
Engineering and Geographic Information Services, would hire staff, convert all
the data, and ultimately charge all other departments, utilities, and other
government agencies, such as the City, a portion of the cost to create the
digital data. The base layers were sold to many local utilities, and several
hundred thousand dollars were raised, but by 1993, the paying customers had run
out.
At that time, the City of Tucson and its
various departments were not allocating any funds to assist in the development
and distribution of GIS data locally. Furthermore, the GIS community was
agitated that a bond-funded program would charge for data. Many local agencies
and departments continued to do business in a manual mode, and some started
redundant data conversion efforts. To make matters worse, the Engineering and
Geographic Information Services Department had a capital and operating budget
of approximately $1.8 million dollars per year and were running a heavy
deficit, even with the large data sales that had been made. Furthermore, due to
a downturn in support among various players within the community, GIS
development was slowed for a few years. Fortunately, the story does not end
here.
In 1995, the Engineering and Geographic
Information Services Department was folded into the County Department of
Transportation as the Technical Services Division. This move was done to link
what was perceived by County management as a valuable service to a stable
funding source – transportation bond funds. With pressures from data sales
lessened, the new division implemented a "damage control and GIS
resuscitation program". In 1995, the Pima County Land Information System
was born.
The Pima County Land Information System (http://www.dot.co.pima.az.us/gis/pclis), fondly known as PCLIS, was the brainchild of
Howard Ward, who became the GIS Manager in 1994. He recognized that selling the
GIS data was not working, and that the local GIS community was nearly
nonexistent, or perhaps just stagnant. The thought was to create a CD-ROM
containing various GIS data sets and a run-time version of ArcView 2.1 (Data
Publisher), with a customized GUI simplifying many general GIS functions for
the inexperienced GIS user- all for a bargain price of $65. In 1996, PCLIS was
in full production. The 300,000+ parcel base served as the base coverage, along
with the associated street network and forty plus other useful GIS layers such
as rivers/washes and topography. The GUI allowed for users to search for parcel
information based on the parcel ID number, the street address, or the owner’s
name. In addition, the GUI provided for easy one-button map production and
other enhancements such as user-friendly spatial analysis wizards, which helped
those not familiar with GIS technology utilize the data. It was this
application that first got the attention of the City of Tucson Real Estate
Division. PCLIS made data readily available and helped them to see how GIS
could be applied in their department. Today, PCLIS continues to be updated on a
quarterly basis, and the dataset count has grown to over 150 shapefiles.
Pima County followed up its initial CD
effort by moving data to the Internet. In early 1997, current GIS Manager Jack
Lloyd acquired a beta version of AutoDesk’s MapGuide and quickly built a basic
data display and query interface. Since
then, Pima County's MapGuide site (http://www.dot.co.pima.az.us/gis/maps/mapguide) has evolved into an internationally recognized GIS
Internet site. Hundreds of jurisdictional staff have come to rely on the County
MapGuide site in their everyday work tasks, including the Real Estate Division.
The Division publishes the most current version of the Real Property Inventory
dataset to the MapGuide site on an as-needed basis. As County, City, and other
jurisdictional data is added to the site, the user base continues to spread
into the private sector and the general public.
In addition, digital orthophotography
products are rapidly being incorporated into projects throughout the County.
Its applications include landuse/land cover identification, building
improvement assessment, floodplain mapping, roadway design work, spatial
enhancement of existing GIS layers, generation of new GIS layers, facilities
mapping, terrain analysis, cartography, and a host of others that spring up
every day.
In short, it has been a long, winding road
that has brought the local jurisdictions, including Pima County and the City of
Tucson, to where they are today with information technology. The creation of
the county-wide parcel base was crucial to the Real Estate Division’s Real
Property Inventory Map Reproduction project, and cost the County an estimated
$400,000. This effort was accomplished through intergovernmental cooperation on
all levels, and provided a platform from which regional GIS could grow and
flourish.
Identifying
and Quantifying the Benefits from the Purchase of ArcView
The goal of determining how to replace and
easily update the hard copy Real Property Inventory maps was obviously the
largest single benefit from the purchase of that single ArcView license by the
Real Estate Division. Another benefit derived from the use of ArcView was that
the staff was able to quickly identify and capture parcels that were somehow
omitted from the property inventory database. This added many thousands of
dollars in assets to the City’s real property inventory, thereby increasing the
City’s net worth and strengthening their bond rating.
The success of the Real Property Inventory
Map Reproduction project also led to requests by other City departments and
divisions for map products and related services. One such undertaking was the
Substandard Rental Housing Assessment Project. The Real Estate division was
called on to assist with a special project to assess and identify all
substandard rental properties in the city. A team was gathered together from
several different City departments to assess the rental properties, but the
problem remained as to how to identify the rental units. ArcView and the
County’s parcel base were once again used to identify rental units based on a
field included in the parcel dataset that classifies property by type. The
resulting theme was broken down by City Wards and maps were quickly and easily
created to allow assessment teams to plan their routes. The teams went out
twice a week and the entire assessment of 90,000 rental units was completed in
less than six months. To contract this project out to the private sector would
have cost the City many thousands of dollars. Again, the success of this
project was based on the purchase of one license of ArcView, and on access to
data that had already been created by Pima County and the City.
From the various GIS projects completed
within the Real Estate division, it became clear that GIS was becoming an
integral part of the Division’s operations. More interesting however, was how
the use of GIS technology began to spread throughout other City departments.
The timing may have been coincidental, but perhaps grassroots movements begin
with the success of a single project, much like the Real Estate division’s
example with the Real Property Inventory Map Reproduction project. This project
demonstrated how one successful application of the GIS technology can promote an
entire department to be more efficient and productive, while also reducing
costs. This can then permeate throughout other departments, ultimately changing
the local governmental landscape. Quantifying the benefits of acquiring GIS
technology can be difficult however, and the continued growth of GIS within an
organization is often contingent upon communicating with the decision makers
the benefits of this technology. Many department heads need to be convinced
that GIS can be a cost-effective solution to many problems faced by local
government. Conducting a cost-benefit analysis, as has been done for this
project, can help to establish a wider audience in which to tout the
possibilities that GIS can offer. Showing a positive return on investment
related to the acquisition of GIS software can convince those who are skeptical
about acquiring this type of technology that it can be fiscally rewarding.
Cost-Benefit
Analysis, ROI and Their Role in GIS Strategic Planning: The Proverbial Bang
for the Buck —
Cost-benefit analyses entail defining the
costs and benefits of a particular venture and assigning a monetary value, and
are often conducted during the GIS strategic planning process. A key attribute
of a strong strategic plan is a clear definition of the desired outcome from
acquiring GIS technology. A cost-benefit analysis provides a means "to
organize the sometimes vague desires of a firm or agency to ‘use GIS’ in a
solid, strategic plan for implementing and running the GIS" (Korte, 2000).
However, a cost-benefit analysis does not necessarily have to reflect an entire
GIS. It may focus on "a specific output, application or a firm’s use of
GIS technology as a whole" (Wilcox, 2000). To many organizations, whether
considering the acquisition of GIS technology or looking at the outcome of a
specific project from an existing GIS, one of the most important results from a
cost-benefit analysis is the return on investment (ROI) figure. The ROI figure
generally represents the comparison, presented as a percentage or ratio, of the
benefits versus the cost associated with a particular product, application or
expenditure.
Defining Cost and
Benefits
There are many approaches one can take when
conducting a cost-benefit analysis, whether for an entire GIS system to be
acquired in the future, or for an existing system with the goal of determining
the cost-benefit of a particular product. Recently, research conducted by
Webster and Lombard (1999) focused on applying traditional methods used by the
American Society for Training and Development (ASTD) to the evaluation of
training results in GIS, particularly the ROI. Their ROI model was based on
that of Dr. Jack Phillips (1997), which is an augmented version of the standard
Kirkpatrick method that was developed in 1959, and which is still considered
the most widely used method of evaluating training programs today (Webster and
Lombard, 1999). This template was roughly adapted to determine the ROI for the
implementation of GIS technology within the COT RE Division, particularly the concept
of hard and soft data (Phillips, 1997). Phillips notes that data utilized in
ROI calculations can be divided into two categories. Hard data consists of the
traditional measures of an organization’s performance such as items produced,
project timelines, employee overtime, and overhead costs, including equipment
and software. Soft data are more difficult to quantify such as work habits and
climate, employee attitudes, new skills, and initiative (Phillips, 1997).
It is often difficult to apply ROI equations
to GIS technology. In the past, costs and benefits often were considered over
several years, since the initial expenditures for hardware/software, staff
training and application development tended to far outweigh the definable
benefits when converted to a monetary value (Wilcox, 2000). As was seen by Pima
County’s experience, initial capital outlay for hardware, software, and data
conversion can be substantial, and the benefits difficult to quantify. However,
times and technology have changed considerably since the early eighties, when
GIS was run from a powerful yet expensive Unix box. Today, GIS has moved to the
desktop, thus reducing costs considerably. Perhaps just as important, GIS has
become more user-friendly, leaving the command line behind for window-based
GUI’s and wizards. Also, data availability has increased substantially, and
thanks to intergovernmental cooperation such as that between the City of Tucson
and Pima County, data creation, maintenance, and sharing has become a joint
effort. In response to all of these movements, benefits generated from newly
acquired GIS capability are now more quickly realized, sometimes seemingly
instantly, as was with the City of Tucson Real Estate Division.
Governmental departments or divisions often
acquire GIS technology in a manner that does not allow for a formal strategic
planning process to occur. In many cases, other departments or governmental
entities in the community have already gone through the initial stages of
technology acquisition, which may or may not have included a strategic planning
process, and are actively applying GIS in daily operations. Other departments
that are currently seeking GIS capability jump on the bandwagon without
conducting a departmental specific cost-benefit analysis, in an effort to leap
forward into the GIS technical arena. This can lead to a quagmire of problems,
because the initial venture is not well defined. To remedy this situation,
there needs to be a clear understanding of the project goal, data needs and
availability, and hardware/software demands. This does not always require a
lengthy or formal strategic planning process. Such information can be gleaned
from an informal, less structured manner.
Sometimes this informal approach is taken
after the fact. Once a new GIS has been acquired, it is often useful to conduct
a cost-benefit analysis "to confirm or correct the course of action"
(Korte, 2000). That is, to readjust if needed, before acquiring any additional
components, and before committing any additional resources. The City of Tucson
Real Estate Division and its automation of the Real Property Inventory Maps is
an excellent example of how conducting a cost-benefit analysis and determining
the associated return of investment figure after the successful completion of
an initial project can help define the role of GIS within the department, and
secure future funding for expansion.
For the City of Tucson Real Estate Division,
an ROI analysis was performed after the completion of the initial project using
the Phillips’ technique of data classification and categorization formats
propounded by Darlene L. Wilcox in her paper entitled GIS Implementation
(Wilcox, 2000). Ms. Wilcox broke the analysis into GIS relevant categories for
the cost and benefit data requirements. From this example, categories where
then modified to reflect the situation at the City (see Tables 1 & 2).
|
Table 1. Cost Items (hard data) for the COT Real Estate Division Cost-Benefit Analysis |
|||
|
Cost Category |
Hard Data Description |
COT RE Expenditure |
|
|
Equipment |
Computers, including
annual maintenance and depreciation. Plotters and output media. Software,
including GIS software, related database software, including annual
maintenance fees. General Departmental Overhead applied to project (0.1% of overall departmental budget) |
Computer |
$ 3000.00 |
|
Network maintenance (for GIS station) |
$250.00 |
||
|
ArcView 3.0 software |
$ 750.00 |
||
|
Plotter acquisition cost |
$ 2000.00 |
||
|
Plotting cost |
$ 500.00 |
||
|
Overhead costs – project specific |
$ 869.99 |
||
|
Data |
Data acquisition and/or automation |
Pima County Data (no charge thanks to data sharing and intergov. agreements |
$ 0.00 |
|
Applications |
Project specific application development |
Payment to consultant |
$ 552.50 |
|
Staffing |
Dedicated project personnel salary including benefits |
Staff salary plus benefits |
$ 2557.69 |
|
Initial GIS training |
GIS training |
$ 495.00 |
|
|
TOTAL COST |
$ 10,975.18 |
||
|
Table 2. Benefit Items (soft data) for the COT Real Estate Division Cost-Benefit Analysis |
|||
|
Benefit Category |
Soft Data Description |
COT RE Benefit (converted to monetary values) |
|
|
Direct |
Savings from using GIS vs. current manual means for COT RE Division |
Time savings averaged for
1 year |
$ 17,815.20 |
|
Savings from having maps created in-house using GIS as opposed to out-sourcing |
Consultant costs |
$ 7810.00 |
|
|
Benefits from correcting errors in manual data |
Future time savings |
$ 2850.12 |
|
|
Increased Productivity |
Benefit of quality data |
$ Not included in calculation |
|
|
Additional organizational knowledge of GIS gathered, and applied to future projects |
Future time savings |
$ Not included in calculation |
|
|
Division/ Department |
Reflects better outcomes from having improved (more accurate, complete, and timely) information, as well as reducing waste |
Time savings and benefits of increased accuracy and timeliness |
$ Not included in calculation |
|
Government wide |
Increased efficiency throughout COT departments and divisions |
Time savings and benefits of increased accuracy and timeliness |
$ Not included in calculation |
|
Increased knowledge of GIS dispersed throughout the organization |
Future time savings |
$ Not included in calculation |
|
|
External |
Benefits which accrue outside of the COT, such as increased access to data by other governmental jurisdictions and the public |
Data availability to jurisdictions |
$ Not included in calculation |
|
TOTAL BENEFITS |
$ 28,475.32 |
||
(Adapted from Wilcox, 2000)
The use of less-than-precise estimates,
assumptions, and external data sources may concern some GIS managers, making
them hesitate to conduct soft data conversion to monetary values, or even
attempt to apply this process of ROI evaluation. In order to minimize these
concerns and raise credibility, Phillips (1997) suggests:
- Take a conservative approach when making
estimates and assumptions
- Use the most credible and reliable sources for
the estimates
- Explain the approaches and assumptions used in
the conversions
- When the results appear overstated, consider
adjusting the numbers to achieve more realistic values
- Use hard data whenever possible
Assumptions Used for
ROI Calculation
It was estimated that it would have taken
over 1000 man-hours to manually reproduce the Real Property Inventory maps,
resulting in a set of maps that were not easily updateable, and which would be
out of date before they were even completed. However, reproducing the maps
manually was not a likely scenario given that electronic base coverages in GIS
format did exist for the area. Therefore, this factor was not incorporated into
the cost-benefit analysis.
Hard Data Figures
The hard data figures used in the
cost-benefit analysis were determined from City of Tucson Real Estate Division
gross budget numbers and known GIS-related expenditures. See table below for
specific data references.
|
Table 3. References and Assumptions Used for the Hard Data |
||
|
Cost Category |
Hard Data Description |
Data Reference and Assumptions |
|
Equipment |
Computer |
Expenditure for Pentium II 400, with 21" monitor |
|
Network Maintenance (for GIS station) |
Estimate of internal expense for network upkeep |
|
|
ArcView 3.0 software |
Cost of ArcView 3.0 under government contract |
|
|
Plotter acquisition expenditure |
Initial expenditure for the HP 755 was approximately $10,000. The plotter was shared by 5 City departments, and the initial cost was divided between those departments. |
|
|
Cost of plots |
Estimated cost of plot (100 plots @ $5.00 per plot- include paper, ink, etc; $250 included for general maintenance cost) |
|
|
Overhead costs – project specific |
Overall project overhead calculated as 0.1% of Division’s gross budget of $869,990 |
|
|
Data |
Data acquisition and/or automation |
No cost to acquire data from Pima County |
|
Applications |
Project specific application development |
Payment to private consultant for Avenue script to automate the map production process |
|
Staffing |
Dedicated project personnel salary including benefits |
Salary of staff personnel based on 140 hrs to become familiar with AV and complete map production. Based on an annual salary of $38,000. |
|
Initial GIS training |
Cost of training for staff member |
|
Determinations of the costs associated with a
GIS often do not reflect the expenditures linked to previously existing
datasets such as the Pima County parcel base and street network used in the
Real Estate Division’s example. It is difficult to ascertain and assign a value
to Pima County’s expenditure for creating regional datasets such as these. If
one had figured what the ROI on the acquisition of a digital mapping system was
for the first several years after the inception of the Engineering and
Geographic information Services Department, the picture would have been pretty
bleak. However, many years later, the data created from that effort has become
invaluable to the community as a whole, including the City of Tucson and
surrounding jurisdictions such as the Town of Marana and Oro Valley. For this effort
of calculating a ROI for the Real Estate Division’s initial GIS project, a hard
data value was not assigned to the data previously created by Pima County since
it was provided to the City at no charge.
Soft Data Figures
Determining a ROI for general training or
GIS expenditures is not a documented and widely accepted "science",
with many techniques and process variables considered to be "soft"
benefits, such as labor savings and productivity increases. These figures can
only be derived from estimations. It is difficult to assign a dollar figure to
these soft data categories since the incorporation of a new technology often
drastically changes how an employee may approach a particular task or problem.
As mentioned earlier, the authors conservatively estimated each of the benefit
categories based on the best available knowledge. Some categories of benefits
are important to highlight because of their substantial impact within the Real
Estate Division, as well as throughout all City of Tucson departments and
divisions. These benefits most likely have a considerable financial impact on
the City, but due to difficulties in establishing a reasonable, quantifiable
figure, they were excluded from the calculation as noted in the tables. Had
these been included even with only very modest estimates, the ROI for this
project would have been substantially higher.
|
Table 4. References and Assumptions Used for the Soft Data |
||
|
Benefit Category |
Soft Data Description |
Data Reference and Assumptions |
|
Direct |
Savings from using GIS vs. current manual means for COT RE Division |
Time savings were based on an average salary of $38,000 for staff. Time allocated to accessing and verifying data manually was 1.5 hrs on average ($18.27 x 1.5 = $27.41). Time allocated for accessing current data over the City’s Intranet was 0.25 hrs on average ($18.27 x 0.25 = $4.57). It was assumed that the staff members would need to access this data five times a week. The hourly wage rate spent acquiring the data electronically five times a week was subtracted from the manual figure ($137.05 - $22.85 = $114.20). Based on 3 staff members accessing the data for one year, a savings of $17,815.20 was calculated. |
|
Savings from having maps created in-house using GIS as opposed to out-sourcing |
Consultant costs were estimated at 85 hours to complete the project, including initial and interim meetings, review of draft plots showing layout format, and plot generation time. The rate of $65 per hour was used (85 x $65 = $5525). Also, plotting cost of $30 for two draft plots, and 82 final plots @ $27.50 per plot totals $2285 for map plots. Total cost to the consultant was estimated to be $7810.00. |
|
|
Benefits from correcting errors in manual data |
Error correction and
tracking was estimated to take each staff member (based on 3), 1 hour per
week investigating possible or known errors for a full year. ($18.27 x 3 x 52 = $2850.12) |
|
|
Increased Productivity |
Not included in calculation |
|
|
Additional organizational knowledge of GIS gathered, and applied to future projects |
Not included in calculation |
|
|
Division/ Department |
Reflects better outcomes from having improved (more accurate, complete, and timely) information, as well as reducing waste |
Not included in calculation |
|
Government -wide |
Increased efficiency throughout COT departments and divisions |
Not included in calculation |
|
Increased knowledge of GIS dispersed throughout the organization |
Not included in calculation |
|
|
External |
Benefits which accrue outside of the COT, such as increased access to data by other governmental jurisdictions and the public |
Not included in calculation |
Calculating the ROI
The following method was used for the ROI
calculation:
(value of benefits) / (cost of acquiring GIS
technology) x 100 = ROI%
$
28,475.32 / $ 10,975.18 x 100 = 259.5%
Based on conservative benefit estimates
converted to monetary values for reproduction and automation of the Real Estate
Parcels maps, a return on investment of 259.5% was calculated. This is a
substantial ROI by any standards, and communicates that times have changed
within the GIS community. No longer does it take extensive expenditures in
hardware and software acquisition, data conversion, and years of expensive
staff training to utilize this technology effectively and demonstrate a high
return on the initial investment.
Conclusion
The purchase of a single license of ArcView
and utilization of readily available local data has dramatically changed how
business is conducted within the City of Tucson Real Estate Division. The Real
Property Inventory Map Replacement project successfully produced the new set of
maps in a timely fashion, with minimal effort and expenditure. In order to
justify the further support of GIS within the Division, a cost-benefit analysis
was conducted and a return of investment of 259.5% was calculated. This figure
is based on very conservative estimates of the benefits experienced by the City
since the acquisition of ArcView software. Several thousand dollars have been
saved thanks to the use of GIS technology. This information, and particularly
the ROI figure, will be used to help justify to decision makers inside and
outside of City government that further support of GIS technology is warranted.
Acknowledgements
The authors would like to extend their
thanks to Pima County Technical Services for their continued support of the
expansion GIS technology within the Tucson community, as well as their time and
effort spent reviewing portions of this paper. Also, we would like to thank
Tracey Gutheim and Howard Ward of TerraSystems Southwest, Inc. for their input
and meticulous review of this paper.
APPENDIX
A: Map Production Script
'-------------------------------------------------------------------------
' Name: cot.View.MakeQtrTwnships
' File: d:\terrasys\projects\cotdot\realestate\parcelmaps\qtrtwn.ave
' Headline: Tile Regional Parcels by selected
polygons in active theme
' Self:
' Returns:
' Description: Creates a new parcel shapefile for
parcels who's center
' falls completely within each selected polygon of the
active
' theme. Each
selected polygon in the active theme results in
' a new parcel shapefile written to disk.
'
' Requires: The view be active,
' Only one active
theme,
' A Regional
Parcel Theme
' History: original coding howard ward 01/06/00
'-------------------------------------------------------------------------
'GETACTIVE THEME
lst_ActiveThemes = av.GetActiveDoc.GetActiveThemes
'CHECK THAT ONLY ONE THEME
IS SELECTED
if (lst_ActiveThemes.Count
<> 1) then
MsgBox.Error("More than
one theme is active." , "Make Quarter Townships")
exit
end
'VERIFY THAT THEME IS
POLYGON THEME
for each t in
lst_ActiveThemes
fld_Shape =
t.GetFTab.FindField("Shape")
if (fld_Shape.GetType
<> #FIELD_SHAPEPOLY) then
MsgBox.Error("This is
not a polygon shapefile.", "Make Quarter Townships")
else
thm_Active = t
vtb_Active = t.GetFtab
end
end
'GET THE PARCEL THEME
lst_AllThemes = av.GetActiveDoc.GetThemes
thm_Parcel = ""
for each t in lst_AllThemes
if (t.GetName =
"Regional Parcels") then
thm_Parcel = t
vtb_Parcel = t.GetFTab
break
end
end
if (thm_Parcel =
"") then
MsgBox.Error("Regional
Parcel Theme not Found.", "Make Quarter Townships")
exit
end
'CHECK TO SEE THAT ONE OR
MORE RECORDS IN ACTIVE THEME IS SELECTED
if
(vtb_Active.GetSelection.Count <=0) then
MsgBox.Error("Active
Theme must have at least one record selected.",
"Make Quarter
Townships")
exit
else
bmp_Active = vtb_Active.GetSelection
vtb_Active.RememberSelection
end
'FOR EACH SELECTED RECORD IN
ACTIVE THEME, CAPTURE ITS QUARTERTWN NUMBER IN LIST
lst_qtwnships = {}
fld_qtwnshipno =
vtb_Active.FindField("Quartertwn")
if (fld_qtwnshipno = nil)
then
MsgBox.Error("Quarter township
field not found in active theme", "Make Quarter Townships")
exit
end
for each rec in
thm_Active.GetFTab.GetSelection
str_qtwnshipno =
vtb_Active.ReturnValue (fld_qtwnshipno, rec)
lst_qtwnships.Add(str_qtwnshipno)
end
'FOR EACH QUARTERTWN NUMBERIN
THE ACTIVE THEME
for each n in lst_qtwnships
'RESELECT THE ACTIVE THEME
str_Query =
"[Quartertwn] = " + n.quote
vtb_Active.Query(str_Query,
bmp_Active, #VTAB_SELTYPE_NEW)
vtb_Active.UpdateSelection
'OVERLAY TO SELECT PARCEL
vtb_Parcel.SelectByFTab
(vtb_Active, #FTAB_RELTYPE_HASCENTERWITHIN , 0, #VTAB_SELTYPE_NEW)
'WRITE OUT THE PARCEL TO NEW
SHAPEFILE
str_NewShape =
"pa" + n
fnm_NewShape =
str_NewShape.AsFileName
vtb_Parcel.Export
(fnm_NewShape, Shape, True)
end
'RESET ORIGINAL SELECTION ON
ACTIVE THEME
lastSelection =
vtb_Active.GetLastSelection
vtb_Active.SetSelection(
lastSelection.clone )
vtb_Active.UpdateSelection
References
Korte, George. 2000. Will a GIS Consultant
Lead You to a Geospatial Paradise or Wasteland? Available online from the GeoWorld
website: http://www.gisworld.com/gw/2000/0400/0400will.asp
Phillips, Jack J. 1997. How Much Is the
Training Worth? Available on the American Society for Training and Development
website: http://www.astd.org/CMS/templates/template_1.html?articleid=11019
Phillips, Jack J. 1997. Was it the Training?
Available online from the American Society for Training and Development
website: http://astd.org/CMS/templates/template_1.html?articleid=11016
Webster, Avis L. and Lombard, Kristi. 1999.
GIS Implementation: Measuring the Value of Lifelong GIS Learning. Available
online from 1999 Esri Conference proceedings on the Esri website: http://www.Esri.com/library/userconf/proc99/proceed/papers/pap496/p496.htm
Wilcox, Darlene L. 2000. GIS Implementation.
Available online from the GeoWorld website: http://www.gisworld.com/gw/2000/0200/0200wlcx.asp
Author
Information
David Koss
City of Tucson Real Estate Division
GIS/ Systems Analyst
P.O. Box 27210
Tucson, Arizona 85726-7210
Phone: (520) 791-4181
Fax: (520)
791-5641
Email: Dkoss1@ci.tucson.az.us
Cheryl A. Karrer
TerraSystems Southwest, Inc.
Principle/Senior GIS Analyst
4922 W. Paseo de Las Colinas
Tucson, Arizona 85745
Phone: (520) 743-8360
Fax: (520)
743-0339
Email:
Ckarrer@terrasw.com