John C. Cartwright and Ted Habermann
Managing and distributing geospatial data at NGDC
Advances in internet technology have made it easy to "publish" data and have dramatically shortened the timeline from data collection to distribution. The challenge now lies in meaningful presentation of these data.
At NGDC, we need to serve heterogeneous data hosted on a distributed network of machines. These data must be presented in multiple "views", often integrating different datasets in the display. GIS and web clients are being used to access these data which reside in SDE and traditional RDBMS. The database is used not only for retrieval, but also as a tool to facilitate data QA/QC and the generation of metadata.
The Big Picture
Being able to serve maps on the internet is an important new capability for federal data providers. These maps, and geographic information systems in general, take advantage of place as a far-reaching data integrator. They unite diverse datasets in a single familiar and easy-to-use presentation. As data providers we understand that these datasets may have different quality levels and histories that are not apparent in the end products. Some of our users may not be aware of those differences, and some may not care. In either case, as federal data providers and integrators, it is clearly our responsibility to make this supporting information available with the maps and to develop techniques for helping users construct meaning from the maps.
At NOAA's National Geophysical Data Center we are addressing this broader problem by building systems that integrate several tools with the internet map server. These tools include 1) a data dictionary, 2) FGDC compliant metadata, 3) quality assessment tools built on relational database systems, and 4) websites for many audiences. All of these tools are integrated into web-based interfaces. Our goal is to develop a system that supports internal data management and improvement as well as public access to these data.
The Data Dictionary
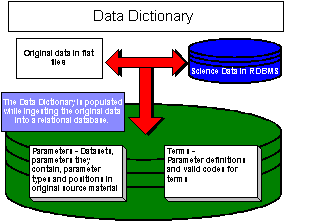
| The datasets stewarded by NGDC include a wide variety of scientific parameters in addition to location. We term these the "science" tables (they are synonymous to the "business" tables in Esri's literature). The data dictionary serves as a repository for information about these parameters and the datasets that they occur in. The schematic structure of the data dictionary is shown in Figure 1. It holds definitions and valid values of the parameters included in the all of the data sets. Information about what parameters exist in which datasets and the format of those parameters in the original dataset are also included. This information is used to create the connection between the data dictionary and the datasets and can be used to automate the data ingest and update process.
|  |
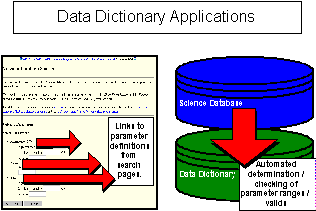 |
One important application of the data dictionary is to provide access to a glossary of the scientific terms that exist in a data collection. On the web this can be easily accomplished by providing links from the occurrences of those terms to their definitions in the data dictionary (Figure 2). One could even imagine an automated process for creating those links. This application is particularly important for websites designed to serve audiences with a variety of scientific or disciplinary expertise. |
A second application of the data dictionary is in the automation of the process of range and valids checking for parameters in a dataset or an update to a dataset. A user might be interested in not only in datasets that include a particular parameter (i.e. earthquake magnitude), but in datasets that include earthquakes with magnitudes that are smaller than 3.0. The parameter table in our data dictionary design (or its equivalent) can easily yield the datasets that include a particular parameter. Straightforward SQL can then provide the ranges of that parameter in the datasets. This same approach can be used to compare the range for parameters in an update to a dataset to the ranges in the archive for that dataset. This comparison allows data managers to identify and address data problems prior to adding the update to the archive.
FGDC Metadata
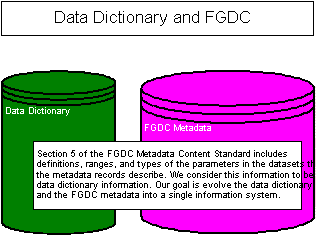
| NGDC maintains an extensive collection of FGDC compliant metadata for the datasets that we steward. The relationship between the data dictionary as described above and FGDC metadata is an interesting and potentially very powerful one. Section 5 of the FGDC Metadata Content Standard overlaps many of the fields that we have included in our data dictionary (Figure 3). Specifically, it includes the attribute (parameter) definitions as well as ranges associated with the parameters. It also includes a mechanism for grouping attributes, the entity type. |
 |
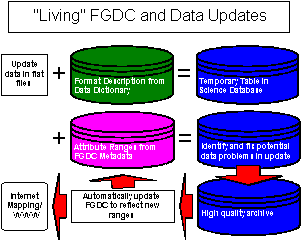 |
Our goal is to evolve our data dictionary and FGDC databases into a single data system that minimizes redundant data storage and maximizes capabilities. In this scenario the FGDC metadata becomes an active and important part of the data system rather than a relatively inactive archive as it has been treated in the past. We term this "Living Metadata". The metadatabase serves as a summary of the science parameter range information that can be accessed more quickly than it can be calculated "on-the-fly". When web users seek the range of a given parameter in a particular dataset, it is the FGDC that will provide that answer quickly. This capability will also be used during the database update process (Figure 4). When an update to a dataset is received the parameters in the dataset and their formats are determined from the data dictionary. The update is ingested into a temporary table and the ranges of the parameters are determine using SQL. Those ranges are then compared to the parameter ranges for the dataset in the FGDC record. If the comparison indicates a potential problem, i.e. the update ranges are wider than expected, the data manager can examine the update in more detail and identify and fix the problem. After the update is corrected, it is added to the archive, new ranges are determined if necessary, and the data become available to the website for mapping or other applications.
|
The FGDC Metadata Content Standard also includes a section (2.5) for tracking the history of processing, or the lineage, for datasets. Our general approach is to get data into a relational database so that it can be processed using standard SQL statements. These statements can be stored in the lineage section of the FGDC record to provide an automated system for processing data updates into the archive.
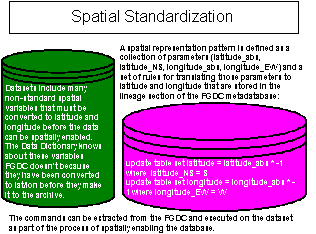
One important application of this capability is the standardization of spatial representations. Data come to NGDC with a myriad of combinations of parameters for representing latitude and longitude. Sometimes it is actually latitude and longitude, sometimes it is the absolute value of latitude / longitude with either an N or S or E or W to represent the hemisphere, sometimes a blank means N, sometimes a blank means S. It is generally a mess.
| It is necessary to clean up this mess before the dataset can be spatially enabled. This process involves 1) recognizing the pattern used for the given dataset based on the parameters it contains and 2) executing the series of SQL statements required to translate the existing variables to decimal latitude and longitude (Figure 5). The same approach can be used to standardize temporal representations. These statements are stored in lineage section of the FGDC. Our goal is to retrieve these statements from the metadata and execute them whenever an update to a dataset is received and processed. This approach can yield a substantially automated data ingest process based on FGDC while at the same time preserving the history of processing for the dataset. |
 |
Database Quality Assessment
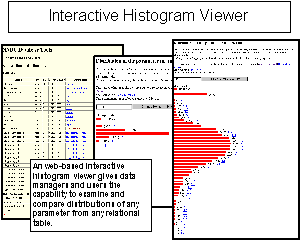 |
Understanding and improving the quality of data has become increasingly important with the flood of data now available on the internet. Our data quality assessment goals for the science tables are to provide answers to four questions: 1) What parameters are included in a dataset, 2) What are the ranges of those parameters, 3) What are the distributions of the parameters, and 4) What are the relationships between the parameters. The first two questions can be answered directly using FGDC metadata as discussed above once the metadata is populated using the SQL based methods we discussed above. The third question can also be answered using SQL and a simple, yet flexible HTML histogram viewer (Figure 6). This interface allows users to examine the distributions of parameters, to interactively adjust the resolution of the histogram, and to retrieve the data from any bin for closer inspection. The fourth question can be addressed using a graphing tool that allows users to plot any two parameters from the dataset against one another. Such a tool can be built using a wide variety of COTS or GOTS graphing tools written in an equally wide collection of languages. |
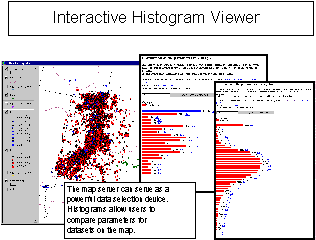
| All of these tools become significantly more powerful when they are combined with a GIS driven spatial selection tool integrated into an internet mapping environment (Figure 7). In that case, the user is presented with an unprecedented array of tools for comparing multiple datasets for the same region. In many cases these datasets will contain the same parameters and the comparison will provide important information about the uncertainty associated with that parameter. Examples might include earthquake magnitude estimates from multiple overlapping catalogs or estimates of the same climate parameter from different observing systems, either ground- or satellite-based, or from different time periods. |
 |
Websites for Multiple Audiences
 |
The need to present many heterogeneous datasets to a wide variety of users is a difficult challenge faced by many government data providers. The elements we have discussed so far are integrated and accessed using a web browser and are, therefore, available to a wide variety of audiences from internal data managers to scientists to the general public.
It is unlikely that these diverse audiences are interested in the same aspects of the databases being presented or that data managers want to present the same information to all of their audiences.
We have developed an approach to this problem that allows us to embed the same queries into dynamic pages designed for different audiences or for different websites.
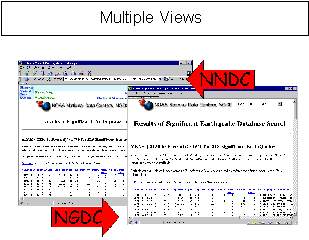
Figure 8 shows the results of the same query displayed in a page with frames for the NOAA National Data Centers (NNDC) and in a page for NOAA's National Geophysical Data Center (NGDC).
The same databases and retrieval engines support both of these pages.
|
Conclusion
Using the World Wide Web to make e-government a reality will be a challenging task for all federal data providers.
In order to be successful at this task we must create systems that build on existing
foundations and help users understand the quality and history of the data they are receiving. We have discussed
how the Data Dictionary, the FGDC Metadata, and simple graphical components of the Geospatial Data Management
System at NGDC will work with our Internet Mapping capability to help data providers and multiple data user
communities achieve this understanding.
John Cartwright
Associate Scientist
Cooperative Institute for Research in Environmental Sciences (CIRES)
University of Colorado / NOAA National Geophysical Data Center
jcc@ngdc.noaa.gov
|
Ted Habermann
Information Architect
NOAA National Geophysical Data Center
Ted.Habermann@noaa.gov
|
