The Integration of ArcView/3D Analyst and 3D Simulation Technologies for Interactive Visualization of Urban Environments
Brian E. O’Toole, ITspatial
LLC
Mary Beth Fletcher,
Arlington County GIS Mapping Center
Russell Banks, Arlington
County GIS Mapping Center
Abstract
The Arlington County Department of Public Works GIS mapping center has embarked on a project to develop a real-time 3D visualization capability that is derived from, and totally integrated with the County’s GIS infrastructure. The objective of the project is to develop the tools and processes that will provide the County with the capability to interactively visualize, in both two and three dimensions, selected areas of interest within the County. With this technology, Arlington County’s GIS Mapping Center will be able to support the needs of various County agencies involved in economic development, community development, and public safety. The following paper will discuss several key elements of this project, which include the production of real-time urban databases, and the development of a real-time 3D viewer with the ability to interactively query and display associated GIS information in ArcView. Specifically, the paper will present the process through which a photographically realistic 3D database of Arlington County was produced utilizing Esri’s ArcView GIS and MultiGen-Paradigm’s 3D modeling tool CreatorÔ. Issues relative to interactive real-time visualization, database query mechanisms, and 2D/3D correlation will also be addressed. Finally, examples of the completed database will be presented.
Introduction
Arlington
County’s Department of Public Works GIS Mapping Center and ITspatial have
developed an extension to the County’s Esri based GIS to support interactive 2D
and 3D visualization of existing and planned urban developments. A 3D
photo-realistic database was produced encompassing a fifteen-block area of
Rosslyn, Virginia, spanning from the Key Bridge to the Iwo Jima Memorial.
Employing state of the art real-time 3D modeling and simulation technologies,
the database was constructed from the County’s GIS data and available imagery.
Further, a real-time 3D viewer was developed as an extension to ArcView with
the ability to interactively query and display GIS information in both two and
three dimensions. With this technology,
Arlington County’s GIS Mapping Center will be able to support the needs of
various County agencies that are involved in economic development, community
development, and public safety.
The
primary technical objective of the project was to demonstrate the feasibility
of integrating high fidelity real-time 3D modeling and visualization
technologies within the existing GIS infrastructure of the County. Issues
related to GIS database attribution, accuracy, and correlation for 3D
visualization were of primary interest. The project was a joint development
between ITspatial and Arlington County providing for the development of a
solution, which encompassed the following:
§
The
production of a real-time photo real 3D database from the County’s GIS source
data
§
The
development of a real-time 2D/3D visualization solution capability of running
on a PC
§
The
development of an interactive 3D viewer and query interface as an extension to
ArcView
§
The
development of a methodology for connectivity between the 3D model and 2D GIS
data
The
following paper provides an overview of the project addressing two major areas
of interest, the production of real-time 3D Urban databases from GIS data, and
the development of an extension to ArcView for interactively querying and
navigating in both two and three dimensions.
Overview of the Rosslyn Database
A photo realistic real-time 3D database of Rosslyn was developed from the GIS data of Arlington County. The database covers a geographic area of roughly one square mile extending from Key Bridge to the Iwo Jima Memorial. The database includes an accurate representation of the terrain contour with detailed representations of streets, pathways, buildings, vegetation, and culture. As illustrated in Figure 1, imagery and photo textures were used to enhance the 3D model to provide a realistic representation of the urban environment. The utilization of data provided by the County such as maps, GIS, and imagery ensured accurate placement of buildings, streets, pathways, light posts, benches and other cultural features. A site survey was conducted at the outset of the project to fully document the area of interest and identify important features to be included in the database. At that time, additional data, video, and photographs were collected to augment the existing source data.
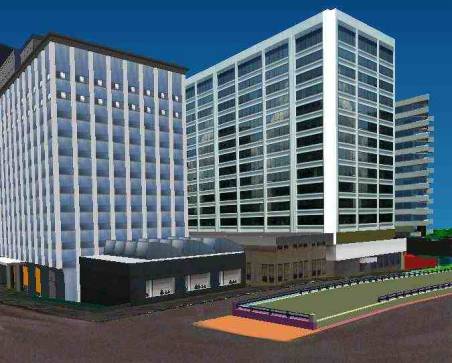
Figure 1 - A sample image of the Rosslyn Database
Overview of the Database Production Process
The
production of the real-time 3D database of Rosslyn was accomplished by
employing a proven methodology that has been developed and refined over the
years in the course of producing simulation databases for the military and
aerospace industries. At the heart of the problem is the need to produce a
database that can be efficiently rendered at frame rates conducive for a
positive interactive experience. This means achieving a frame rate performance
of at least 12Hz on a PC level machine. With the detail and complexity that
exists in urban environments this requires that the database be designed and
optimized from the beginning with real-time performance in mind. This
translates to a problem of scene management where polygon density, database
hierarchy, level of detail management, and texture management are critical to
meeting real time objectives. For the most part, the ability to build and
render the database for real-time performance is what differentiates modeling
and simulation tools from companies such as MultiGen-Paradigm from other
products that have typically been developed as extensions to the GIS. The best solution at this point is to combine
the inherent elements of the GIS with the tools and processes employed within
the real-time simulation community.
Although
previous applications of this technology revolve around flight simulators and
large-scale terrain databases the process is essentially the same. The primary difference for urban GIS
applications is in the resolution and density of the source data surrounding
the area of interest. For the most part, the data that exists in most GIS
systems has very good resolution and is significantly more accurate than the
data used in military applications. The production process is very much the
same but the potential for very accurate and detailed databases is much higher
and can be achieved with the introduction of an efficient methodology for
source data management and 3D modeling.
For the Arlington County project the processes and steps that were
employed included the following:
§
Source
Data Collection, Correlation, and Correction
§
Base
Terrain Skin Generation
§
Building
Placement and Extrusion
§
Detailed
Modeling and Texturing
In
the following sections the issues related to each of these processes will be discussed
and examples of the intermediate data and database products will be presented.
Source Data Collection, Correlation, and
Correction
The
production and maintenance of high fidelity geo-specific urban databases has
traditionally been an expensive and time-consuming process. Most of the cost in producing these databases can
be attributed to the lack of data of sufficient quality. The uncorrelated nature of available data
requires users to correlate elevation data, vector representations of feature
data, and available imagery before the generation of the database can
begin. This correlation process can be
labor intensive and is typically not scaleable. Fortunately, most GIS organizations have a wealth of data
including contour maps, LIDAR, road networks, building footprints, and
orthographic imagery. In one form or another all of these sources can be used
to build an accurate 3D database. The primary issue is that most GIS databases
were not designed with 3D-database production in mind. Therefore some level of
correction and additional attribution is necessary for the development of an
accurate 3D model. Ultimately, if 3D becomes a common element of the GIS then a
strategy for incorporating 3D information into the database design standards
should be considered. In the case of
the Rosslyn database, the following source data, illustrated in figure 1, was
available and employed during the production process:
§
5ft
contour (elevation) data derived from orthographic photos
§
LIDAR
data – 1ft elevation resolution at 5ft postings
§
Building
footprints stored as layers in the GIS – originally digitized from Mylar
§
Shorelines
stored as a layer in the GIS
§
Sidewalk
and road networks stored as a layer in the GIS
§
Digital
photos of buildings, parks, and cultural features
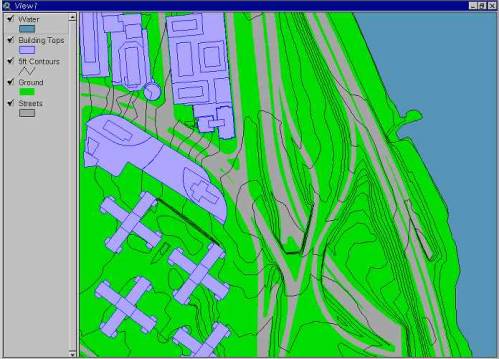
Figure 2 – GIS Source Data Utilized in
the Production of the Rosslyn Database
Base Terrain Skin Generation
The
generation of the base terrain skin was the first step in the actual database
production process. The objective was to build an integrated polygonal mesh,
which accurately represents terrain slope and elevation, location of road
networks, and location of shorelines. Base terrain skin is typically generated
as a triangular irregular network (TIN). This approach provides effective
spatial organization of the data and structurally supports level of detail
management schemes for consistent polygon processing. In the production of the
Rosslyn database, a constrained triangulation algorithm was used to tessellate
the terrain. The algorithm takes as input elevation data, street edges and
shoreline edges from the GIS. By defining control parameters, algorithm constraints
can be placed on the generation of the mesh. Further, by constraining the mesh
to the street edges in the GIS data, roadways are efficiently built into the
terrain skin. The resultant mesh, illustrated in Figure 2, is stored in the
industry standard OpenFlightÔ format. This open standard,
developed by MultiGen-Paradigm, Inc., provides the basis for the real-time
structure and organization of the total 3D database.
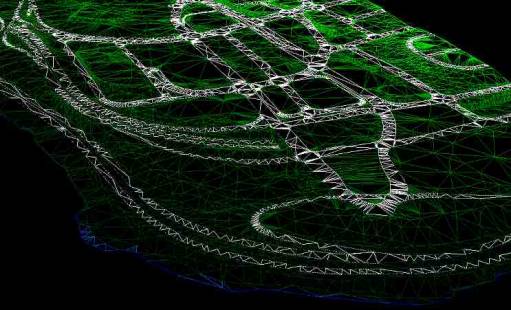
Figure 3 – Base Terrain Mesh of Rosslyn
Building Placement and Extrusion
With
an accurate terrain skin in place, the integration of building footprints and
the insertion of building geometry was a relatively straightforward process. Since time was spent early in the process
correlating the data in the GIS, building footprints fell into place very
nicely and were geo-spatially accurate. For the generation of building geometry
several modeling options were available.
For this project, 3D analyst was used for the tessellation of basic
building geometry. A VRML import utility was used to ingest the building models
into CreatorÔ, MultiGen-Paradigm’s
popular real-time 3D modeling tool. Once the model was in CreatorÔ, extensive geometric details were added and
photo-real textures were applied. At this point in the process, the inherent
limitations of 3d information stored in the GIS had been reached. As an example,
details surrounding the underlying building infrastructure including plazas,
common areas, and garages were not maintained in the GIS. The usable
information within the GIS was exhausted and the 3D data associated with the details
of the environment were derived or extracted from photographs, CAD drawings, or
blue prints. This aspect of the production represents the transition into the
detailed modeling and content creation phase.
Detailed Modeling and Texturing
The
final step in the production process is the detailed hand modeling of culture
and the application of photo textures to the building and site models. This
phase of the project represents the creation of content, which ultimately
provides the compelling realism of the database. Since this aspect of the
production involves a creative element, it is important to understand the
objective of the database, essentially this phase can continue indefinitely.
For the Rosslyn database, Creator was used to model and texture the following
database components:
- Roads, curbs, and
sidewalk surfaces
- Trees, light poles, streetlights,
and benches
- Detailed Geometry on
buildings
- Overpasses and park
areas
As
part of this process a library of OpenFlight models were developed. With this
library in place, common models of features such as lampposts, signal lights,
trees, and parking meters could be replicated and utilized throughout the
database.
ArcView Plug-in for Interactive 2D and 3D
Viewing
An
extension to ArcView was developed providing a seamless extension of the GIS to
support fully interactive 3D visualization. The goal was to extend the GIS
interface with a 3D view that is correlated with the 2D information presented
in ArcView. With this extension, the user is able is navigate in real-time the
photo realistic 3D database and interactively query information in both two and
three dimensions. The key attributes of
the extension are:
- The 3D view functions
in parallel with the standalone GIS tool (ArcView)
- The selection of
features is fully correlated between all three data views – tabular, 2D,
and 3D.
This
extension provides the user with the ability to select features in any data
view, and will have the selected features presented immediately in the other
views.
Major User Interface Functions
The
ArcView extension provides the four major functions that are listed below. A brief description of each functional
capability is provided.
§
Select
Features in ArcView
§
Select
Features in 3D
§
Navigate
in 3D
§
Configure
3D view
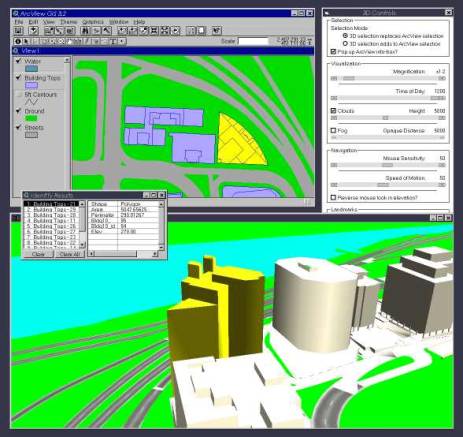
Figure 4
Integrated 2D/3D User Interface
Select Features in ArcView – The normal mechanisms for selecting features within ArcView are maintained with the integration of the 3D visualization extension. Within ArcView, the user may cause one or more features in one or more themes in the ArcView Window to become selected. When a selection is made in the GIS data, this selection is reflected in the 3D visualization with highlight coloring of the object.
Select Features in 3D - At any time, the user can use the mouse to select features in the 3D view, with a simple mouse button click. The visualization application determines the ArcView theme and a feature index number for the indicated feature from information attached to the scene graph, and communicates this theme and feature reference to ArcView. This selection can become the current selection in ArcView, or is available for use in a user script.
Navigate in 3D - Control mechanisms and a motion model were developed to allow the user to easily navigate the eye point within the 3D scene. Through either mouse or keyboard controls the user can move forward, backward, left, right, up and down. Additional controls are provided to control the orientation or rotation of the eye point. A sophisticated motion model allows the navigation to occur at a rate proportional to mouse velocity, providing the ability to tightly control the viewpoint and perspective from any location in the database. Optional collision detection processing is provided to prevent users from flying out of the database or through objects in the scene.
Configure 3D View – A control panel is provided to allow the user to modify the nature and behavior of the visualization window. Parameters such as field of view, time of day, and motion sensitivity can be controlled through the consolidated user interface.
Software Architecture
The 3D viewing extension has been developed to extend Arlington County’s ArcView GIS 3.2. The extension mechanisms available in ArcView are the Esri Avenue scripting language with inter-process communication through DDE. However, recent Esri products are extensible through a COM based architecture, and this has been considered in the design. The initial version of the software provides a user interface panel and a visualization window to the desktop of a single monitor PC computer running the ArcView software. The software architecture is an object-oriented design consisting of three main components including ArcView GIS, a consolidated user interface, and the visualization application. For this project the 3D rendering was implemented using MultiGen-Paradigm’s VegaÔ.
Summary
A photo realistic real-time 3D database of Rosslyn was developed from the GIS data of Arlington County. The database covers a geographic area of roughly one square mile extending from Key Bridge to the Iwo Jima Memorial. The database includes an accurate representation of the terrain contour with detailed representations of streets, pathways, buildings, vegetation, and culture. Imagery and photo textures were used to enhance the 3D model to provide a realistic representation of the urban environment. The utilization of data provided by the County such as maps, GIS, and imagery ensured accurate placement of buildings, streets, pathways, light posts, benches and other cultural features.
The ability to integrate 2D and 3D information has been demonstrated with the development of a 3D visualization extension to ArcView. Further, a methodology for dynamic connectivity between the 2D GIS and 3D database was developed.
The objective of the project were met with the tools and processes in place to provide the County with the capability to interactively visualize, in both two and three dimensions, selected areas of interest within the County. With this technology, Arlington County’s GIS Mapping Center will be able to support the needs of various County agencies involved in economic development, community development, and pubic safety.
Acknowledgements
The
authors would like to acknowledge Will Richards and Dave Unrau of ITspatial for
their contributions to this paper and the outstanding effort that went into the
development of the database and the ArcView extension.
Author Information
Brian
E. O’Toole
Senior
Partner, ITspatial LLC
(703)
506-3969
Manager,
Arlington County GIS Mapping Center
Mfltec@co.arlington.va.us
(703)
228-3649
Russel
Banks
Cartographer,
Arlington County GIS Mapping Center
Rbanks@co.arlington.va.us
(703) 228-7568