Andreas Siebert - Munich Reinsurance Company, Munich
This paper provides comprehensive information on the exposure to windstorm, earthquake, storm surge, hail, lightning stroke, and other natural events. Thus, it can be used as an aid in risk management for insurance purposes, catastrophe preparedness, and public planning projects.
The Munich Reinsurance Company - Münchener Rückversicherungs-Gesellschaft or Munich Re for short - is a leading international "insurer of insurers". It operates from its head office in Munich (Germany) and via more than 60 reinsurance subsidiaries, branches, service companies and liaison offices worldwide.
Its business partners are insurers in more than 160 countries. These insurers transfer to the reinsurer those parts of the risks they assume - be it in personal lines business or in commercial insurance - which they require help in carrying.
Most of the information collected and processed by the insurance industry is spatially related (about 80% of all data). So insurers, reinsurers, and brokers are increasingly coming to recognize the value of GIS tools in analysing geodata. These powerful aids can be used for the most varied of jobs in the sectors of marketing and risk management.
At Munich Re GIS technology is mainly used at present in the Geoscience Research Group, where the scope of work includes the analysis of natural perils and natural catastrophes. In the context of the dramatic increase in the exposure to losses caused by natural catastrophes, the role played by GIS, especially for risk assessment, is becoming more and more important.
Figure 1: Great Natural Disasters 1950–1999 (Far exceeding 100 deaths and/or US$ 100m in claims)
Windstorms, earthquakes, storm surges, hail, lightning, and other natural events cause damage amounting to billions of dollars throughout the world every year, much of which is covered by insurance and reinsurance.
Munich Re’s World Map of Natural Hazards provides information on all of these hazards and can be used as an aid in risk-commensurate insurance rating, catastrophe prevention and public planning. The World Map was first published 20 years ago and has now been brought up to date with the most accurate and current scientific data available. It has also been supplemented with additional data on hazards and other background information.
Figure 2: World Map of Natural Hazards
In the third edition, all base level data was captured, adjusted and analysed using ARC/INFO 7.1 (Windows NT) and ArcView 3.0a. The resulting map in DIN A0 form was produced exclusively with the aid of digital cartography (MaPublisher 3.0, Adobe Illustrator 7.0). This means that changes can be incorporated quickly and the latest scientific data can be made available even faster than before.
Earthquakes are generally regarded as the most destructive force of nature. In order to represent global earthquake exposure according to its intensity, numerous regional and local investigations were related to a uniform exceedence probability. Other geophysical aspects include particularly dangerous volcanoes and the exposure of cities to subsoil resonance effects.
Since way over 90% of all earthquakes happen in areas where large tectonic plates converge, an auxiliary map on plate tectonics has also been produced to give deeper insight into this subject.
The exposure to tropical windstorms was determined using a risk analysis program specially developed by Munich Re. The values were then classified and visualized in exposure zones on the basis of windstorm intensity. The map includes, besides the exposure zones, the main tracks of tropical and extratropical windstorms. Further maps on the subject of windstorm provide information on the exposure to tornadoes and regional windstorm systems like the Chinook, Mistral, and Föhn. Coastal exposure to storm surges – combined with seismic sea waves (tsunamis) – is also presented.
Further important natural hazards such as torrential rain, hail, and lightning stroke are also presented on auxiliary maps. The most varied of methods were again used in recording and analysing the data. Satellite photographs were analysed, for example, for the subject of lightning exposure and compared with observation data from ground-based lightning detection networks.
The auxiliary map on climate change is a real innovation. Firstly, it deals with the effects of El Niño, which attracted enormous attention in 1997–98 and triggered numerous natural catastrophes. It also shows some of the effects that global warming is expected to have on natural hazards.
On the same basis as the World Map of Natural Hazards, Munich Re´s Geoscience Research Group has also developed – likewise in completely digital form - a Globe of Natural Hazards. For this globe, the main map was divided into twelve segments and projected. These segments were then printed on special paper and mounted on a sphere by hand.
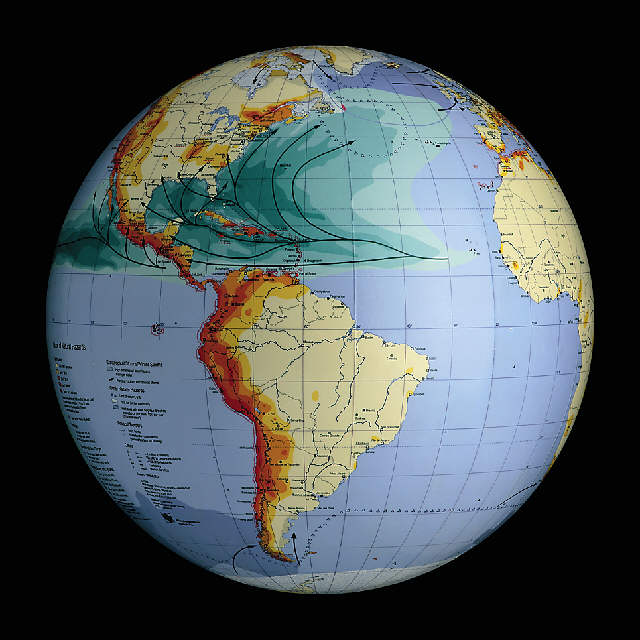
Figure 3: Globe of Natural Hazards
A CD-ROM version of the World Map of Natural Hazards is in the final stages of production containing many additional functionalities. These new functions include targeted search and facilities for positioning on specific countries and cities. In addition, multimedia techniques present basic scientific knowledge in an attractive and modern way. The GIS based datasets 0were transferred to the Macromedia environment for CD-ROM production.
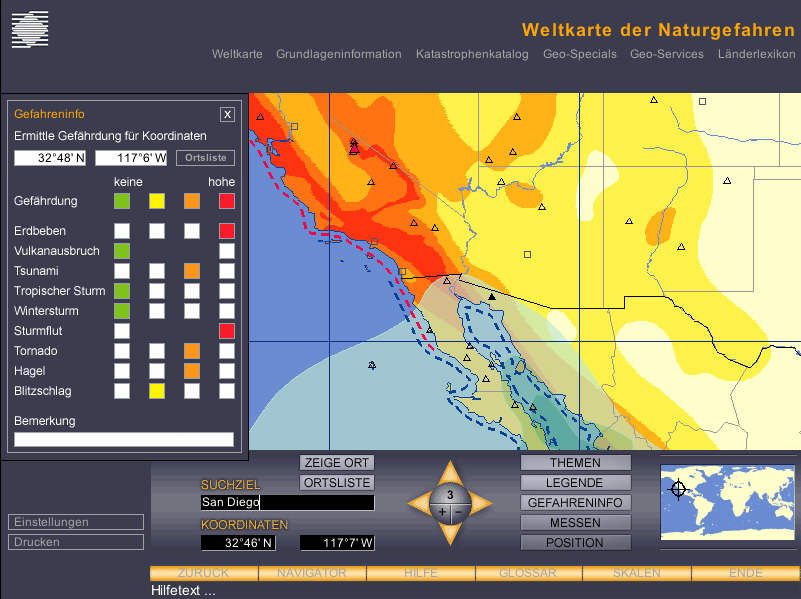
Figure 4: CD-ROM "World of Natural Hazards" (hazard information by city)
A logical further development of marketing-oriented applications is to link them up with geoscientific data. This means in particular examining the intensities of natural hazards and the areas in which they evolve with the aim of determining the extent to which they affect the size of losses and catastrophes. In the following we shall present some examples of applications in the sector of natural hazards and catastrophes:
When cartographic and other basic geoscientific information is linked up with socio-economic parameters and underwriting data, the spatial distribution of liabilities can be represented and analysed in cartographic form and in terms of the exposure to natural hazards. This form of risk management may be performed in various degrees of detail down to the specific address of a single risk.
Figure 5: Distribution of liabilities - The representation of how liabilities are distributed makes it easy to identify concentrations and accumulations of liability. This example map of Germany presents the liability distribution of a windstorm portfolio (light green = low liabilities, dark green = high liabilities) and two different hailstorm areas.
Natural hazards may constitute an appreciable accumulation risk in an insurance portfolio. In a GIS-aided accumulation control system, the dynamic developments of the portfolio's figures and structures and the natural hazard situation, which may also be dynamic, can be analysed alongside each other in an efficient manner. This means that concentrations of accumulation can be quickly identified and quantified, thus allowing the underwriter to take the steps that are required (reinsurance or retrocession, cession limits, limitations on liability, etc.).
This technology can also be put to effective use after a loss event for the purposes of analysis. Loss patterns may reveal potential hot spots at an early stage. After a major earthquake catastrophe, for example, various factors are fed into the GIS:
- loss profile
- geology and subsoil
- seismological data
- intensity-loss functions
- information on the building stocks
- underwriting information
The loss dependencies that can be derived from this information can be evaluated for insurance and engineering purposes (for example, for loss scenarios and building regulations / codes).
Linking up basic maps with the latest information - such as the track parameters (coordinates, track speed, pressure values, and wind velocities) of a tropical cyclone, which can be obtained from the Internet - makes it possible to follow a natural event in real time, so to speak. Using the meteorological parameters it is possible to calculate the area that will be affected by a hurricane, graded by wind velocities, and to a certain degree forecast it days in advance. The stretches of land that have already been affected – or will be affected – can be analysed exactly and the loss potential determined. Modelling makes it possible to determine the losses to be expected in any chosen area. When historical events and the respective business volume of individual cedants are taken into account, individual loss ratios can be calculated as average or probable maximum losses (PML).
Figure 6: Accumulation control and modelling windstorms for norwegian fish farms
The next step which is scheduled for 2001 is an Munich Re groupwide Natural Hazard Information System based on Esri´s ARC IMS technology.
Andreas C. Siebert
GIS-Manager
Munich Reinsurance Company
Geoscience Research Group
107 Koeniginstrasse, D-80791 Munich, Germany
Email: ASiebert@munichre.com
URL: http://www.MunichRe.com
Tel: +49-89-3891-5292
Fax: +49-89-3891-75292