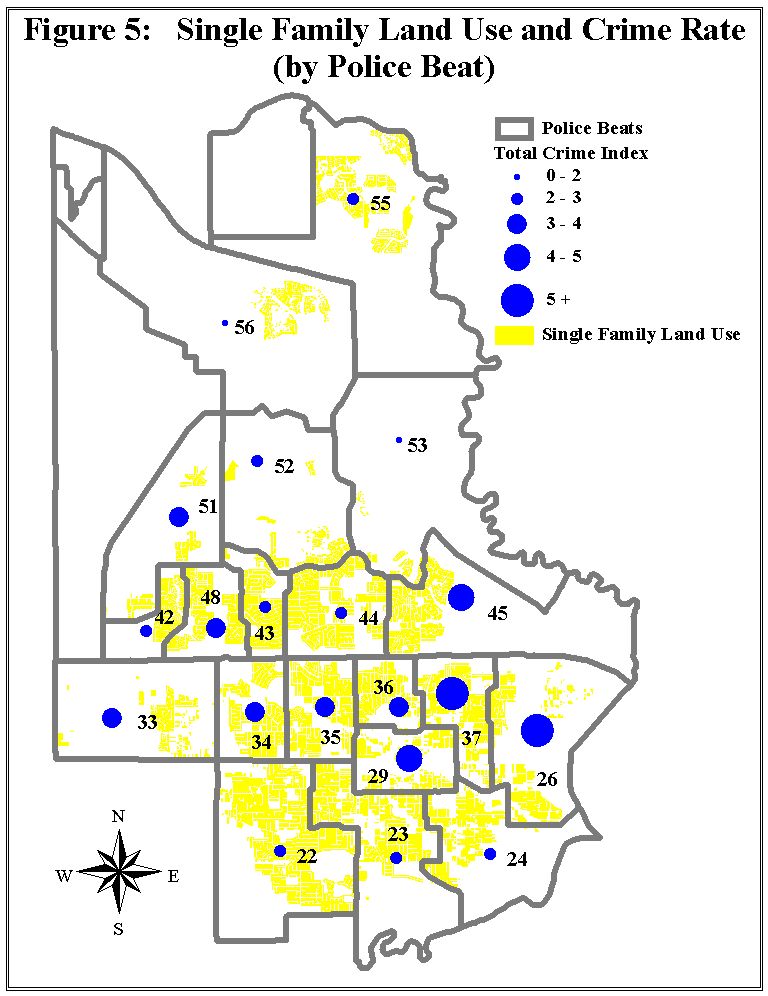
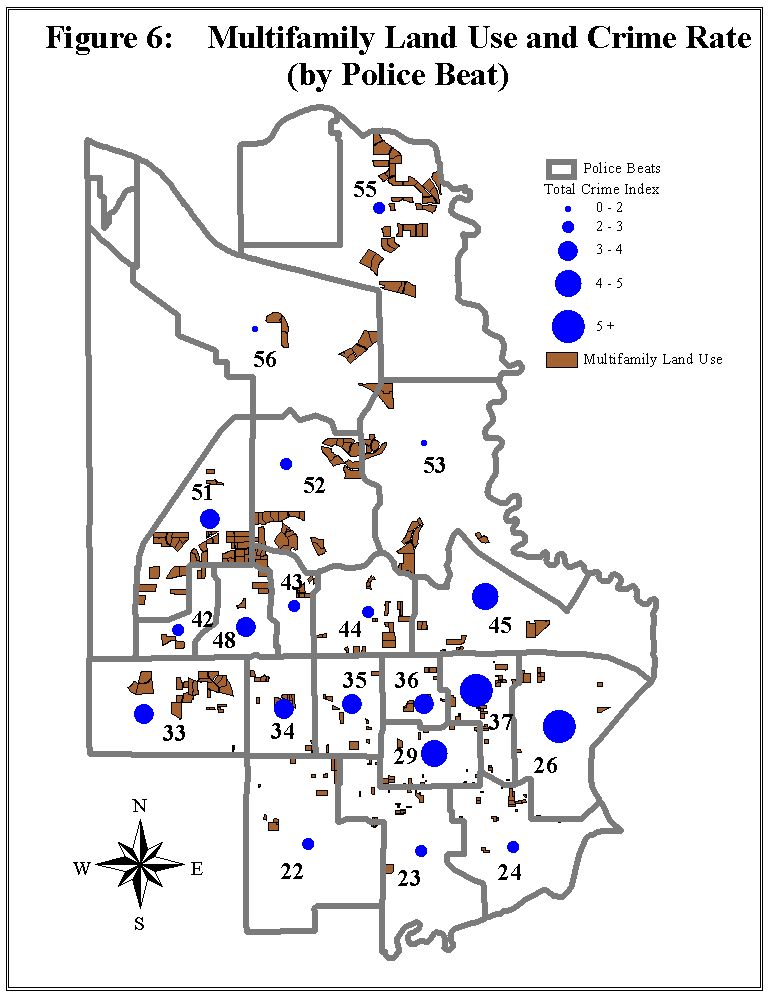
A widely held belief is that high-density land use is intimately associated with high crime rate. As a result, elected officials often resist undertaking projects of high-density development in their jurisdiction. However, results of GIS analysis show that high crime rate is not necessarily linked to high-density development, but more to the low socioeconomic status of the delinquents. This paper demonstrates the utility of GIS in the study of the relationship between land use patterns and crime rates and in the development of livable communities.
The cause of such a public perception about the relationship between land-use density and crime rate can be traced to the early days of modern cities. In many old cities, the industrial revolution attracted tens of thousands of immigrants. New immigrants were usually poor and were crowded into slums where housing density was high and living conditions were significantly below standards. Slums were also areas afflicted with diseases, vices, and crimes. Early treatment of the ill effects of overcrowding was fairly straightforward. For example, Weber (1899) argued that “the requirement of a definite amount of air space to each occupant of a room will prevent some of the worst evils of overcrowding; plenty of water, good paving, drainage, etc. will render the sanitary conditions good.” The New York Tenement Law of 1867 and New York Tenement House Law of 1879 were classical examples of major housing legislation that attempted to fix social ills by reducing overcrowding and improving housing conditions. Various housing acts beginning in the 1930s have provided financial subsidies for urban renewal and the construction of low-rent public housing or low-income housing. Hence, high-density public housing has become a symbol of potential social problems in many people’s mind.
What is the relationship between density and crime rate? Over the years, sociologists and criminologists have investigated factors related to crime rate. Several major theories such as social disorganization theory, relative deprivation and subcultural deviance theory, and general strain theory contend that community-level variables, such as density and overcrowding, are among the factors directly or indirectly contributing to crime through reducing social control and/or increasing strain (Wirth, 1938; Coleman, 1990; Agnew, 1992, 1999). These theories have been empirically tested. However, the effects of density on crime rate remain nebulous. While some studies found that population density, housing quality, and overcrowding are not the predictors of crime and other social pathologies of poor neighborhoods (Wilner, et al. 1962; Burns, 1970; Choldin, 1978), others suggested that high density has harmful side effects including possible social disorder and crime (Wirth, 1938; Brown and Liu, 1999).
A review of the literature reveals that most previous studies tested the density-crime relation using statistical methods such as correlation and regression (Sampson and Groves, 1989; Johnson et al. 1997; Veysey and Messner 1999). While statistical methods have many advantages, they have limitations as well. First, they do not have the capability of visualizing the relations between crime and density as well as other factors. Second, the results of statistical analysis may not be reliable when the sample size of a data set is small. Third, while statistical methods are widely applied in academic research, they are seldom used in the practice of urban planning and law enforcement.
GIS provides a fresh alternative approach to the conventional statistical methods. Over the last decade, GIS has emerged as a powerful instrument for solving many problems. Compared to the statistical methods, GIS has several advantages. A primary advantage of GIS is that it can visualize the spatial patterns of crimes, the relations between crime and its correlates, and the differentiation of crime type and its related attributes. A second advantage is that even with a small sample size, GIS can still show meaningful information. Third, visualized information can be very useful in the deployment of police forces and the allocation of resources. Finally, with improvement in its software and ease for mastery, GIS is rapidly becoming an essential tool for analysis at all levels of public- and private-sector management, administration, and planning.
The main purpose of this paper is to demonstrate the usefulness of GIS in understanding the relationship between land-use density and crime in comparison with the conventional statistic methods. We also examine other determinants of crime such as socioeconomic characteristics and the correlation between type of crime and land-use and socioeconomic factors. In the following sections, we describe the data and methodology of this study, compare the results of statistical analysis and GIS analysis, and finally discuss the implications of the findings.
We use data from the City of Irving in Texas. We select Irving as the point of analysis and demonstration mainly because of access to the required data. Irving is located in North-West Dallas County and is adjacent to Dallas and Fort Worth – the two largest cities in the Dallas/Fort Worth (DFW) metroplex. It is the home of Texas Cowboys. Part of the DFW airport, one of the largest airports in the nation, is located in Irving. The current estimated population totals 185,200 in January 2000 (NCTCOG, 2000).
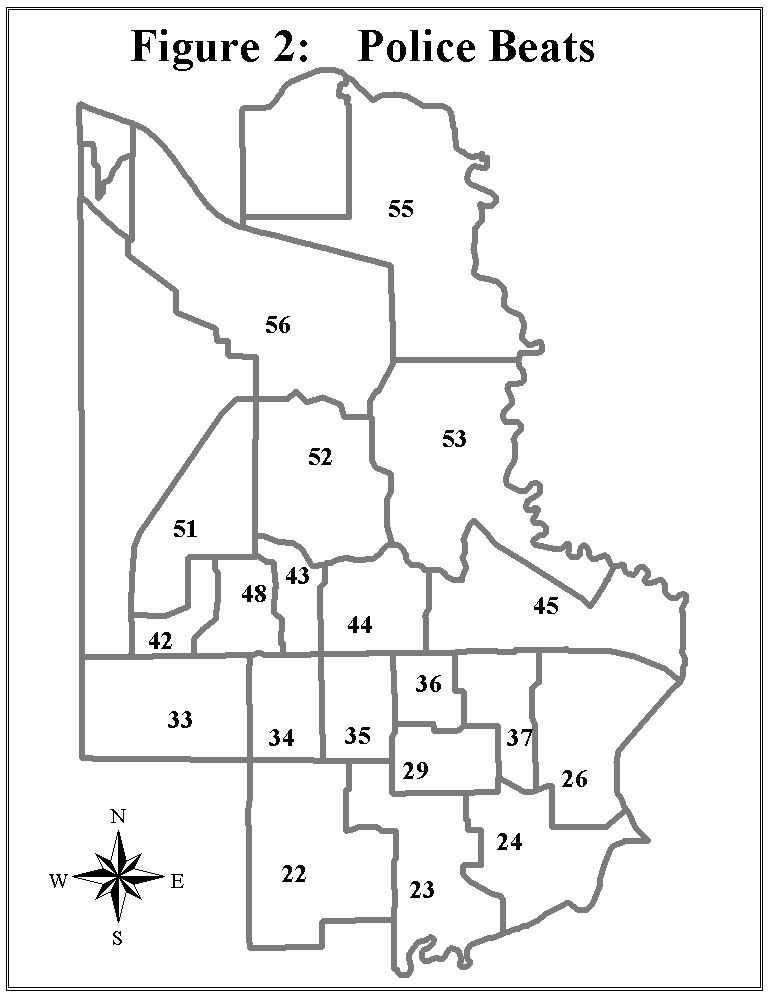
Data for this study mainly come from three sources: the Police Department of the City of Irving, the North Central Texas Council of Governments (NCTCOG), and the Planning Department of the City of Irving. We use the 1995 data because 1995 was the year in which beats – units of police patrol zones – were first established by the city Police Department. The beats are defined according to criteria related to population, calls for police assistance, and street divisions. The main purpose of establishing the beats is to effectively deploy police forces. There are 20 beats in Irving.
Because the three data sources do not provide information on poverty, unemployment, household size, and education, we also use these four variables from the 1990 census data as supplements. The use of the 1990 data should not affect our results significantly for two reasons. First, the population and housing growth rates between 1990 and 1995 in the city were fairly low.1 Second, the spatial distributions of population and housing between these two years were almost identical.
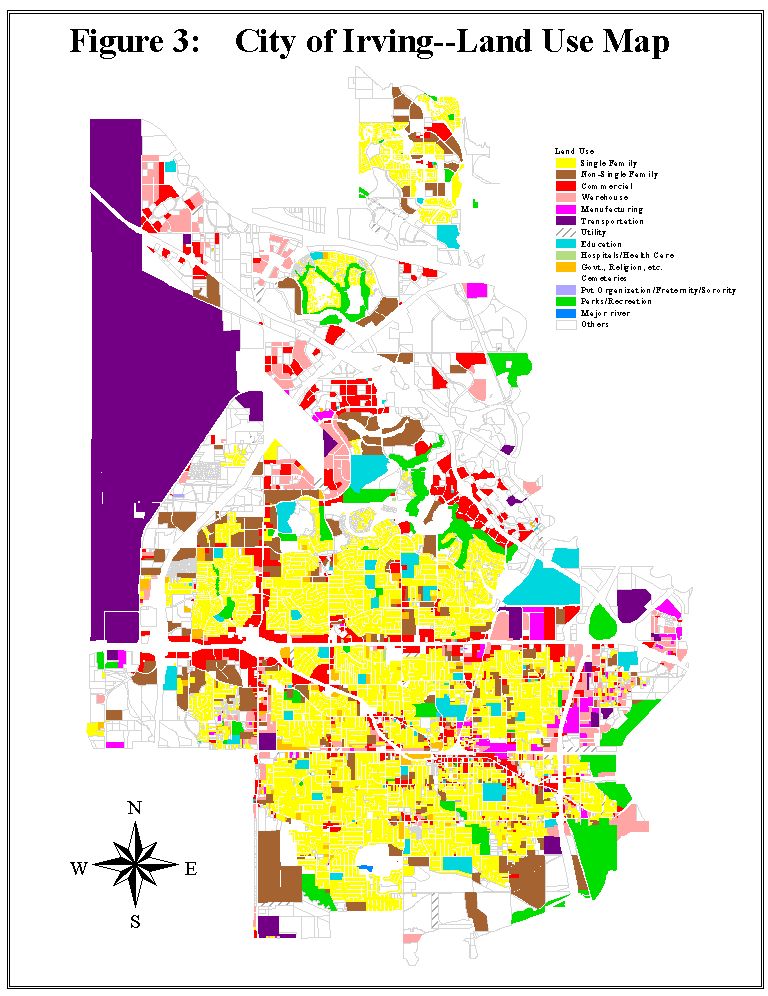
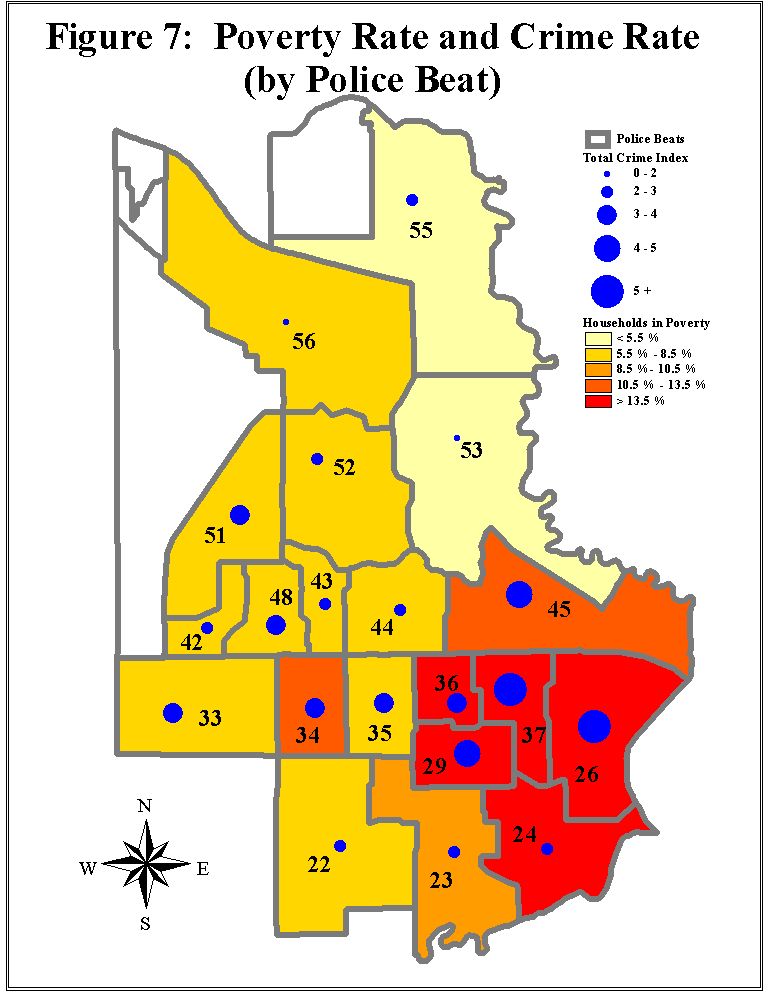
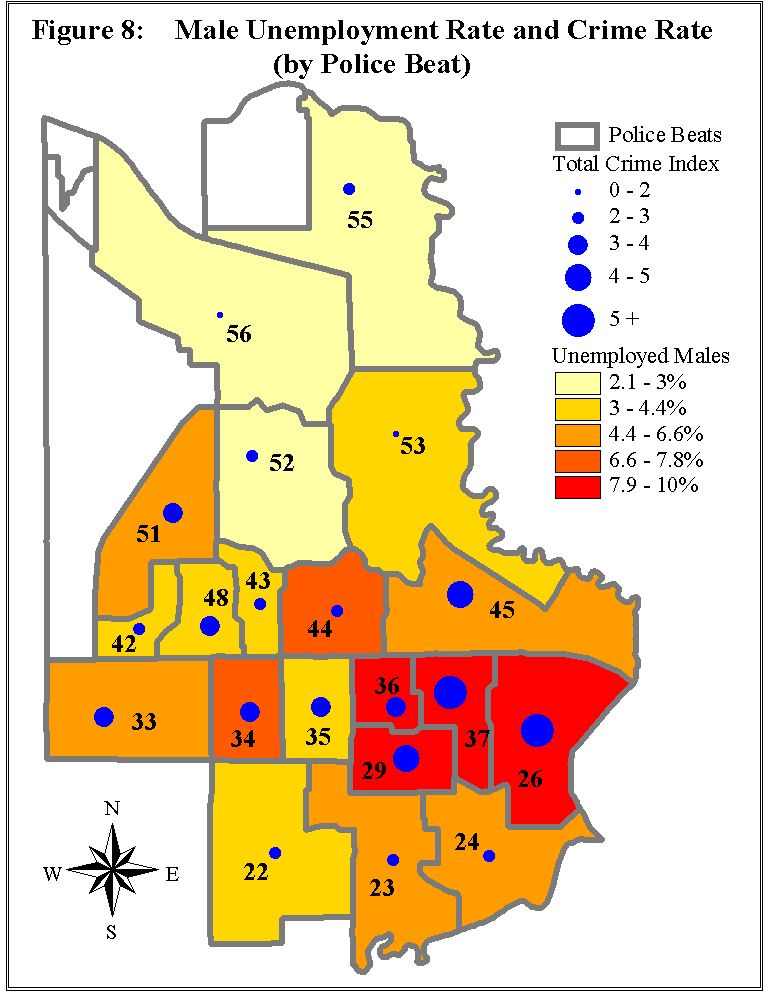
Our data include crime statistics, and land-use, socioeconomic, and demographic characteristics. Crime statistics consist of total number of crimes by beat and type of crimes such as rape, robbery, aggravated assault, burglary, and auto theft. Land-use characteristics encompass population density measured by number of people per acre, and type of land-use such as single-family land-use, multi-family land-use, commercial land-use, warehouse land-use, etc. Socioeconomic and demographic characteristics include percentage of households in poverty, percentage of large households,2 percentage of adult population (18 years and older) without a high school diploma, and unemployment rate for males.
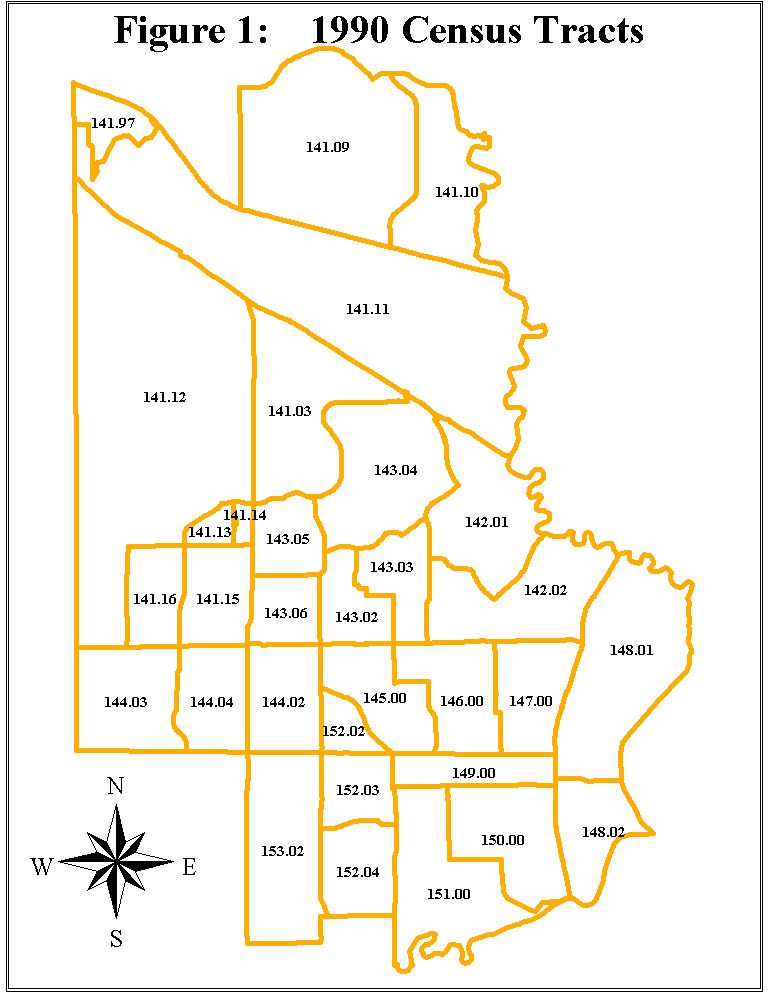
The data are measured at three levels: census tracts, police beats, and land-use (see Figures 1 ~ 3). In order to incorporate the spatial factor in the analysis, we first unified data from the three sources so that all data are in the same geographic unit. To do that, we conducted a poly-on-poly overlay and a spatial-join operation provided by ArcView.
To test these hypotheses, we first conducted a simple correlation analysis. We then tested three regression models using crime rate as the dependent variable. Model 1 tests the effects of land-use factors on crime rate. Model 2 examines the effects of socioeconomic factors. Model 3 tests the effects of both land-use and socioeconomic factors. Table 1 shows the results of statistical analysis.
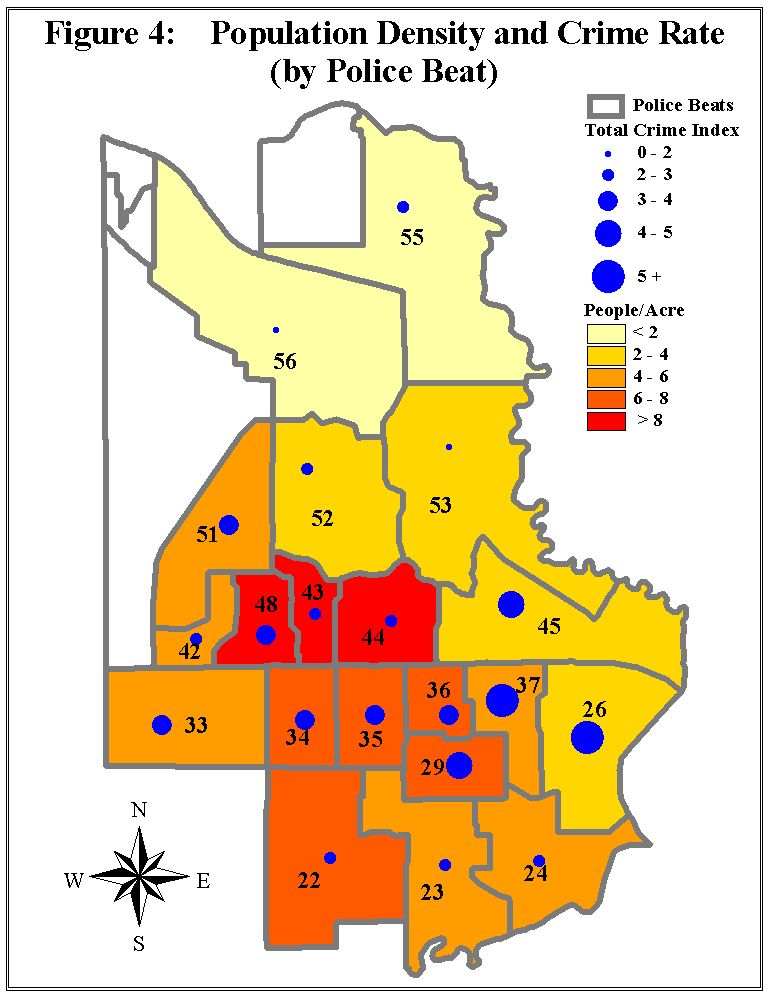
As seen in Table 1, crime rate is not associated with land-use density, socioeconomic status, and household size. The correlation between crime rate and the independent variables is weak. None of the regression coefficients in all three models are statistically significant at the 0.05 level. A very obvious reason is that the total number of cases is too small to obtain reliable results.
Based on these statistical results, one would be compelled to conclude that crime is not related to land-use density and socioeconomic and demographic factors or that it is impossible to know the effects of land-use density and socioeconomic and demographic variables on crime rate, given the small number of cases.
Provided the constraints, can the existing data shed some meaningful light on the relationship between crime rate and density as well as other variables? To answer this question, we use GIS as an alternative. We analyze the relations between density and crime, between socioeconomic characteristics and crime, and between land-use patterns and type of crime. The results are reported below in turn.
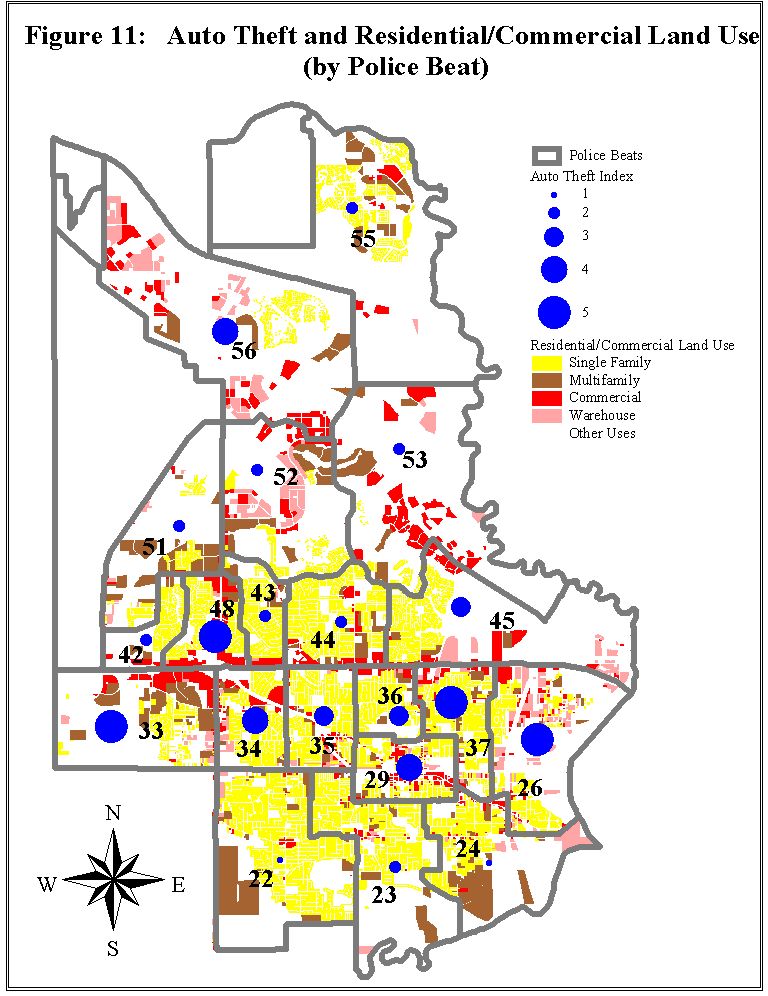
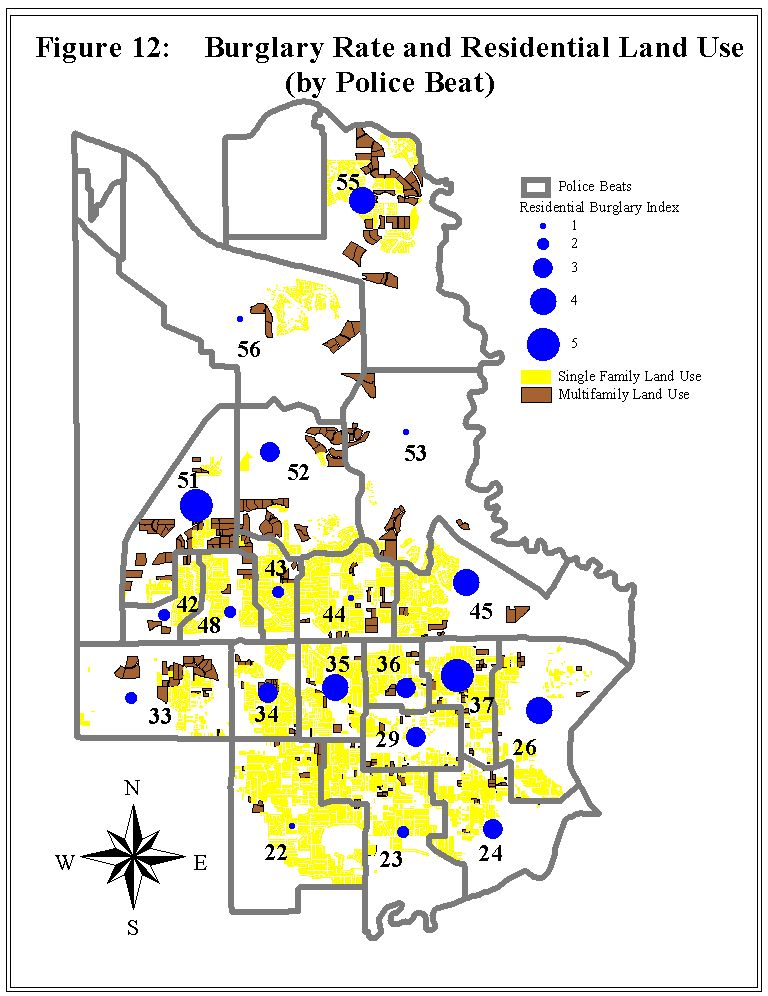
Similarly, residential burglary rates are higher in areas where property values are high. For instance, affluent people live in some of the neighborhoods in beats #35, #45, #51, and #55, and most of them are professionals and are less likely to be home during daytime (Department of Community Development, 1999). Thus, these areas are more likely to be targets for burglary (see Figure 12).
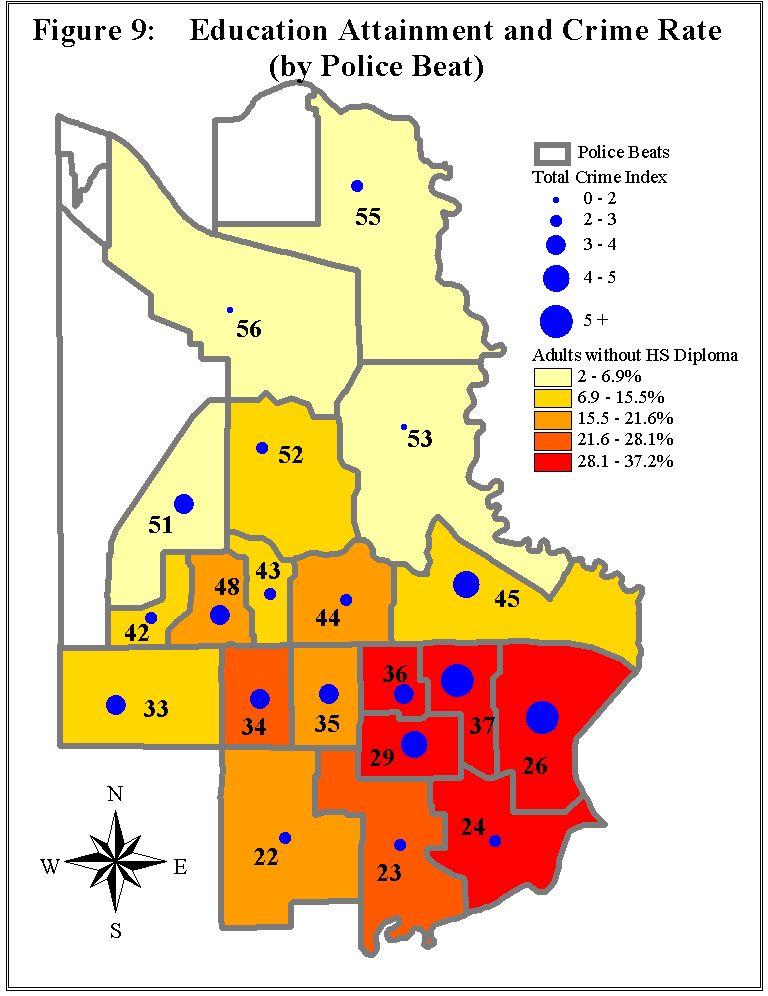
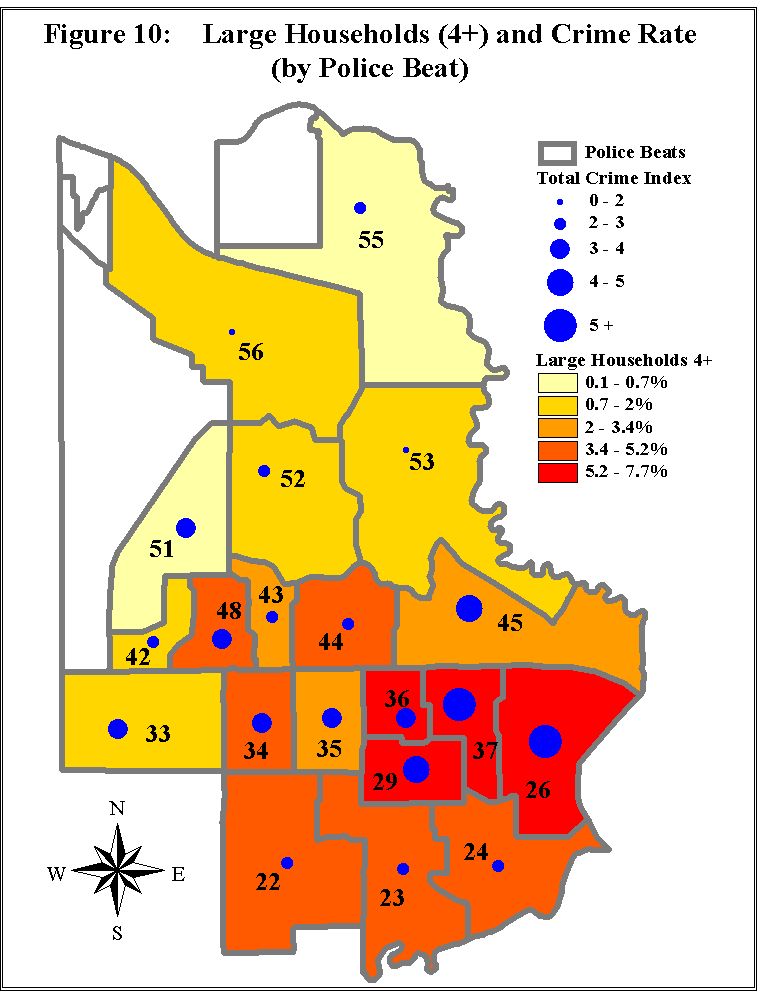
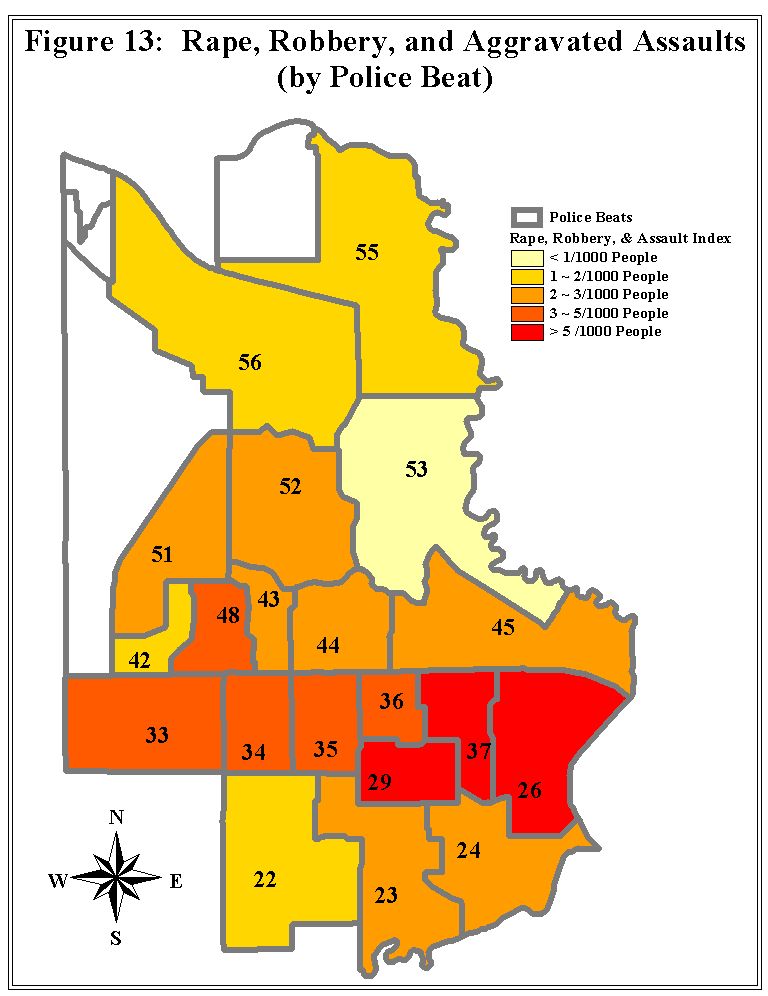
Contrary to automobile theft and burglary, rape and assault as well as robbery are concentrated in areas with lower socioeconomic status. As shown in Figures 13, the index of rape, aggravated assault, and robbery were the highest in beats #26, #29, and #37. Correspondingly, all measures of socioeconomic characteristics indicate that these areas also had the highest poverty and unemployment rates, the lowest level of education attainment, and the highest concentration of large households (see Figures 7 – 10).
The study demonstrates that GIS is a useful tool for criminological and land-use policy research, as well as land-use and law enforcement planning. GIS applications enable the unification of data collected from difference sources to the same level of geographic unit and the incorporation of spatial factors. The use of GIS in conjunction with other methodologies can enhance the quality of studies. More importantly, GIS can help visualize the spatial patterns of crime and related factors. Hence, planners can use GIS to inform the public of the true relationship between land-use density and crime rate and to help change the public’s perception toward high-density development. Police department can also use GIS in law enforcement planning. Many police departments have recorded crime statistics including not only the number and type of crimes, but also the time and specific geographic locations of crimes, and offenders’ information. Linking the information to spatial data will enable law enforcement agencies to visualize the spatial concentration and temporal distribution of crimes and to arrange police forces accordingly. The use of GIS will increase the efficiency of law enforcement planning and the effectiveness of crime prevention. The results of this study also imply that housing and land-use policies stressing low density should be reconsidered, and crime prevention should not neglect the importance of social policies aimed at improving education attainment and social and economic equity.
2. A large household is defined as one with 4 or more people.
3. The medium household income in the area was $40,385, as compared to $31,767 citywide in 1989 (1990 Census).
Agnew, R. 1999. “A General Strain Theory of Community Differences in Crime Rates.” Journal of Research in Crime and Delinquency, 36(2): 123-155.
Brown, D. and Hua Liu. 1999. “A New Approach to Spatial-Temporal Criminal Event Predition.” The Esri International User Conference Proceedings. Environmental Systems Research Institute, Inc., CA.
Burns, L. 1970. Housing: Symbol and Shelter. A report prepared for and submitted to the Agency for International Development, U.S. Department of State, Washington, D.C. Los Angeles: University of California, Graduate School of Business Administration.
Choldin, H. 1978. “Urban Density and Pathology.” Annual Review of Sociology, 4: 91-113.
Coleman, J. 1990. Foundations of Social Theory. Cambridge, MA: Harvard University Press.
Johnson, S. D., K. Bowers, and A. Hirschfield. 1997. “New Insights into the Spatial and Temporal Distribution of Repeat Victimization.” British Journal of Criminology, 37(2): 224-241.
North Central Texas Council of Governments (NCTCOG). 2000. 2000 Current Population Estimates. http://www.dfwinfo.com/ris/population/2000popestimates.pdf.
North Central Texas Council of Governments (NCTCOG). 1999. Development Monitoring in North Central Texas. http://www.dfwinfo.com/ris/demographics/
Sampson, R., and Byron Groves. 1989. “Community Structure and Crime: Testing Social Disorganization Theory.” American Journal of Sociology, 94:774-802.
The Department of Community Development. 1999. City of Irving: Consolidated Plan 1999-2004 (draft). Irving, Texas.
The Police Department in City of Irving, Texas. 1995. 1995 Annual Report of Crime Statistics. Irving, Texas.
Veysey, B. M. and S. F. Messner. 1999. “Further Testing of Social Disorganization Theory: An Elaboration of Sampson and Groves’s “Community Structure and Crime.” Journal of Research in Crime and Delinquency, 36(2): 156-174.
U.S. Bureau of Statistics. 1990 Census: STF3A.
Weber, A. 1899. The Growth of Cities in the Nineteenth Century. New York: Columbia University Press.
Wilner, D, R. Walkley, T. Pinkerton, and M. Tayback. 1962. Housing Environment and Family Life: A Longitudinal Study of the Effects of Housing on Morbidity and Mental Health. Baltimore, MD: John Hopkins University Press.
Wirth, L. 1938. “Urbanism as a Way of Life.” American Journal of Sociology, 44: 3-24.
Jianling Li, Ph.D.
Assistant Professor
School of Urban and Public Affairs
The University of Texas at Arlington
and
Jack Rainwater, Senior Planner
Department of Community Development
City of Irving, Texas