
Abstract
The release of the 2000 census population counts (P.L. 74-191) obliged Greensboro, NC (population 200,000) to redraw its council district boundaries to re-balance the population within each district. This paper addresses: a) The development of a MapObjects based application used by staff and legislators to analyze various districting scenarios; b) Our enhancements to the TIGER file, allowing us to integrate our own local GIS data sets; c) The role played by GIS in preparation of the DOJ pre-clearance submission; and, d) Some general observations of what went well and what we could have done better.
Let me begin by sharing some background about our city in the hopes that it will assist you in translating our experiences into the context of where you will be working. Greensboro is located in north central North Carolina. Our April 1, 2000 population was 223,891. We operate under the Council-Manager form of government. Since our elections are non-partisan, political party affiliation was not a factor in our redistricting.
Up until the mid-1980's, the seven member City Council was elected at-large. Then, in response to a large annexation, the City adopted a modified district system. Today the Mayor and three City Council members are elected at-large. An additional five members are elected from districts.
Greensboro falls under the jurisdiction of Section 5 of the Voting Rights Act. As such, any changes to the system of elections, including redistricting, must include pre-clearance approval by the Federal Department of Justice.
A variety of staff at the City are involved in redistricting. In 2001, staff from the GIS, Legal and Planning departments carried out the principal work. From the perspective of GIS, our primary involvement included collection and preparation of the necessary data (both geographic and demographic), creation of a computer application to guide the process and production of the final cartographic output. As events unfolded, we also developed the various redistricting alternatives and worked one-on-one with senior city staff to arrive at our final recommendations to City Council.
One factor that might make our 2001 redistricting efforts unusual was the project's very tight timeline. Our schedule was dictated by several outside factors: (a) the necessary demographic data would not be available until April 1, 2001; (b) that the Department of Justice would require 60 days to review our submission; and, (c) that filing dates for the November election open on July 23, 2001. As such, staff had roughly 45 days to finalize data, prepare plans and secure approval by City Council.
Divide the total number of districts into the total new population. This gives you the population count of the "ideal" district. Then calculate the percentage that your most populous district is above that ideal size. Next calculate the percentage that your least populous district is below the ideal size. Add these two percentages together (ignoring signs) and you have your plan's variance. For example, you have a city of 100,000 people with five districts. Your ideal district should consist of 20,000 people. Your largest district contains 22,000 people, a difference of 10% above the ideal. Your smallest district contains 18,000 people, a difference of 10% below the ideal. Your plan variance is 20%. You failed the test.
This 10% variance rule is not statutory, it is court derived and based on years of case law going back to the US Supreme Court decision of Reynolds v. Sims in 1964. Factors may cause plans with greater variances to withstand court challenge and plans with less than 10% variance to fail. However, in Greensboro, we drew all plans with a goal of not exceeding the 10% variance and favored plans with a smaller variance.
1. Compactness. Unlike population variance, there is no commonly accepted single measure of compactness that seemed to apply to Greensboro. The geography of the city is essentially that of a circle with the existing districts dividing the city into a five-spoke wheel. Most of the compactness measures have been developed for testing Congressional districts, which can be prone to meandering across vast stretches of a state. Given the geographic confines of a municipality, such measures tend to be overly complex.
In Greensboro, we elected to evaluate compactness using a technique that relies on measurement of district perimeters. One of our goals was to create districts that were more compact than those now present. To evaluate compactness, we compared proposed plans against the existing plan rather than against some unknown ideal. We began by measuring the perimeter of each existing district, excluding the outer defining line of the city limit. That combined length of existing interior district lines became our benchmark. Then, as plans were evaluated, we compared the corresponding length of the proposed plan's interior district lines to our benchmark. An over all shorter line length meant fewer twists and turns and implied greater compactness.
2. Contiguity. All of the geographic areas of a district should connect to one another. However, in some places, satellite annexations have created "islands" that, while part of the City, are not geographically connected to the core city. This was handled in one of two ways.
First, it could be that an "island" is part of a voter precinct that is itself connected to the rest of the city. In cases such as these, we required that the "island" follow the balance of its precinct into whatever district the overall precinct was assigned.
A second situation would arise where the "island" was part of a precinct and no areas of that precinct were connected to the City's core. In such cases, these islands were assigned to the closest, nearly adjacent, district.
3. Respect for Political Subdivisions. This criterion translates best to districting efforts that hope to preserve the integrity of smaller political units within a larger body. For example, preserving county or municipal boundaries when redistricting state legislative seats.
At a municipal level we applied this principle to voter precincts. In North Carolina, precincts are the smallest geographic unit of voter registration and administration. Typically they will contain 4,000-8,000 people. In developing district boundaries we felt obligated to follow precinct boundaries. In practice this goal supported several other goals: a) the census population counts would be released by precinct; b) voter registration statistics are organized by precinct; and, c) administration of an election organized around something other than precincts would be difficult to administer and very confusing for voters.
4. Respect for Communities of Interest. Here the goal is to group people with like interests together so that an elected representative can articulate their views.
In Greensboro, we looked to neighborhoods as the best indicator of like interests. Over time, the City has defined 124 neighborhoods. To the extent possible, we avoided splitting neighborhoods between districts.
5. Maintaining District Cores. To the extent possible, districts should be drawn in such a way as to preserve the core of existing districts.
Development of redistricting scenarios frequently began by modifying the existing plan in such a way to minimize the number of voter precincts that were shifted from one district to another.
6. Maintaining Constituent Relationships. To the extent possible, districts should be drawn in such a way as to avoid situations where incumbents would be in contests with each other.
Early in the process we identified the precincts where incumbents resided and avoided moving these precincts into a different district.
In the 1986 case of Thornburg v. Gingles, the high court identified pre-conditions that plaintiffs must meet to demonstrate a violation of the Act as well as additional factors that might invalidate a minority group's ability to elect representatives. The thrust of Section 2 is to prevent district plans where either too few (fracturing) or too many (packing) members of a minority group are placed into a given district.
The other provision of the Act is Section 5 which requires that pre-clearance be secured from the Department of Justice, or the courts, before putting electoral changes into place. These provisions only cover selected areas of the Country and include much of the Southeast. Essentially, redistricting plans will not be pre-cleared if the proposed plan exhibits, "retrogression" -- leaving members of a minority group worse off than they were under the current plan.
Throughout the early 1990's the pre-clearance requirement of Section 5, coupled with the provisions of Section 2, led the Justice Department and many jurisdictions to the conclusion that they must develop plans that created the maximum number of "majority-minority" districts mathematically possible, this to the exclusion of "traditional districting principles." The failure to draw such maximized minority district plans would result in a withholding of the needed pre-clearance. However, the 1990's saw the Court strike down numerous plans that were focused too heavily on race at the expense of compactness and other traditional principles (i.e., Shaw v. Hunt 1996, Johnson v. Miller 1995 and others). The view that minority-majority districts must be maximized at all costs is no longer valid in 2001.
Finally, redistricting plans must not run afoul of the Equal Protection Clause of the 14th Amendment. The Clause does not require you to ignore race. Rather, as pointed out in Shaw v. Reno 1993, race is one of many demographic factors legislatures are aware of and can consider in drawing plans. However, if a plan is drawn so that race is the primary factor, to the exclusion of "traditional districting principles," the plan is subject to strict scrutiny. To this end, beware of bizarre shapes, draw districts that are reasonably compact, avoid making race your dominant motive and follow traditional districting principles. While not a factor in Greensboro's non-partisan system of elections, minority political groups will also seek remedies to gerrymandering via the Equal Protection Clause.
In Greensboro, two of the five districts have always been populated by a majority of African-Americans. No other racial groups comprise more than 3% of the population. Our Hispanic population represents only 4% of citizens. In developing our current redistricting plan we insured that there would be no retrogression by maintaining two majority-minority districts and, while aware of race, we did not subordinate traditional districting principles to it.
For those of you unfamiliar with the TIGER file, it is the underlying map used by the US Census Bureau. While it has many components, of interest to us were the block level polygons. These block level polygons can, when combined together, be used to build the hierarchy of larger precinct polygons.
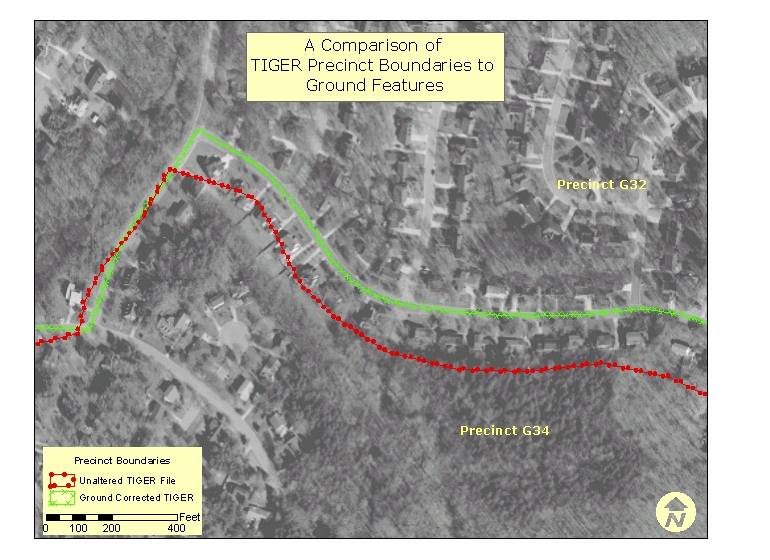
We secured our version of the TIGER file through the Esri sponsored Geography Network. It came to us in Esri shapefile format. Once we had re-projected it to North Carolina State Plane, NAD 1983, we ran into three problems.
To correct this problem, we elected to improve the positional accuracy of the underlying census block file. We chose this path, as opposed to fixing just the precinct boundary lines, because it offered the prospects of fixing precinct, census block group and tract boundaries all in one operation.
Generally, you will find that roads, streams, railroads and political boundaries define census blocks. By using our locally derived corresponding features it was possible to create a spatially improved block file. Essentially we followed these steps:
(1) We converted the TIGER block shapefile into an ArcInfo coverage containing region topology. Then, from the region feature class, we created a polygon feature class. The resulting polygon label point features contained the block's attributes for tract number, block number, block group number and precinct number.
(2) We took the line features from our street centerline, stream, railroad and city limit line coverages and merged them all together to create a single line coverage.
(3) Using the TIGER block coverage and our merged line feature coverage as references (backcovers), we moved the label points created in step number one so that they were coincident with the areas of the underlying merged line file created in step number two.
(4) The relocated label points were then "pasted" into the merged line coverage. When we built polygon topology for this combined line and point coverage the resulting block polygons adopted the attributes of the label points.
(5) A final dissolve of the blocks on precinct number yielded the needed precinct polygon coverage. Once exported into an Esri shapefile format, this precinct shapefile became the base map for our redistricting efforts.
In retrospect this process seemed like it would be easy. In practice, it took almost three weeks. Additionally, we ran into some unexpected problems.
First, in areas of the city where blocks cover fairly small areas, it was sometimes difficult to determine exactly where to drag the label point. We were aided in resolving these problems by downloading check plots from the Census Bureau's web site. These arrived in Adobe .pdf format. Once these "E" size maps were plotted out, they proved very valuable in both resolving problems and quality control checking.
Second, we found that there were hundreds of block "fragments" all along the city limit line. The Census Bureau considered these to be valid blocks, each was numbered on the Census Bureau check plots. However, many of these fragments might be only 100-200 square feet in size. We used aerial photography dated February 2000 to determine if these slivers were in fact legitimate blocks -- or just chaff. Slivers, which did not correspond to any visible features, were eliminated.
Third, some block boundaries could not be logically reconstructed. This appeared most commonly when a block boundary followed a political boundary, such as a tax district, that was not correctly located relative to ground features such as roads and the like. In cases such as these we did the best we could.
Lastly, since the time of the April 1, 2000 enumeration, the City had annexed some small areas. These were typically tracts of undeveloped land slated for new development. Since they did not represent entire census blocks, we knew it would not be possible to collect demographic characteristics for these areas. However, by using household counts done independently of our project as part of the annexation itself, we found that less than 200 people had been added to the city. We knew nothing about the demographics of these 200 new residents. We elected to reflect these newly annexed areas in our mapping, but did not attempt to incorporate the corresponding population counts.
As we had originally planned the project's tasks, following the collection of our population and base map data, our next step would have been to determine if the new population counts might still work within our current district boundaries. After all, it was possible that our population had grown evenly throughout the city and that redistricting might not be required. However, since the 2000 population counts were coming in based on precinct boundaries that no longer corresponded to our district boundaries it would be impossible to make a direct comparison. The associated map illustrates where new precinct boundaries differed from the existing districts.
Even examining the data at a block level would not resolve all of the questions. At a minimum, some redistricting would be required just to reconcile district boundaries to the new precinct boundaries. As an alternative, we examined each of the precincts that were impacted by the new boundaries. If an existing district contained 50% or more of the new precinct's area, we assigned that entire precinct to the district for comparison purposes. While not the ideal solution, it provided us with a basis to judge if the city had outgrown the current plan.
All of our population data came from the March 21, 2001 release of the PL 94-171 file for Guilford County. Additionally, we also collected and tracked voter registration data.
The first file is a comma delimited, ASCII text file. It contains two tables. Table 1 contains total population counts by race. Table 2 contains counts of population age 18 and over by race.
The second file is also a comma delimited, ASCII text file. It too contains two tables. Table 3 contains counts of the total non-Hispanic population by race. Table 4 contains counts of the total non-Hispanic population age 18 and over by race. Typically these two tables are referred to as containing Hispanic population counts. That's not exactly true since you must subtract these counts from their corresponding counts in Tables 1 and 2 if you want the actual Hispanic population totals.
Both of these files have one record for each geographic level of analysis tracked by the Bureau. For example, in Guilford County there are several thousand records with population counts at a block level, about a hundred records report the same information summarized at a tract level and one record summarized at the County level. In addition to the population counts, each record also contains a unique logical record number.
The third file is the geographic header file. This is a fixed length ASCII text file. The file contains information about each geographic entity tracked by the Bureau. For example, in Guilford County there are several thousand records at a block level, about a hundred records at a tract level and one record at the County level. This geographic hierarchy is defined in each record's summary level (SUMLEV) field. Each record also contains a unique logical record number.
By joining the three files together, based on their logical record number, one "long" logical record was created. This newly created record contained all of the population data plus the associated geographic header record containing precinct number and summary level field. Note that precinct (referred to as voter district by the Bureau) is denoted as summary level "740."
In the case of all three files, we used MS-Access to import the ASCII text into the appropriate table structure, to perform the joins and to execute the query that extracted all of the precinct summary level records. We found that it took a couple of tries to successfully reproduce the record layouts and import the ASCII text. You can make your task easier by utilizing MS-Access' ability to save, modify and re-use text import specifications.
Our final steps in processing the population data began by using ArcView to link the newly joined, precinct level, population table to the corresponding precinct polygons of our redistricting base map. Once we saved this linked table as a new shapefile we had the redistricting base map with population attributes that our application required.
In Greensboro only a small number of people, 5.4% designated themselves as being of more than one race. For that reason, we tracked the following racial categories:
In the 2000 enumeration, just over 4% of the population identified themselves as being of Hispanic ethnicity. Of this population, 42% identified themselves as White. While collected and tracked, the small Hispanic population was not sufficiently large to influence the development of district boundaries.
In Greensboro, we found that voter registration figures by race tracked fairly closely with the overall population. As a result, few people paid much attention to this information. Also, as mentioned above, the non-partisan nature of our elections eliminated the need to track voter political party affiliation data.
The goal of our application was to provide a "what-if" tool. With such an application users could:
Contrary to conventional wisdom, we actually began development of the application before either the population counts or precinct base map were available. In retrospect, it would have been easier to secure the PL 94-171 data and TIGER file, and then build the application in light of these datasets. However, given a very tight schedule, application development was the one task of the project whose schedule we could control. We trusted that once received, the PL 94-171 and TIGER file data could be reformatted into the structure needed by the application.
With the base map, population data and application in place the project staff turned their attention to the question of whether or not the 2000 census would necessitate redistricting.
With a population variance of 22.6%, staff moved forward to develop alternative strategies for new district alignments.
The main form of the application is divided into four areas. In the screen shown below, the application has been launched to create a new plan so the user is presented with the precinct base map the city limit line and nothing else. The legend shows five color-coded buttons, one for each district to be modeled.
Below the district buttons are a collection of check boxes that allow the user to control which layers are displayed. In many cases, we found that the complexity of features required that the application limit their display to different zoom levels. For example, even if selected for display by the user, streets would not appear on the map until the user was zoomed closely into the city.
Layers that can be activated include:
The application toolbar contains all of the functions necessary for running the application.
Functions include (reading from left to right):
Five tabs organize Demographic and voter registration data. The tabs include (a) total population; (b) total population 18 years of age or older; (c) total Hispanic population; (d) Hispanic population 18 years of age or older; and, (e) Voter registration.
For each tab, the user is presented with the population count (that is currently assigned) by district along with a simplified racial breakdown of percent white and percent non-white. Overall plan population variance (the 10% rule) is displayed along with the amount that each district is contributing to the variance.
Roughly a week after adoption, we discovered an error in the plan approved. This necessitated a second public hearing on a corrected plan and subsequent approval on May 15, 2001.
Final pre-clearance is expected by July 15, 2001.
Things We (or You Might) Want To Do Differently
The US Census Bureau's web site is the source of both the PL 94-171 and TIGER files. However, you will need a translator to convert the TIGER file into an Esri format.
The Geography Network provides the TIGER files in Esri shapefile format.
http://www.geographynetwork.com/data/tiger2000
The National Conference of State Legislatures is an excellent source of information, especially regarding the legal environment.
http://www.ncsl.org/programs/legman/redistrict/redistlaw.htm
Stephen Sherman
GIS Manager
City of Greensboro
300 W. Washington Street
Greensboro, NC 27402
336 373 4503 (voice)
336 335 6496 (fax)
stephen.Sherman@ci.greensboro.nc.us