The hypothesis that travel is derived from individual and household requirements for daily participation in activities is widely accepted within the travel behaviour research community. Contemporary travel surveys often record the timing and location of respondent activities over a specific time period. These data can be used to study revealed activity patterns of a sampled population.
In this paper ArcView's kernel and weighted kernel functions are used to explore spatiotemporal patterns of out-of-home activities in Portland, Oregon. The analysis reveals the potential location of clusters of longer duration activities. The results also suggest that the intensity of space-use is not necessarily constant across multiple days.
Keywords: activity patterns, kernel estimation, Portland, transportation geography
The activity-based approach to the study of urban travel behaviour is founded on the principle that the demand for travel is based upon the need to participate in activities outside of the home (Jones et al. 1990; Ettema et al. 1993; Bhat and Koppelman, 2000). This realization has lead to what is generally considered a paradigm shift in the study of urban travel behaviour (Pas, 1996). The activity paradigm is characterized by the recognition of travel as a derived demand, a focus on constrained patterns or sequences of behaviour instead of discrete trips and the interdependence of decisions usually made within a household context (Jones et al. 1990; Recker et al. 1986a). This study acknowledges this paradigm shift, subsequently adjusting the focus from travel per se to the participation of individuals in activities within an urban environment.
This paper examines the participation of individuals in activities outside of the home. These activities are employment related or discretionary in nature (e.g. shopping, meals etc.). The focus on out-of-home activities is based on the hypothesis that these activities are likely related to travel and externality effects such as congestion and mobile source emissions. This is not to say that a link does not exist between in-home and out-of-home activities. The academic literature identifies a linkage between in-home and out-of-home activities (Kuppam, 2000; Bhat and Koppelman, 2000). This linkage has been referred to as activity substitution. Substitution will not be addressed here. In the rest of the paper the participation in an activity outside of the home will be referred to as an activity event. These events effectively reveal the outcome of individual and household decisions that result in the consumption of time and space.
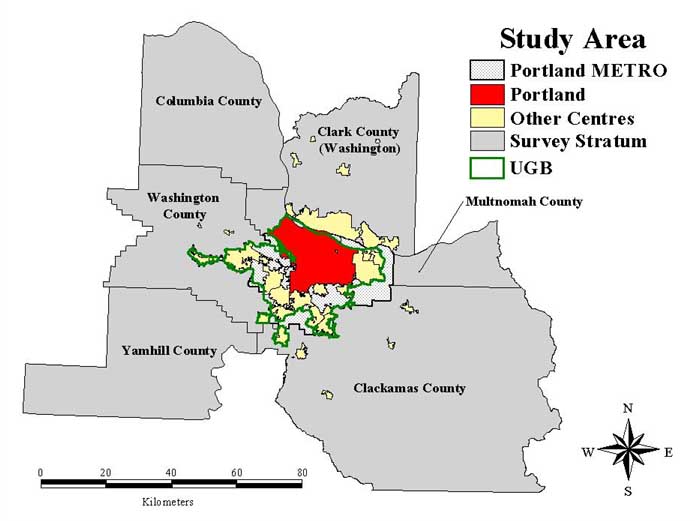
This study makes use of Portland Oregon's 1994/1995 Household Activity and Travel Behavior Survey. Additional spatial data have been acquired from Portland Metro's Regional Land Information System (RLIS). The activity events used in this study are those that occurred within the city limits of Portland. Portland has a population of approximately 500,000 and is situated in the centre of a larger region managed by Portland Metro (Figure 1). Metro is a regional government entity serving approximately 1.3 million people. Portland Metro is often cited as being progressive in the context of sustainable urban planning. They have adopted an integrated planning approach that makes use of state-of-the-art technologies to support planning and modeling. Growth limits have been imposed in the form of an urban growth boundary established in 1979 (Figure 1). In addition, the region has become the focus of a considerable amount of academic research (e.g. Golob and McNally, 1997; U.S. DOT, 1998; Kwan, 2000; Golob, 2000). This can likely be partially attributed to Portland Metro's innovations in data collection.
This paper presents the results of an exercise designed to explore the spatial and temporal characteristics of the participation of individuals in employment and non-work activities outside of the home. Specifically, the space and time use of activity events within Portland is studied using ArcView's kernel and weighted kernel estimation techniques. Kernel estimation is used to describe revealed patterns of activity events and to explore variability in event distributions for two consecutive days. The remainder of the paper is organized as follows. A review of activity-based research is conducted followed by an examination of the data used in the study. A methodological discussion is then introduced which focuses on kernel estimation. Study results are then presented and discussed followed by concluding remarks and suggestions for future research.
The relevance of the activity-based approach has been questioned in the past (Kitamura, 1988). Recent developments suggest that the adoption of the principles of activity-based research in practice could be close at hand. The continued development and marketing of activity-based modeling systems such as TRANSIMS (Transportation Analysis and Simulation System) could continue this push toward the mainstream. TRANSIMS has the support of the U.S. Department of Transportation Federal Highway Administration and the Environmental Protection Agency. Development costs have recently been estimated at $25 million USD. U.S. State and local agencies will likely be able to acquire the TRANSIMS technology sometime in 2002. The merits of the activity-based approach seem to have been recognized.
Early reviews of the state of activity-based research commented on the lack of data required to implement activity-based models (Pas, 1985; Kitamura, 1988; Jones et al. 1990). Kitamura (1988) also questioned the lack of progress in terms of integrating the activity-approach into practical planning environments. The absence of data was perceived as an impediment to progress in activity/travel behaviour research. The activity paradigm is considered the driving force behind emerging data collection methodologies as they relate to the study of urban systems (Jones et al. 1990; Bhat and Koppelman, 2000). The 1990's became an era marked by the collection of new types of travel diary data that could support trip-based or activity-based modeling efforts. Developments in both theoretical and operational modeling contexts occurred during the 1990's as well. Some researchers looked to develop a consistent theoretical framework for representing the processes that produce activity/travel patterns (Recker et al. 1986a,b, Garling et al. 1998). Others looked to develop activity-based forecasting models (Ben-Akiva and Bowman, 1998; U.S. DOT 1998). Still others employed statistical modeling tools to explore complex relationships between various dimensions of the activity paradigm (Damm, 1982; Pas, 1996). Both Kitamura (1996) and Pas (1996) review a number of these studies.
Pas (1996) has suggested that recent progress in activity-based research, particularly in the development of forecasting models, can partially be attributed to increased data availability. Other forces driving recent progress include the evolution of a favorable policy environment (particularly in the United States) and recent advances in analytical tools (Pas, 1996). The deficiencies of traditional modeling approaches, particularly in the evaluation of policy response, have been well documented in the literature (Stopher, 1993; Stopher et al. 1996; Supernak, 1983; Kitamura, 1996). Advances in the state of analytical tools are pushing modeling efforts to greater levels of disaggregation. Researchers now have tools at their disposal to both model and manage data required to represent urban systems in fine detail. In particular, the role of GIS as a data management and spatial analytical tool has been addressed in the literature (Garling et al. 1994; Golledge et al. 1994; Miller and Salvini, 1997; Miller and Salvini, 2000).
Portland Metro has implemented a set of transport modeling improvement initiatives which included disaggregate data collection to support innovations in travel demand modeling. One result of this initiative was the region's 1994/1995 Household Activity and Travel Behavior Survey. The bulk of the survey was completed in the spring and autumn of 1994 with additional sampling in the fall and winter of 1994/95. A two-day activity diary survey instrument was used to collect data on households, individuals, vehicles and activity and travel data for each household member (Cambridge Systematics, 1996).
Data were collected for every household member over two consecutive days. Travel day assignment to households was varied so that data for an entire week could be captured by the survey. The sampling frame was geographically stratified with oversampling in certain areas to capture non-motorized travel. Of 20,161 households contacted, 7,090 were recruited with 4,451 of these households completing the surveys. Estimates of travel/activity participation indicate 9,471 person reporting 122,348 activities and 67, 891 trips (Cambridge Systematics, 1996). In addition to the data recorded in the travel diary survey, spatial data stored in Metro's Regional Land Information System (RLIS) have been used in this study. Geographic data layers stored in the RLIS database include the region's traffic analysis zones, geocoded activity locations (including home and work), detailed single line street network files, political boundaries and other contextual layers.
Respondents assigned Mondays and Tuesdays have been extracted from Phase 1 (spring) of the survey. Geocodes of employment and non-work activity events within Portland were extracted from the database. The horizontal accuracy of these activity geocodes is reported to be approximately 61 metres (Cambridge Systematics, 1996). Activity events have been grouped into employment and non-work categories. Employment events either occurred at a place of work or at locations related to employment. Non-work events include shopping, meals, school and a number of other activity categories (Cambridge Systematics, 1996). Monday events total 2,194 with 670 (31%) employment and 1,524 (69%) non-work events. Tuesday events total 2,145 with 695 (32%) being employment events and 1,469 (68%) being non-work. Activity duration was determined using start and end times reported by respondents. The literature on spatial cognition suggests that caution should be exercised when interpreting results based on respondent reporting of time or distance values (Golledge and Stimson, 1997). Available data will suffice in the absence of measured values. Mean duration for employment events exceeded the mean duration for non-work events. This was the case across both survey days used in this study (Table 1). While not reported in the table these differences were statistically significant. On average, respondents spent more time at employment event locations than at non-work locations. This, on an intuitive level, is not at all surprising.
| Day of Week | Employment | Non-Work |
| Monday | 4.34 (n = 670) | 1.30 (n = 1,524) |
| Tuesday | 4.41 (n = 685) | 1.37 (n = 1,469) |
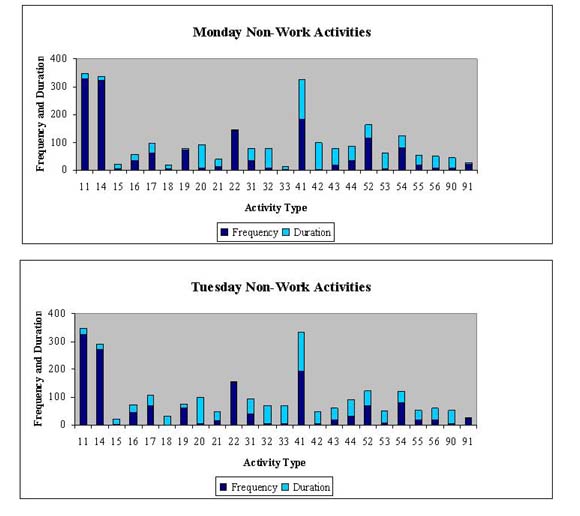
A closer look at non-work events reveals considerable variation in frequency and duration between event classes. The summary plot in Figure 2 contains the frequency of activity events for the non-work activity classes used in the Portland survey. The top portion of each bar has been scaled to the mean duration for each activity class. Statistical tests have not been conducted to determine the significance of differences in mean duration between classes of non-work activities. Each activity class was assigned a unique value in the survey. The mapping of numbers to survey classifications is not terribly important here. Limiting our evaluation to the dominant classes of activities reveals that meals (11), general shopping (14), school (41) and pick-up/drop-off passengers (22) are the types of non-work events occurring more frequently than others.
This brief descriptive analysis has shown that, on average, employment events are longer than non-work events. Non-work events are in general occurring more frequently. Within the non-work classification certain event classes dominate. Some of the more frequently occurring non-work activities are characterized by shorter duration than other less frequently occurring events. The dominance of non-work activities does not directly translate into higher levels of non-work travel. Certain non-work events might not involve travel. This question has not been pursued in this paper. It is possible to assess the degree to which non-work activity events translate into non-work urban travel using other variables in the Portland survey.
Kernel estimation is used in this study to explore the general
spatial and temporal characteristics of activity events within
Portland. Kernel estimation transforms a set of point events into
a continuous surface providing a global measure of the intensity
of a spatial point pattern (Bailey and Gatrell, 1995). This
surface represents the evolution of a spatial stochastic process
within the range of a particular study area. Surface values
reflect the intensity of this spatial process at any particular
location. Intensity, in this context, can be thought of as a
summary estimate of the number of events per unit area over
space. The general functional form of this intensity, ![]() , is given by:
, is given by:
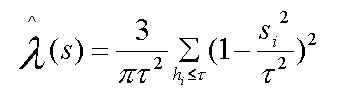
where, ![]() , is the
distance of an event, i,
from an estimation point, s,
and
, is the
distance of an event, i,
from an estimation point, s,
and ![]() is the kernel
bandwidth. The value for the bandwidth affects the degree of
smoothness in the resulting surface. A larger bandwidth will
produce a smoother surface. Methods have been devised in an
attempt to estimate appropriate bandwidth values (Gatrell et al.
1996; Bailey and Gatrell, 1995). It is common practice for an
analyst to derive a value for the bandwidth through
experimentation. Kernel estimation can be implemented in ArcView
as one of the Spatial Analyst Extension's analysis functions or
in ArcInfo using GRID's pointdensity function.
is the kernel
bandwidth. The value for the bandwidth affects the degree of
smoothness in the resulting surface. A larger bandwidth will
produce a smoother surface. Methods have been devised in an
attempt to estimate appropriate bandwidth values (Gatrell et al.
1996; Bailey and Gatrell, 1995). It is common practice for an
analyst to derive a value for the bandwidth through
experimentation. Kernel estimation can be implemented in ArcView
as one of the Spatial Analyst Extension's analysis functions or
in ArcInfo using GRID's pointdensity function.
The estimate of intensity provided by kernel estimation can be subject to distortion at the edges of a study area. One reason for this is that the mechanics of kernel estimation do not allow events at the edge to interact with events outside of a bounded region. In certain cases this may produce lower estimates of intensity at the edges of a kernel surface. The Esri implementations of the kernel density function do not, by default, allow for edge correction. An edge correction factor has been introduced in Bailey and Gatrell (1995) as a potential solution. In the context of this study edge effects do not appear to have had a profound effect. The results indicate that the intensity of the activity event distributions steadily decreases towards limits of the study area.
The kernel can be weighted by the value of a continuous variable that describes some aspect of a recorded event. In this study event duration has been used as a kernel weight. A more detailed discussion of the use of kernel estimation for exploring spatially continuous data can be found in Bailey and Gatrell (1995). Kernel estimation of this sort highlights subregions of the study area where time and space are being consumed at higher levels. That is, the duration-weighted kernel draws the kernel estimate toward clusters of longer duration events.
Kernel estimation has also been used in this study to explore potential differences in the use of space across consecutive days. The Spatial Analyst Extension's Map Calculator was used to create a surface that reflects differences in the intensity of activity events between Monday and Tuesday of Phase 1 of the survey period. A number of studies have approached the examination of activity travel patterns from the perspective of repetition of a particular schedule or set of activities from one day to the next (Misra and Bhat, 2000; Hanson and Huff, 1982; Cullen and Godson, 1975). Consistent behaviour at the individual level under an assumption of habitual repetitive action should lend itself to relatively similar levels of event intensity at the aggregate level across days.
This section of the paper begins with a general qualitative assessment of scatterplots of geocoded employment and non-work events. The remainder of the section is centred on estimates of event intensity. Initially, the intensity of employment events is discussed. This is followed by an assessment of the spatial pattern of the non-work event distributions on Monday and Tuesday. The results of applying a duration-weighted kernel are also reviewed. Toward the end of the section the focus turns toward differences in space use within Portland across consecutive days.
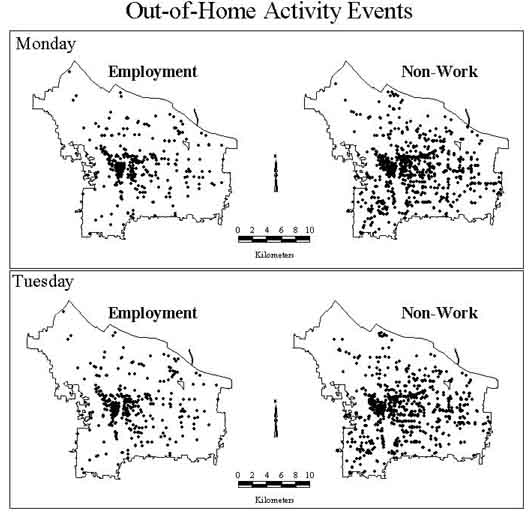
Geocodes of out-of-home activity events for Monday and Tuesday have been plotted in Figure 3. A general qualitative assessment of the event distributions seems to indicate that non-work events are relatively more dispersed within Portland than employment events. The employment event distributions appear to be relatively similar across both days. This also appears to be the case for non-work events. Employment and non-work events appear to be concentrated in and around downtown Portland. In general, the scatterplots suggest that non-work and employment events are not uniformly distributed within Portland. These general observations are explored further in the remainder of this section.
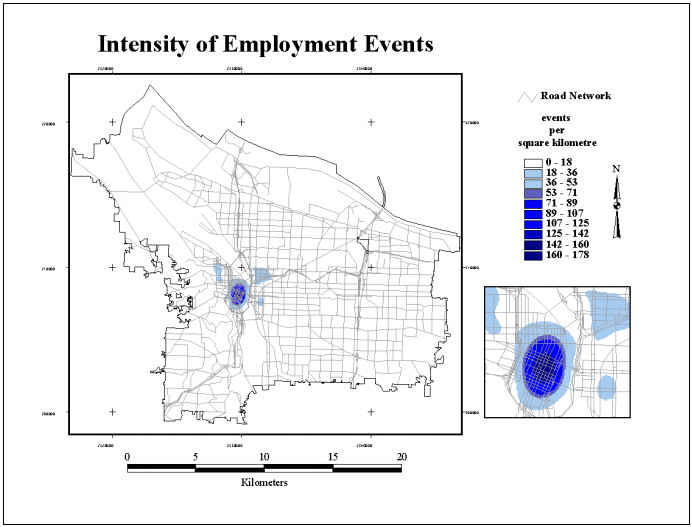
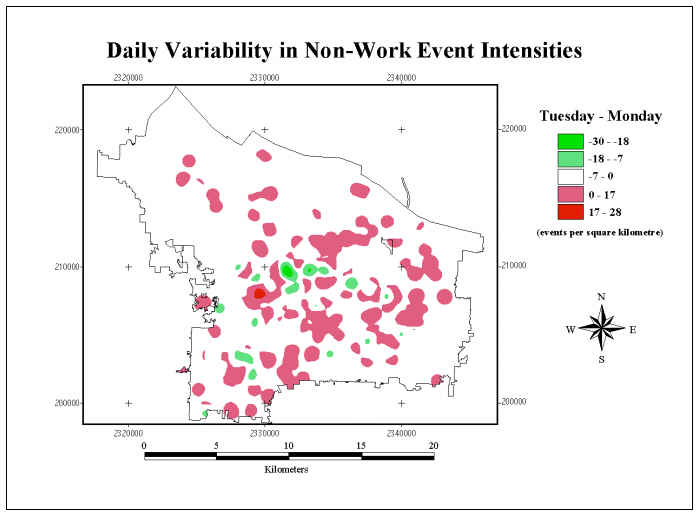
There are certain general similarities across all estimates of intensity reported in this section. In all cases the value for the kernel bandwidth has been set to 750 metres. In addition, with the exception of Figure 7, darker regions of each plot indicate subregions of Portland where events are concentrated. An estimate of the intensity of Monday's employment events has been plotted in Figure 4. This figure effectively highlights subregions of the city characterized by relatively high levels of employment density. There is a local peak in intensity in downtown Portland. That is, the kernel estimate suggests that relative to other parts of the city employment events appear to be clustered in the downtown area. The estimate of intensity flattens out toward the remainder of the study area. This result suggests that downtown Portland is the dominant employment centre within the city. This does not imply that Portland is a monocentric city. Rather, while other employment centres likely exist, downtown Portland tends to have higher levels of employment density than other portions of the city. Additional exploratory work not reported here has confirmed the existence of other employment centres within the city. The result for Tuesday was similar and for this reason has been excluded from the discussion.
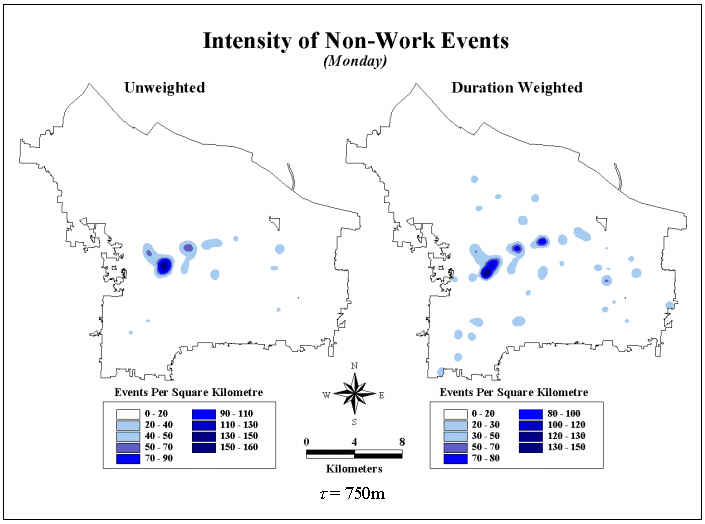
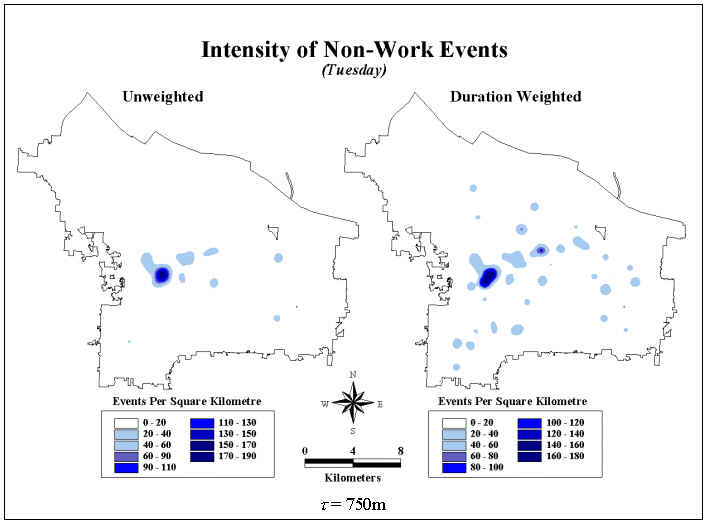
Estimates of regular and duration-weighted intensities of non-work events reveals local peaks beyond downtown Portland (Figure 5). As was the case for employment events downtown Portland remains the dominant centre for non-work event densities. The duration weighting reveals other local peaks of non-work events east of downtown. Additional exploration indicates a possible relationship between school locations and these other peaks. Recall from Figure 2 that the mean duration of school events tended to be longer than the mean duration for other non-work events. The duration-weighted results provide some initial indication that other non-work events might cluster around school locations. This needs to be explored in more detail. Figure 6 shows the intensity of non-work events on Tuesday. The pattern is relatively similar to the intensity estimate for Monday. Downtown Portland appears to be the dominant centre for non-work events with other local peaks being revealed east of downtown. The location of concentrations of longer duration events appears to be similar as well.
Differences in the estimates of intensity for non-work events between Tuesday and Monday have been explored. Monday's kernel surface has been subtracted from Tuesday's kernel surface using the Spatial Analyst's Map Calculator. The resulting surface is shown in Figure 7. Cells with negative values in the resulting surface reflect locations where the intensity of non-work events is higher on Monday than on Tuesday. Cells with positive values reflect locations where the converse is true. The surface suggests that different portions of the city may be used at different levels of intensity across multiple days. If individual activity/travel behaviour was completely repetitive and habitual then the use of space would be fairly consistent across multiple days at the aggregate level. Individual participation in certain classes of activities may be consistent across days but the location at which these events take place may not be. Examining individual estimates for Monday and Tuesday suggests that the locations of high-use areas are fairly consistent across both days. While the location of high-use areas appears to be consistent the intensity of use is not. In addition, other areas beyond the identified local peaks appear to experience different levels of use between the two days.
Studying the distribution of employment and non-work events indicates that these events appear to be heavily concentrated in and around downtown Portland. The distributions of non-work events show local peaks beyond the downtown area. The observed event distributions are the result of the set of individual activity/travel decisions that when executed alongside similar decisions made by other individuals contributes to the concentration of events in certain portions of Portland. Higher levels of urban travel and related externalities such as congestion and mobile source emissions might be additional characteristics of these areas of highly concentrated activity events.
Kernel and weighted kernel functions have been used to explore spatiotemporal patterns of out-of-home employment and non-work activity events within Portland, Oregon. Evidence gathered from this exercise suggests that the intensity of non-work events vary over space and across days. This suggests that subregions of Portland may be used more frequently. This likely reflects the localisation of potential activity sites within certain portions of the city. Potential clusters of longer duration activities have also been revealed. Again, care must be taken when interpreting duration-based estimates because of potential respondent bias in the reporting of start and end times related to activity events. The weighted kernel estimation tended to highlight areas of Portland that contained schools. Future work might exclude school events from the analysis because they are not activities that are truly discretionary in nature. In addition, a school location might act as a peg around which other discretionary activities are organized in the same way that the workplace is thought to function for employed individuals. As shown in other work (e.g. Kwan, 2000) this study also reveals the dominance of downtown Portland as a hub for both employment and non-work activities. Future work might include a similar analysis conducted for specific non-work activity classes. It might also be interesting to explore variations in intensity between different population subgroups segmented by ethnicity, gender, employment status or other socioeconomic variables recorded for respondents in the Portland survey.
The process whereby individuals consume time and space for the purpose of engaging in activities outside of the home has been the principal focus of this study. A number of non-substantive conclusions have been reached as well. Incidental to this research is a general recognition of the effectiveness of GIS software for managing and analyzing the large volume of data generated by contemporary travel surveys. Specifically, ArcView and its Spatial Analyst Extension offer considerable functionality to support exploratory spatial data analysis in a transportation research context. One of the challenges to building increased synergy between transportation research and GIS is the construction of appropriate data structures that enable the management of the temporal dimension. The demand for travel and activity participation is intrinsically spatial and temporal in nature. While an active research area, issues of spatial and temporal aggregation and dynamics have yet to be fully addressed in either community.
Support for this research was provided by a Major Collaborative Research Initiative, Social Sciences and Humanities Research Council of Canada (412-1999-1010) "Access to Activities and Services in Urban Canada: Behavioural Processes that Condition Equity and Sustainability", 2000-2005. Additional support from the Networks Centres of Excellence Programme of the Canadian federal research council "Human behaviour and GIS-based Land Use and Transportation Modelling", 1999-2002 is also gratefully acknowledged.
Bailey, Trevor C. and Anthony C. Gatrell (1995) Interactive Spatial Data Analysis, Longman Group Limited, Essex, England.
Ben-Akiva, M. and J. L. Bowman (1998). Integration of an Activity-Based Model System and a Residential Location Model. Urban Studies 35(7), 1131-1153.
Bhat, C. R. and F. S. Koppelman (2000). Activity-Based Travel Demand Analysis: History Results and Future Directions. Paper presented at the 79th Annual Meeting of the Transportation Research Board, Washington, D.C.
Cambridge Systematics. (1996) Data Collection in the Portland, Oregon Metropolitan Area: Case Study U.S. Department of Transportation: DOT-T-97-09.
Cullen, I. and V. Godson (1975). Urban Networks: The Structure of Activity Patterns. Progress in Planning, 4(1), 1-96.
Damm, D. (1982). Parameters of Activity Behavior for use in Travel Analysis. Transportation Research A, 16A(2), 135-148.
Ettema, D., A. Borgers and H. Timmermans. (1993). Simulation Model of Activity Scheduling Behaviour. Transportation Research Record 1413, 1-11.
Garling, T., M.-P. Kwan and R. G. Golledge. (1994). Computational-Process Modelling of Household Activity Scheduling. Transportation Research B 28(5), 355-364.
Garling, T., T. Kalen, J. Romanus and M. Selart. (1998). Computer Simulation of Household Activity Scheduling. Environment and Planning A 30, 665-679.
Gatrell, A.C., T.C. Bailey, P.J. Diggle and B.S. Rowlingson (1996) Spatial Point Pattern Analysis and its Application in Geographical Epidemiology. Transactions of the Institute of British Geographers 21, 256-274.
Golledge, R. G. and R. J. Stimson (1997). Spatial Behaviour: A Geographic Perspective. New York, The Guilford Press.
Golledge, G. R., M.-P. Kwan and T. Garling. (1994). Computational Process Model of Household Travel Decisions Using a Geographical Information System. Papers in Regional Science 73(2), 99-117.
Golob, T. F. and M. G. McNally (1997). A Model of Activity Participation and Travel Interactions Between Household Heads. Transportation Research B 31(3), 177-194.
Golob, T. F. (2000). A Simultaneous Model of Household Activity Participation and Trip Chain Generation. Transportation Research B 34(5), 355-376.
Hanson, S. and J. O. Huff (1982). Assessing Day-to-Day Variability in Complex Travel Patterns. Transportation Research Record 891, 18-24.
Jones, P., F. Koppelman and J. P. Orfeuil. (1990). Activity Analysis: State-of-the-Art and Future Directions. In Jones, P. (ed.), Developments in Dynamic and Activity-Based Approaches to Travel Analysis. Aldershot (UK): Avebury, pp. 34-55.
Kwan, M-P. (2000). Interactive Geovisualization of Activity-travel Patterns Using Three-dimensional Geographical Information Systems: A Methodological Exploration with a Large Data Set. Transportation Research C 8(1-6), 185-203.
Kitamura, R. (1988). An Evaluation of Activity-Based Travel Analysis. Transportation 15, 9-34.
Kitamura, R. (1996). Applications of Models of Activity Behaviour for Activity Based Demand Forecasting. in Texas Transportation Institute (eds.) Activity-Based Travel Forecasting Conference, June 2-5, 1996 Summary, Recommendations, and Compendium of Papers. Washington, D.C.: Travel Model Improvement Program, U.S. Department of Transportation and U.S. Environmental Protection Agency, pp. 119-150.
Kuppam, A. R. and R. M. Pendyala (2000). An Exploratory Analysis of Commuters' Activity and Travel Patterns. TRB 79th Annual Meeting, Washington, D.C.
Miller, E. J. and P. A. Salvini (1997). Activity-Based Travel Behavior Modeling in a Microsimulation Framework. Paper presented at the 8th Meeting of the International Association of Travel Behavior Research, Austin, TX.
Miller, E. J. and P. A. Salvini (2000). The Integrated Land Use, Transportation, Environment (ILUTE) Microsimulation Modelling System: Description & Current Status. Paper presented at the 9th Meeting of the International Association of Travel Behavior Research, Queensland, Australia.
Misra, R. and C. Bhat (2000). Activity-Travel Patterns of Non-Workers in the San Francisco Bay Area: An Exploratory Analysis. TRB 79th Annual Meeting, Washington, D.C.
Pas, E. I. (1985). State of the Art and Research Opportunities in Travel Demand: Another Perspective. Transportation Research A 19(5/6), 460-464.
Pas, E. I. (1996). Recent Advances in Activity-Based Travel Demand Modeling. in Texas Transportation Institute (eds.) Activity-Based Travel Forecasting Conference, June 2-5, 1996 Summary, Recommendations, and Compendium of Papers. Washington, D.C.: Travel Model Improvement Program, U.S. Department of Transportation and U.S. Environmental Protection Agency, pp. 79-102.
Recker, W. W., M. G. McNally and G. S. Root. (1986a). A Model of Complex Travel Behaviour: Part 1--Theoretical Development. Transportation Research A 20(4), 307-318.
Recker, W. W., M. G. McNally and G. S. Root. (1986b). A Model of Complex Travel Behavior: Part II--An Operational Model. Transportation Research A 20(4), 319-330.
Stopher, P. R. (1993). Deficiencies of Travel-Forecasting Methods Relative to Mobile Emissions. Journal of Transportation Engineering 119(5), 723-741.
Stopher, P. R., D. T. Hartgen and Y. Li. (1996). SMART: simulation model for activities, resources and travel. Transportation 23, 293-312.
Supernak, J. (1983). Transportation Modeling: Lessons from the Past and Tasks for the Future. Transportation 12(1), 79-90.
U.S. Department of Transportation (1998) A System of Activity-Based Models for Portland, Oregon FHWA-PD-99-003.
Ronald Buliung, Systems Administrator/Sessional Lecturer, School of Geography and Geology, McMaster University, 1280 Main St. West, Hamilton, Ontario, Canada, L8S 4K1, Tel: (905) 525-9140 ext.23515, Fax: (905) 546-0463, E-mail: buliungr@mcmaster.ca.