Abstract: USAA has developed a web based, graphical model that provides users flexibility in estimating the number of potential, active, and remaining claims for any type of catastrophe. This presentation will present and demonstrate the tool, needs and benefits of developing this functionality for USAA. The model uses Esri software applications with some custom development on our base GIS infrastructure.
Improve the Cat Modeling process by enhancing the current process with additional, more timely data, in order to develop more accurate catastrophe reserves to help ensure the continued financial stability of the Association; and to make more accurate Cat Operation decisions to better serve our members.
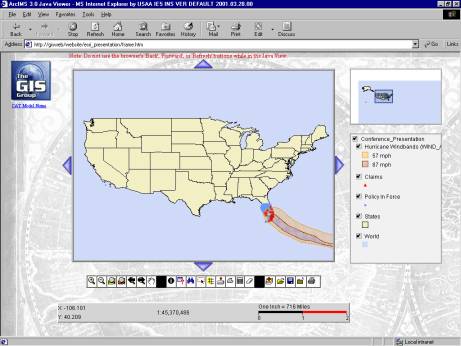
The CAT Model is an ArcIMS (Internet Map Server) application designed to assist Loss Reserving and Cat Operations personnel in the viewing and analysis of Homeowners, Fire, and Renters policy in force data, as well as other catastrophe-specific data.
There are four options with which to view the policy in force information:
Quick View: An interactive tool which provides tools for simple viewing and querying of the U.S. policy in force data.
Java View: An interactive tool similar to the Quick View, but with additional analysis capabilities.
Pre-Processed Policy In Force Maps: This option shows policy in force maps at the U.S., state, county and ZIP code levels.
Policy In Force (PIF) Reports & Geocoding Hit Rates: This option shows policy in force counts (both total PIF and geocoded PIF) at the state, county and ZIP code levels. The geocoding hit rate is the percentage of PIF that were successfully geocoded to the address level, however other levels of geocoding are available in the application.
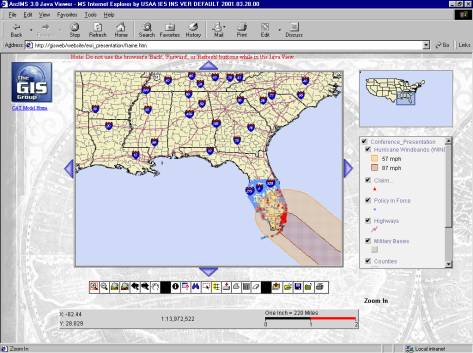
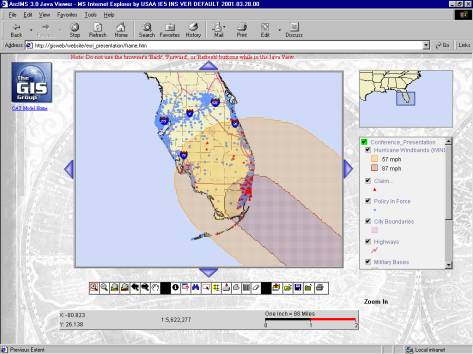
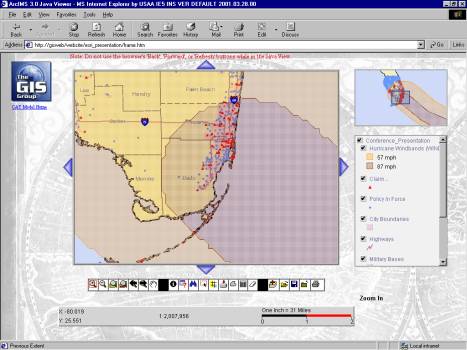
Homeowners, Fire and Renters policy in force: This data layer originates from the Property & Casualty system and the files are updated once a month. Each blue dot depicts a single risk address.
Nightly Claims Data Layers: Nightly claims layers are created by CAT-ID to provide up to date information about a particular event.
State, County, ZIP Code, City, Military boundaries, and Highways/Streets: These layers come from GDT Dynamap/2000 data and are updated on a quarterly basis.
Other Data Layers:
Other relevant data layers, such
as hurricane wind bands or earthquake shake intensity zones, will appear on an
as-needed basis.
This project will implement GIS functionality to support:
All catastrophic situations including hurricanes, earthquakes, snowstorms, tornadoes, fires, floods and hailstorms.
Various scenarios for a particular catastrophe, including data at the individual policy location level.
The incorporation of actual claim information, as it becomes available.
A single daily cat data source that will serve both claims management and loss reserving.
A single graphical representation of the model through CAD based tools.
When a major catastrophe occurs, senior management will rightfully expect accurate, timely (daily) information that they can use to make critical decisions.Sending the wrong number of adjusters with the wrong skill sets to the wrong places can result in poor service to the membership when they need us most, and can result in unnecessarily high expenses. Inaccurate estimates of loss and LAE costs can lead to improper decision-making by senior management.
Also, the push towards shorter financial closing schedules (eventually, to a “virtual close”) makes it imperative that robust catastrophe data be accessible on a daily basis to facilitate the accurate estimation of catastrophe liabilities. Waiting until delivery of correct month-end data to analyze catastrophes is not an option.
Around 5:00 AM on Wednesday, January 3, 2001 a fire started about 30 miles east of San Diego. With the winds blowing at 65 mph toward the west the fire quickly got out control. It started threatening the moderately populated city of Alpine. By mid-morning, evacuations began to take place. Looking at a 3-hour visible satellite loop the smoke from the fire could be seen blowing across San Diego and then out over the Pacific.
By late morning the WESTRO (USAA Sacramento office) requested that Cat Operations plot a map showing the southwest portion of San Diego county. They asked that the map include the Homeowner and Fire Policies In Force, by risk location, so that they could assess the exposure. This was a standard request, but given that the fire was out of control and moving quickly WESTRO had need for immediate information. They expressed concern about how quickly that need could be met. Plotting a hard copy map in the home office generally takes about an hour, if the map is fairly simple. Then the map must be shipped over night to the region which means they wouldn’t receive it until the next morning.
With the new GIS web application in place, WESTRO did not have to wait. It only took about 5 minutes for them to pull up a web browser and “plot” their own map on the screen. This new application provides the same information (plus more) that is available in a hard copy plotted map and it is available immediately.
Fortunately, the fire did not continue to rage. By the next day, Thursday, the winds were down to a mere 30 mph and then by Friday, the fire fighting teams were able to start controlling the fire. USAA only received 6-7 claims and only one of those actually had any fire damage. The rest were for smoke damage or Additional Living Expenses. But it could have easily been much worse.
My sincere appreciation to the CAT Model project team for your dedication, hard work and commitment to GIS tools, technologies and the industry.
Randy Murray, P&C
Business Project Manager
Reginald
Warren, IT Senior Design Analyst
Connie Cheng, IT Senior Systems Analyst
Joe Sterling, IT Systems Analyst
John Clark, IT Associate Systems Analyst
Julie Brown, IT Associate Systems Analyst
Craig Hopkins
Information Technology Director, USAA Information Technology
Enterprise Solutions, Corporate Real Estate & Services
9800 Fredericksburg Road
San Antonio, TX 78288
(210) 913-8168
Email: craig.hopkins@usaa.com