Executing State Privatization Program 2000-2002 the State Property Fund of Ukraine (SPFU) looks for modern conditions to provide the purchase and sale competition and placing shares of the privatization objects with the purpose of attraction as many potential buyers as possible. Important step in informing investors about sale objects and about terms of participation in Ukrainian privatization is realization of complex investment marketing program “Ukraine 2000”. That is why the urgent task is development of tools for presentation and access not only to technic, economic and social characteristics of the object itself but also to information about geographic disposition of privatization objects, transport, utilities, urban areas, population index and others. In other words it is necessary to create access to spatially coordinated data that characterize privatization object and its surrounding on level: local-region-state-international. We can model logic financial-economic sequence of operations of potential investor’s experts like that: getting acquired with information about privatization object experts first of all notice object’s disposition and region where it is situated i.e. geographic allocation as in national so in regional context.
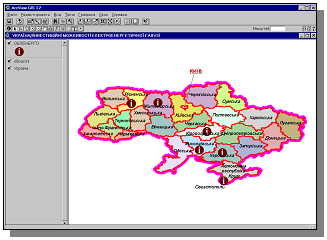
Picture 1. Allocation of privatization objects of electric power system of Ukraine
As it is shown on the Picture 1 the two objects are allocated in northwestern region, three ones in South region and one in Central region of Ukraine. Having classified them for example on number of population inhabited regions served by region power corporations (oblenergo) it is possible to construct chart of correlation of gross domestic product (GDP) per head to its number. So we can make conclusion that among three regions (oblasts) (Rivne, Kirovograd, and Kherson) that have approximately same population level, GDP per head is biggest in Rivne region at the relatively small number of consumers.
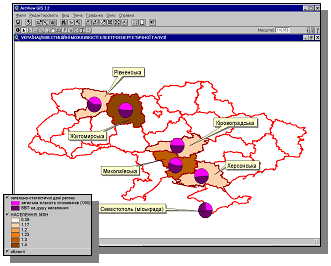
Picture 2. Example of statistic analysis
For potential investor it is also important to compare operational and financial figures of that or other privatization object on regional level. For example, let us classify objects on index of power supply in 1999 and compare them with figures of accounts receivable and accounts payable. We can draw a conclusion that among companies with highest level of power delivery is Joint Stock Company “Khersonoblenergo”. But it also has got the highest level of debts and its accounts receivable equals to accounts payable of the neighboring Joint Stock Company “Mykolayivoblenergo”.
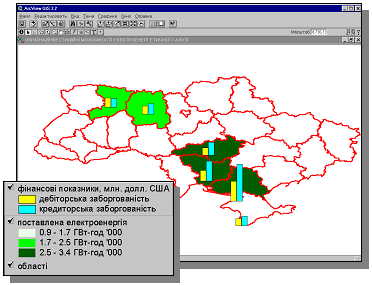
Picture 3. Analysis of financial indexes (accounts receivable and accounts payable)
Such common analysis is insufficient for potential investor for decision-making, because he/she is also interested in production infrastructure (transmission network, number and disposition of power amplifiers, distance to the main office, public utilities and others) and regional market.
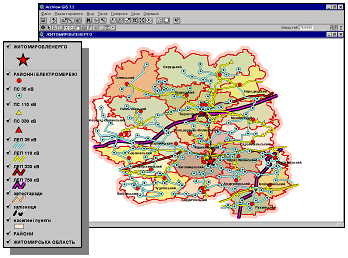
Picture 4. Main objects of infrastructure of Joint Stock Company “Zhytomyroblenergo”
As it is shown on the Picture 4 such objects have got very complicated infrastructure and are allocated on the large territory. Using functions of spatial analysis offered by convenient tools of graphic interface, it is possible to find quickly or select objects on some features, to increase to convenient size their depiction, to create special buffer zones on given distance around given objects, to analyze in detail the character of that or other object and so on.
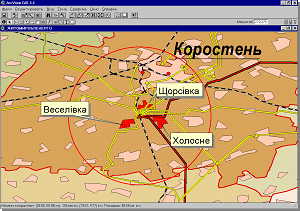
Picture 5. Objects of 35 kilovolt power amplifier allocated in Korosten district (red-color legend)
On the next picture (Picture 6) it is represented the network of Joint Stock Company’s “Zhytomyroblenergo” transmission lines, power amplifiers (110 kilovolt) and urban areas in 10 km around power amplifier (330 kilovolt). Built-up area allocated within 3 km from power amplifier is depicted red circle.
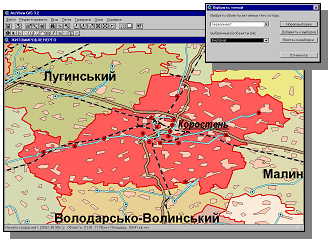
Picture 6. Korosten district information (example)
Here is another important example that shows advantages of the use of spatially coordinated data and geographic information systems. It permits to select objects disposed on the given distance. For example objects allocated within 50 km from company’s main office, consequently buffer zones allocated in 10-20-30 km from district transmission facilities (Picture 7.)
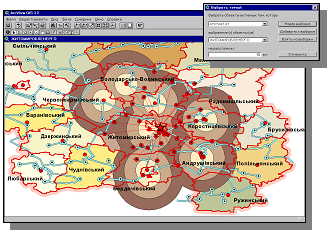
Picture 7. Disposition of 35 kilovolt power amplifier within 50 km from the main office of oblenergo
So, for realization of purchase and sale competition and attraction as many potential buyers as possible it is necessary to create Internet GIS Web-server. Internet is used to deliver data on privatization objects to the user’s browser and desktop. It’ll give the possibility to present digital mapping and semantic data about privatization object, territory of its allocation on the object-, local-, regional-, national-, and international level in real mode through Internet on consumer’s inquiry in any point of the globe. The system is going to have the convenient and interactive user interface that accounts for the use of standard WEB-browser possibilities and special software.
The system maintains information flows of SPFU’s computer systems.
Geographic spatial data WEB-server is able to increase information awareness of potential investors about economic and geographic characteristics of privatization object and region of its dislocation. The main distinctive features of such a WEB-server are specific information resources i.e. digital territorial maps joined to attributive economic databases of privatization objects of SPFU. WEB-server information resources will contain digital cartographic materials from objective level up to international. To create such a WEB-server it is necessary to develop corresponding hardware and software complex that will contain information resources, systems and application software and hardware (including communication links).
Information resources first of all form economic data of SPFU RDBMS transferred by corresponding tools of ODBC to the GIS server. Privatization objects will be presented as cartographic materials comprising drafts of main bildings and industrial objects and also situation plan or scheme. Mentioned documents will represent dislocation of enterprise’ industrial places on urban area regarding its main objects, nature of building up, means of communication and so on. For more effective use of the existed information resources it will be developed the order of data forming and updating in the form of exchange report between information systems of SPFU and WEB-server. It is also appointed persons responsible for information gathering, actualization and layout. It is developed organization chart of timely information gathering and processing after approval of corresponding list of privatization objects.
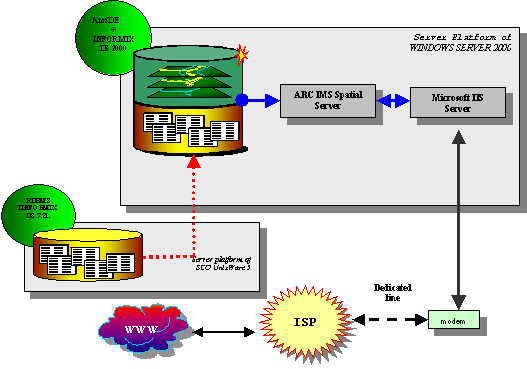
Systems and application software (needed for effective processing and representation of the indicated information resources) comprises complex of information technologies designed for saving, administration, and support of users with attributive and geographic spatial data on the first inquiry. For software and hardware complex development there will be used software of the following class of information technologies:
- Service platform based on processor Intel Pentium-4;
- Environment – Microsoft Windows 2000 Server;
- RDBMS – Microsoft SQL 2000 Server or INFORMIX Dynamic Server 2000;
- Geographic information technologies – ArcInternet Map Server;
- WWW-server – Microsoft Internet Information Server (Picture 8).
All the indicated software products have got standard integration means and maintain the hardware scaling.
So, Internet GIS WEB-server is tool for making information on privatization objects disposition available. It provides immediate access to the latest data of SPFU. WEB-server hardware and software complex is all-sufficient information system that answer all the modern requirements of such class systems and enables to present effectively the economic and geographic data about privatization objects and territories of their dislocation.