PREDICTION OF ATMOSPHERE POLLUTION IN KIEV DURING UNFAVOURABLE WEATHER CONDITIONS
Scientific And Industrial Enterprise
"ECOMEDSERVICE"
31-a Horyva Str
Kiev, 04071
Ukraine
Authors:
Sergiy Zorin, Director of "Ecomedservice"
Oleg Karatvtsev, GIS Manager of "Ecomedservice"
Daniel Karabaev, Chairman of Enviromental Comission of Kiev City Council
Mykhailo Movchan, Chairman of Kiev State Administration for Environmental Protection and Natural Resources
Ambient air quality depends on amount of contaminant emission from two main types of sources: stationary and mobile. Total contaminants emission amount from stationary and mobile emission sources made up in 1990 – 273,000 ton; in 1995 – 123,000 ton; in 2000 – 83,000 ton (on official statistic data).
Monitoring of contaminant concentration in atmosphere air has being carried out by Hydrometeorological Service of Ukraine in 16 stationary observation posts (14 contaminants and 8 toxic metals). The results of observation has showed that average annual concentrations of contaminants in 2000 did not exceed maximum allowable concentrations (MACs) except for nitrogen dioxide and benzapilene that twice exceed MACs.
Emissions from stationary sources are caused by more than 700 diversified industrial enterprises existing in Kiev that number more than 24,000 emission sources.
During some last years there appeared upward trend for contaminant emission from fuel and energy enterprises. In 2000 emissions reduced by 10,000 ton in comparison with the previous year. It’s become possible first of all because of use of natural gas as a fuel by energy enterprises. The share of natural gas in 2000 became 98% (in 1997 – 81%, in 1999 – 89%).
Up from 1999 in Kiev City it has been forming “REGISTER OF STATIONARY EMISSION SOURCES” where data about parameters of stationary emission sources and emission composition are entered. 226 objects of man-caused environmental risk (that is about 20% of stationary emission sources) from 700 ones existed in Kiev City are already entered to the database of the decision support system “ecoGIS-KIEV”. The main pollutant of atmosphere is energy enterprise complex (75%). “ecoGIS-KIEV” contains information on all the stationary emission sources and emission storages based on enterprises’ data (Picture 1).
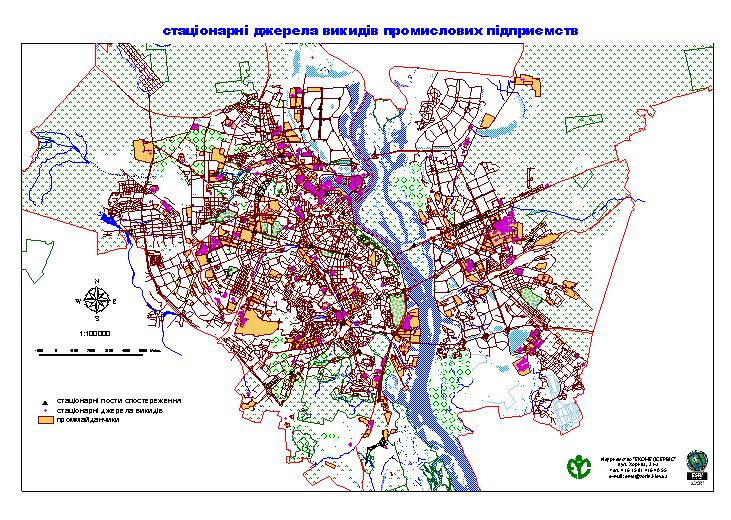
Picture 1. Dislocation of stationary emission sources of industrial enterprises. (Purple color)
The main sources of input data on pollutant characteristics from stationary emission sources are Projects of Maximum Allowable Emissions that have to be developed by all the objects of man-caused environmental risk according to the existing in Ukraine environmental legislation.
Road vehicles are one of the main sources of atmosphere pollution either in Kiev City so in number of large cities of Ukraine. So, according to statistic materials, total amount of emissions from mobile sources made up 52,000 ton during 2000, that is more than half of entire city ones.
The main exhaust contaminants are carbonic oxide, nitric oxide, hydrocarbon (including cancerogenic), aldehyde and other specific chemical agents. Emission composition from car’s combustion engine depends on many factors: engine type (carburetor, diesel), its operating mode and work, technical state, fuel quality, etc.
According to some data the number of motor transport from 1990 to 1998 increased more than twice (from 212,000 to 470,000 cars). Consequently the city atmosphere air is highly polluted, especially in districts bordering to highways.
During some last years there appeared downward trend for total amount of the emissions in the city, and upward trend for mobile sources emissions, that rises this problem to the high-priority ones among city environmental problems. In experts’ opinion the reasons for such a situation are the increase of amount and worsening of technical state of motor transport, inadequate fuel quality, lag of roads development terms and others. During the last 5 years the number of road vehicles increased almost in 2.5 times and makes up 500,000.
It is well known that pollutant concentration depends on speed of contaminants arrival, spatial disposition of emission sources, pollutant dissemination and transfer character (lots meteorological factors), peculiarities of contaminants chemical conversion in atmosphere and rate of their subsidence to earth surface. Considerable spatial-time changeability of meteorological factors together with constant unsteadiness of pollutant emissions lead to high spatial-time mutability of pollutant concentrations in the atmospheric boundary layer (ABL). During some periods when weather conditions promote contaminants accumulation in ABL, their concentrations could rise distinctly. In order to prevent high level pollution during such periods it is necessary to predict previously the similar situations and to reduce pollutant emissions. Prognostication of high-level air pollution is the reason to make decisions about emissions regulation.
To get true sketch of air pollutant concentration spatial changeability and to design a map of urban area pollution on experimental data it is necessary to take samples of air systematically in computation grid with cell size not more than 2 km.
Taking into consideration the area, structure of building up, and relief form of Kiev City the practical solution of the given problem is almost impossible. That is why to design concentration areas it is necessary to use methods of mathematical modeling for processes of pollutant dissemination in atmosphere air.
According to the State Atmosphere Pollution Observation Laboratory data during last three years the high-level pollution concentrations appeared 20 times. For example in 1998 it was like that: January – 4 times, October – 3 times, November – 1 time, December – 9 times.
Environmental-geographic databases contain 36 main city highways, which are composed of 520 road segments.
It is important to determine and distribute on composition and volume the main city traffic and its modification as to daytime and season. This paper contains results of applied information technology development of transport and service system impact assessment upon environmental situation of Kiev City. The authors of the given paper have determined city traffic characteristics (Picture 2).
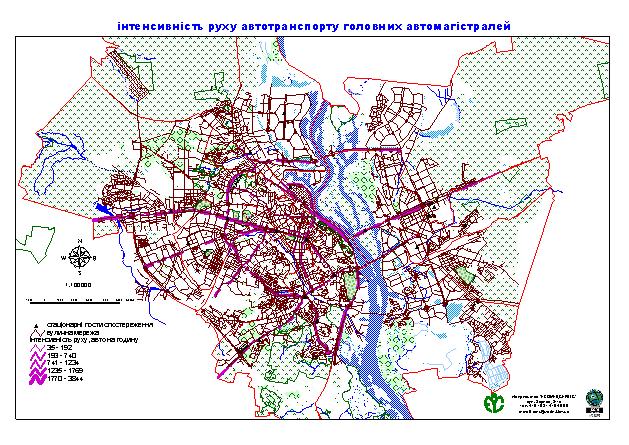
Picture 2. Main highways traffic volume per hour (Purple color)
To form array of output data on experimental computation there were collected primary data from different sources. Detail information was obtained from local transport utilities and based on road registration certificates and natural measurements carried out by Ukrainian National Transport University.
Determination of air pollution concentration was made in computation mode. In the first stage there were made some computations of pollutant concentration from mobile and stationary emission sources. Such approach allows to calculate the area of maximum possible one-time concentration from some emission sources, group of sources, hot and cold emissions, and also gives possibility at the same time to take into account influence of heterogeneous sources and to calculate total pollution from them. In the second stage the acquired prognostic maps for each type of sources were made to determine the total concentration. There were designed maps of pollution by means of Spatial Analyst extention of ArcView software. GRID cell equals to 50 m. According to principals of Ukrainian normative-lawful acts during meteorological conditions of high-level pollution the contaminant concentrations increase in the same number of times irrespective of the computation area point.
While implementing the named work there were made prognostic calculations of pollutant determination during meteorological conditions of high-level pollution for each contaminant and their combinations.
Prognostic computation results of nitrogen dioxide from stationary emission sources (SES)
On computation results the city territory was divided into 4 pollution zones according to contaminant concentration levels. Two of them have high pollution concentration (2.5 MACs, 1.6 MACs), one has concentration equals to 1 MACs, and the last one has concentration below BAE (0.7 MACs). See Picture 3.
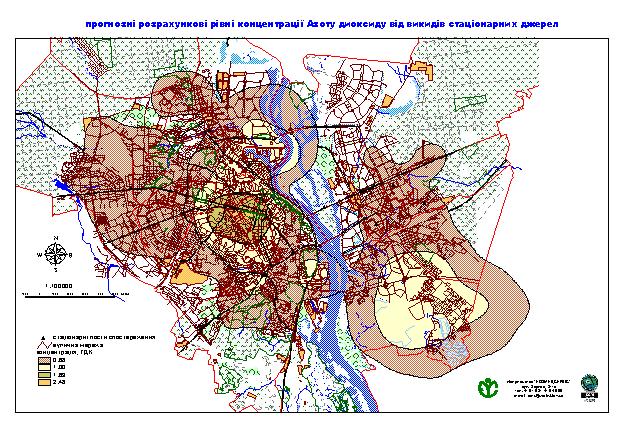
Picture 3. Areas of prognostic concentration levels of nitrogen dioxide from fixed emission sources (FES)
Prognostic computation results of carbon dioxide from fixed emission sources (FES)
According to the computation results the city territory was divided into 4 zones polluted from SES according to CO concentration levels. All the concentrations are lower than 1 MAC. See Picture 4.
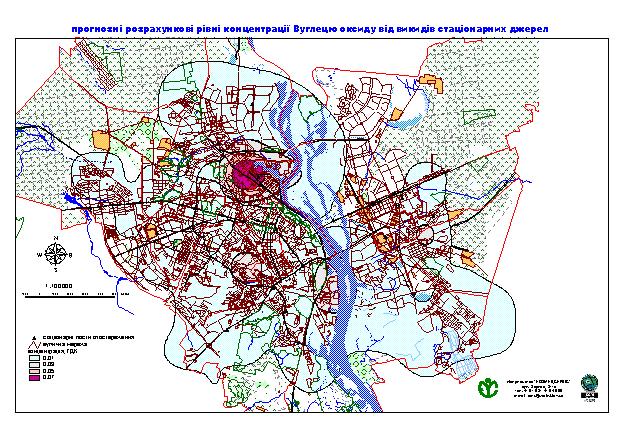
Picture 4. Area of prognostic levels of CO concentrations from FES
Result of prognostic computation for CnCHm concentration from FES is lacking because its maximum concentration in atmospheric boundary layer does not exceed 5% MAC from onetime emission.
Results of computation for NOx concentration from mobile emission sources (MES)
On computation results the city territory was divided into 4 pollution zones according to contaminant concentration levels. The first zone has maximum pollution concentration – 9.5 MAC, and the fourth one has minimum concentration – 1 MAC. Picture 5.
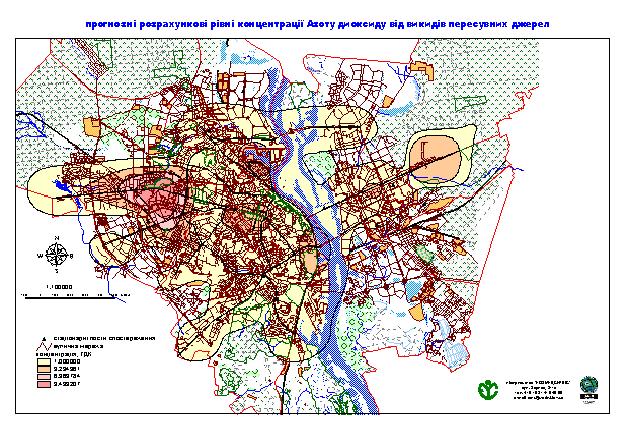
Picture 5. Area of prognostic levels of NO2 concentrations from MES
Results of computation for CO concentration from mobile emission sources (MES)
On computation results the city territory was divided into 4 pollution zones according to CO concentration levels. The first zone includes two areas with rather high pollution concentration level – 2.5 MAC; second one’s concentration level is lower – 1.7 MAC; the third zone contain 5 areas with concentration equals to 1 MAC; and the last one has concentration lower than 1 MAC – 0.65 MAC. These zones almost completely coincide with city pollution with NO2 from MES (Picture 6).
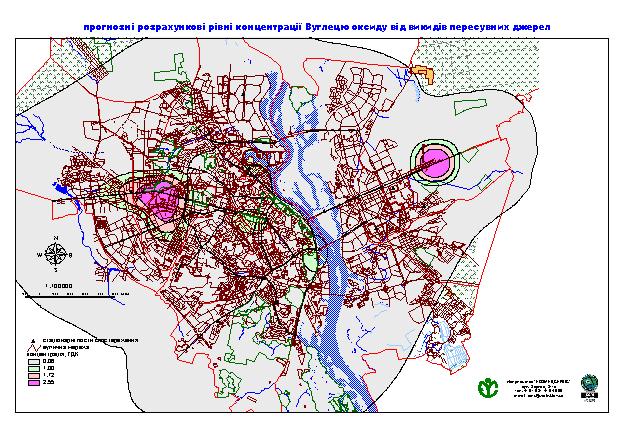
Picture 6. Area of prognostic levels of CO concentrations from MES
Results of prognostic computation for boundary hydrocarbon concentration from mobile emission sources (MES)
On computation results the city territory was divided into 5 pollution zones according to contaminant concentration levels. The first zone has maximum pollution concentration level – 1.95 MACs and the fifth one has minimum pollution concentration – 0.057 MAC. Disposition of pollution zones is alike to disposition of pollution with NOx and CO from MES (Picture 7).
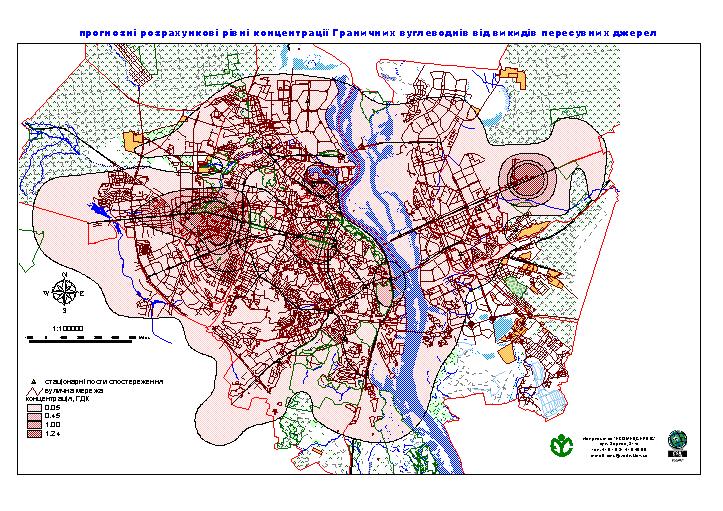
Picture 7. Prognostic levels of pollution concentration with CnHm (m=2n+2) from MES
As a result of the given work and based on standard lawful regulation of Ukraine there were implemented computations and obtained prognostic maps for pollution of nitrogen dioxide, carbonic oxide, and boundary hydrocarbon as from stationary emission sources, so from mobile pollution sources. Maximum concentration level of nitrogen dioxide from mobile emission sources was 9.5 MACs. Pollutants concentrations lower than boundary allowed emissions were observed for one area of nitrogen dioxide from stationary emission sources (0.7 MAC); for all the areas of carbonic oxide from stationary emission sources (0.073 MAC; 0.053 MAC; 0.033 MAC; 0.01 MAC); for boundary hydrocarbon from stationary emission sources; for one area of carbonic oxide from mobile emission sources (0.65 MAC); and for two areas of boundary hydrocarbon from mobile emission sources (0.452 MAC; 0.057 MAC). Pollutant concentrations equal to the boundary allowed emissions were observed for one of the areas of NO2 from stationary emission sources and mobile emission sources. Pollutant concentrations that are higher than boundary allowed emissions were observed for two areas of nitrogen dioxide from stationary emission sources (2.5 MACs; 1.6 MACs) and three areas of nitrogen dioxide from mobile emission sources (9.5 MACs; 6.4 MACs; 3.2 MACs); two areas carbonic oxide from mobile emission sources (2.5 MACs; 1.7 MACs) and two areas of boundary hydrocarbon from mobile emission sources (1.95 MACs; 1.25 MACs).
The obtained results can be used for improvement of stationary and under plume posts of atmosphere pollution observation. It is possible also due to increase of efficiency of air sample obtaining, of environmental monitoring system, design of high-priority environmental arrangements, social and economic development, and traffic network evolve.