Using Airborne LIDAR DEMs to Delineate NYC Reservoir
Boundaries According to Spillway Elevation Contours
Therese E. Spies, Dominique J. Thongs, Jonathan R. Tuscanes, and Barbara J. Dibeler
Abstract
It is important to New York City's Department of Environmental Protection to map reservoir extents
accurately because they are more strictly regulated than other water bodies. Reservoir
buffer lands have a higher priority for implementation of watershed protection programs.
Reservoir extent is defined as being equal to the dam spillway elevation contour line.
Until now, the spillway elevation had never been spatially delineated throughout the
reservoirs or their tributaries due to lack of detailed elevation data. Airborne LIDAR
surveys are used to provide high resolution (5 m horizontal) elevation data which are
further processed to accurately delineate spillway elevation contours, hence reservoir
extent.
Introduction
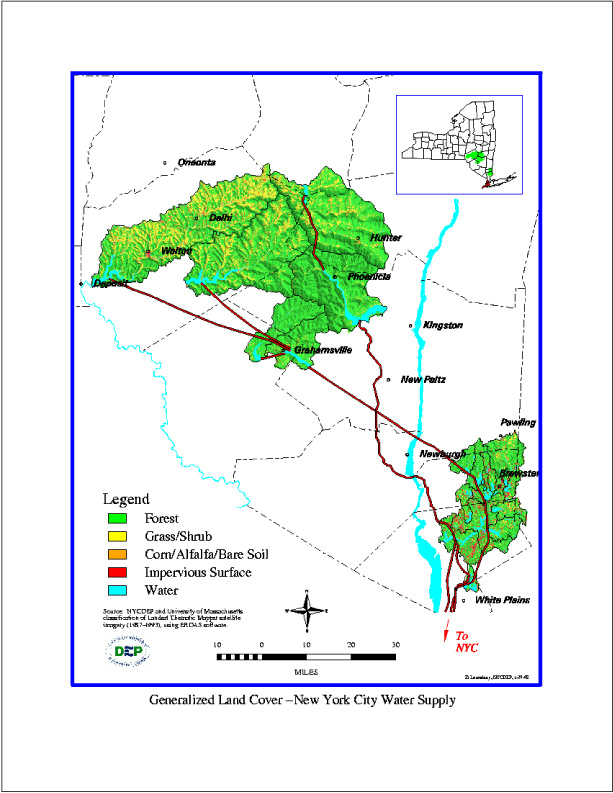
New York City's drinking water comes from three major reservoir systems north and
west of the City: the Catskill, Delaware, and Croton Systems (Figure 1).
These systems include 19 individual reservoirs with a total storage capacity of 580 billion gallons, supplying
drinking water to over 8 million consumers in New York City and nearby counties. The watersheds of these
systems encompass an area of 1969 square miles - nearly the size of the state of Delaware. This is the
largest gravity-fed and unfiltered water supply in the world. It remains unfiltered due to the superior
quality of the water, which meets or exceeds all State and federal drinking water standards (NYCDEP, 2001).
The Catskill and Delaware systems, which supply approximately 90% of the total water supply, are
nearly 77% forested and essentially undeveloped, except for many villages, hamlets, and farms that were
settled alongside streams and rivers (Figure 2).
To ensure the continued protection of watershed lands and the resulting excellent water
quality, a Watershed Memorandum of Agreement (MOA) was signed in 1997 between the City and the upstate
watershed communities which implements several watershed protection programs, such as Land Acquisition
and Stewardship, New Wastewater Infrastructure, Septic System Rehabilitation, and Whole Farm Plans with
Best Management Practices (Figure 3). In addition, a set of Watershed Rules and
Regulations were adopted in 1997 to support a Filtration Avoidance Determination granted to the City by EPA
until 2002, with the New York City Department of Environmental Protection (DEP) acting as a regulatory agency
in the upstate watersheds (NYCDEP, 1997).
Reservoirs are important to DEP because they are more strictly regulated than
other water bodies. They are also in an area of higher priority for the City's 300-360 million-dollar Land
Acquisition Program, as well as implementation of many other protection programs such as new infrastructure,
septic rehabilitation, and stormwater retrofits.
Unlike streams, reservoirs are also much more static geographic features, subject
only to very minor change in shape over time. According to DEP’s Limnology group, the DEP has always used
spillway elevation to "theoretically" define reservoir extent for all volumetric calculations and
models, however, the
spillway elevation has never been "spatially" delineated throughout the reservoirs or stems on maps due to
lack of adequately detailed survey or elevation data (Bader, 1999). The goal of this project is to improve
DEP's GIS-based reservoir delineations through the use of the new technology and higher resolution data
sources provided by airborne Light Detection and Ranging (LIDAR) surveys.
Pre-Project Data
The GIS reservoir polygon data currently portrayed on many of the DEP's maps, especially Land Acquisition
maps used for planning purposes, do not reflect the contour line equal to the elevation of the spillway, nor were
these polygons delineated based on any elevation sources such as Digital Elevation Models (DEMs). Rather, they
were visually digitized off of the water polygons on hard copy USGS topographic quads by a contractor to DEP, arbitrarily
cutting off each reservoir polygon somewhere in the stems where they appeared to narrow as opposed to where the
spillway elevation contour crossed the main tributaries. For these reasons, DEP's program activity decisions should
not be based upon these reservoir polygon data.
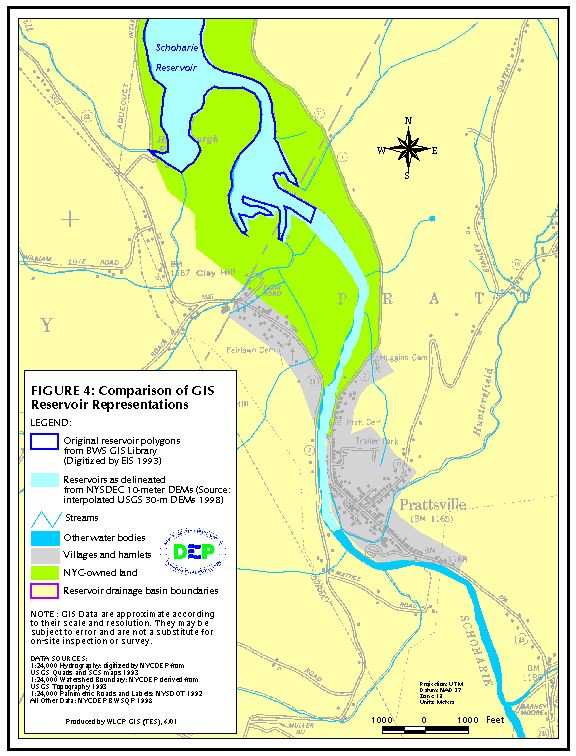
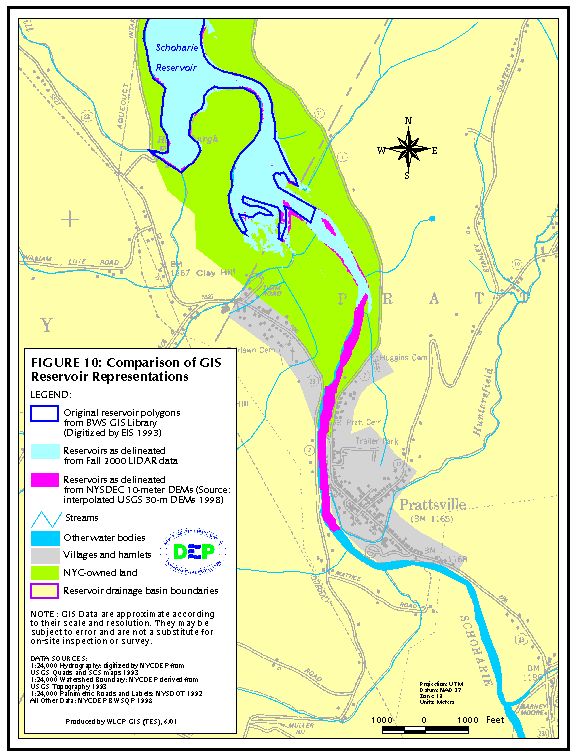
As an attempt to investigate alternative data sources, reservoir
polygons were derived from USGS 30 m DEMs, however, these severely overestimated the upstream reservoir extent.
If verified to be accurate via field surveys, this would have created a significant regulatory
problem in locations where a developed area is near a reservoir, such as the hamlet of Prattsville, just
above the Schoharie Reservoir (Figure 4). After reviewing maps of these
variously-derived reservoir
representations, it was determined that the current GIS
reservoir data needed to be improved. There was also agreement that the contour line equal to spillway elevation for each
reservoir should be used to delineate the presence of reservoir, regardless of actual water height which
varies seasonally. Once reservoir is thus defined, reservoir stem can be defined according to the 1997 Watershed
Rules and Regulations as that portion of the tributary that is within 500 ft (upstream) of the reservoir (NYCDEP, 1997).
Project Description
The purpose of this project was to improve the accuracy of the reservoir GIS
layer by conducting an Airborne LIDAR Survey. This project was done in collaboration with the New York State
Department of Environmental Conservation
(NYSDEC) Division of Water. LIDAR surveys were conducted by NYSDEC through contract with PAR Government Systems
Corporation (PGSC). NYSDEC
is also conducting Airborne LIDAR Surveys for flood plain mapping in the NYC West-of-Hudson watershed. By including
in the survey the 186 square miles covering all of the NYC reservoirs (including those East of the Hudson River) and their
buffer lands, this project gathered the necessary high resolution elevation data that DEP would need to extract spillway
elevation contours.
LIDAR data, as gathered by PGSC and their subcontractor, EagleScan Remote Sensing Inc., has a 5 m spatial resolution,
a horizontal accuracy of 1 m, and a vertical accuracy of 15 cm when flown at an altitude of
approximately 3000 ft and providing a 3000 ft swath
width (EagleScan, 2000). The average West-of-Hudson reservoir could be covered with 2 or 3 passes of the
aircraft. LIDAR is the most efficient way to gather continuous 3-dimensional data in the shortest time period with
the least cost, compared to individually
surveying each tributary using traditional land surveying methods. While LIDAR appears to be the best long-term option
to more accurately delineate reservoirs as well as surrounding features, the missions must be flown during leaf-off, low
water level time periods (i.e. late Fall) in order to penetrate canopy and gather elevation data below the spillway level
for thorough mapping of the terrain.
Once gathered, the LIDAR data undergo post-flight processing by the vendor to remove aircraft attitude distortion and resample
the scanner data to a regularly spaced 5 m grid. Trees and other structures are removed from the data to create a “pure
land elevation” surface using algorithms and manual techniques developed specifically for this application. A set of 5 m DEMs
covering both East-and West-of Hudson Watersheds in the UTM NAD83/NAVD88 projection/datum were delivered to DEP
in a standard acsii XYZ grid format. These were then re-formatted and imported into DEP’s GIS in ARC/INFO GRID format, tiled by reservoir
drainage basin, and reclassified using various analyses to reselect the grid cells representing elevation values less than or equal to the
specific reservoir’s spillway elevation. This provides a more accurate portrayal of how far upstream in each tributary the reservoir’s spillway
elevation reaches, thereby defining that section as actual “reservoir” for guidance to regulatory and other DEP program activities.
Methodology
Results
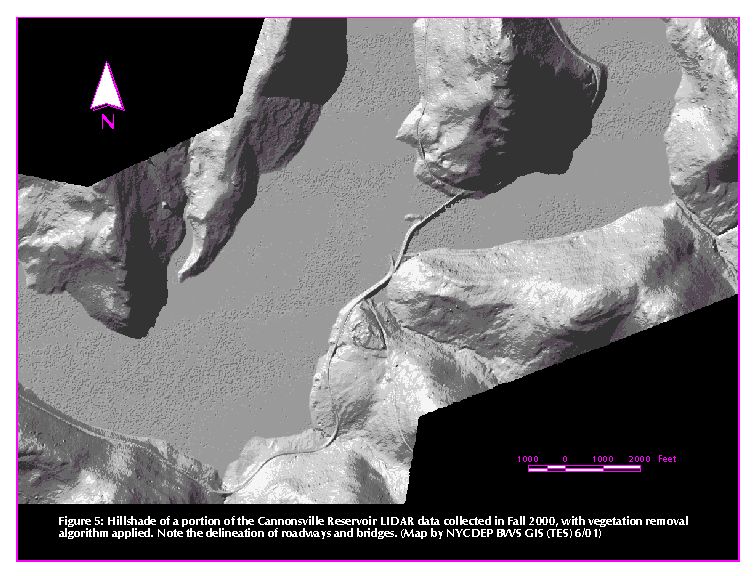
As illustrated in Figure 5 preliminary results show that the LIDAR DEM
represents a very close approximation of the elevation features in each reservoir basin.
When spot checked with a limited number of field GPS-surveyed USGS benchmark monuments near each reservoir
to serve as ground truth, most of the LIDAR elevations per pixel are within an average of 64 cm of the
benchmark elevations. (Figure 6). Since these benchmarks
represent far too small of a sample to produce statistically significant results, we are
relying on the QA/QC statements of the vendor, which indicate that the accuracy of the
data are within 15 cm RMSE vertical and 1 m RMSE horizontal (EagleScan, 2000). These particular LIDAR elevations, however,
may not be within the vendor-stated 15 cm accuracy due to difficulties in getting good returns to the sensor on roads
and bridges, where most of these monuments are located.
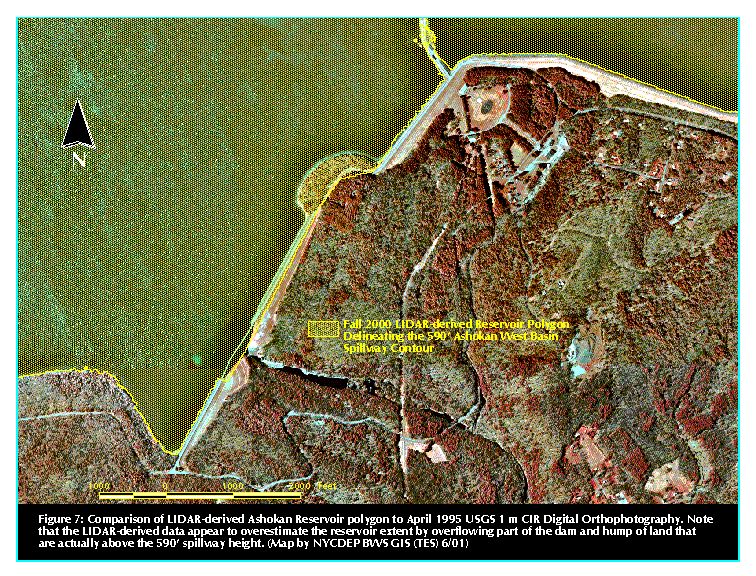
The Ashokan Reservoir data, however, present another problem in that they appear to underestimate the elevations
by an average of 14 m in some areas, causing the
LIDAR-derived reservoir polygon to cover a greater area than it should (Figure 7). The problems with the Ashokan
Reservoir data may be attributed to an older laser within the DATIS sensor being used in that collection,
which would send out fewer pulses as it wears with age.
We are currently working with the vendor to investigate this discrepancy to hopefully obtain
improved results for Ashokan.
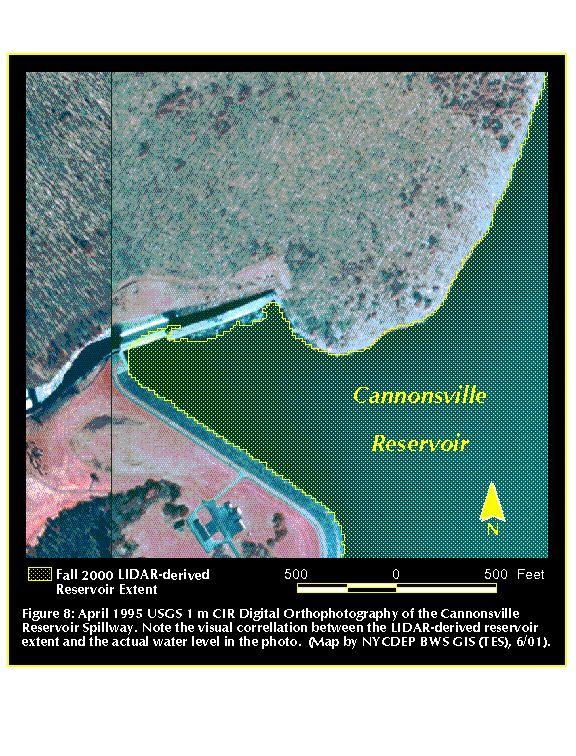
In all other reservoirs, visual inspection of the LIDAR-derived reservoir polygon boundaries relative to
1 m resolution USGS CIR Digital Orthophotography (DOQQs) show a good fit between data sources. Since these
particular DOQQs were flown in April of 1995, reservoir levels were relatively high and are a good
indicator of the area covered by water when the reservoirs are full and "spilling" over their
dams (Figure 8).
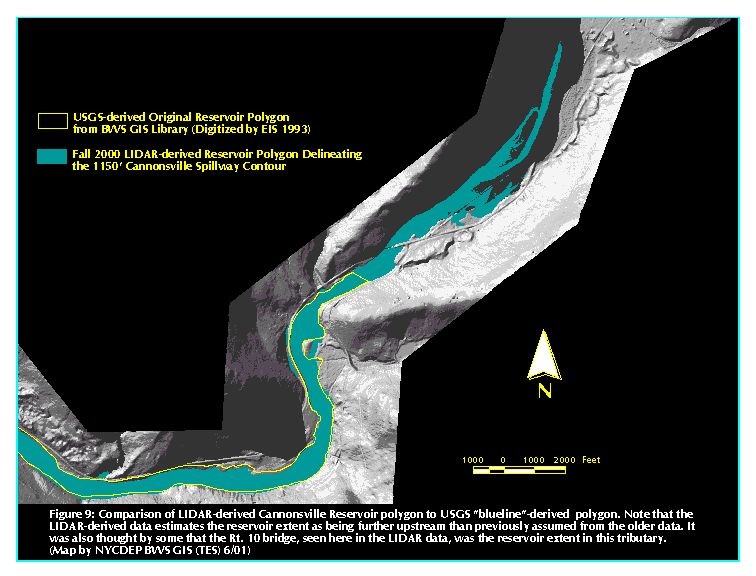
In the majority of the tributaries, the
LIDAR-derived reservoir polygons indicate that the previous DEP reservoir data source derived from USGS "blue-lines"
underestimated the upstream extent of the reservoir spillway elevation
contour (Figure 9).
In addition, the LIDAR-derived polygons did not extend as far
upstream as the reservoir polygons derived from 30 m DEMs, which is good news for
Prattsville (Figure 10).
Summary
These preliminary data have been received enthusiastically by researchers and planners in need
of better maps of reservoir extent for screening purposes, such as prioritization of parcels for
Land Acquisition or septic systems to be rehabilitated. The LIDAR data have served their primary purpose
to provide an alternative to costly ground surveys in reservoir tributaries to determine the
spillway elevation contour. It should be emphasized that the LIDAR-derived reservoir delineations are to be used
as a guide and are not a substitute for on-site surveys should a legal
regulatory issue come into question. In addition, the LIDAR data provide a 3-dimensional
surface useful for other applications in the stewardship of the City-owned reservoir buffer lands, such as
visualization of difficult-to-reach terrain where various land management plans must be implemented.
This project is ongoing with the delivery of LIDAR data for the East-of-Hudson reservoirs continues, as well
as with closer
examination of possible errors in the Ashokan Reservoir data. Experimentation with different
processing techniques is also underway. Optimum surface generation and interpolation techniques, such as
Spline, Trend, Kriging, or Inverse Distance Weighting, require further study to convert the irregularly
spaced LIDAR point observations to a regular continuous DEM. Future studies also include analysis of raw
LIDAR data without tree removal vs. the "bald earth" data to possibly derive timber stand characteristics.
Acknowledgments
We wish to thank Howard Pike of the NYSDEC Division of Water for allowing us to include the
reservoir LIDAR data collection in with other NYSDEC-supported LIDAR collection efforts.
We also wish to thank George Washburn of PGSC and Rob Eadie of EagleScan for managing the
post-flight processing and QA/QC of this data.
References
Bader, A. 1999. Limnologist: New York City Department of Environmental
Protection. Personal communication.
EagleScan Remote Sensing, Inc. 2000. Digital Airborne Topographic Imaging System General Description.
Technical Document. Bolder, CO.
New York City Department of Environmental Protection. 2001. Fact Sheet about the New
York City Water Supply System. Government Document. Corona, New York.
New York City Department of Environmental Protection. 1997. Rules and Regulations for the
Protection from Contamination, Degradation and Pollution of the New York City Water Supply
and its Sources. Government Document # 10 NYCRR Part 128, 15 RCNY Chapter 18. Corona, New York: p. 16.
Author Information
Therese E. Spies
(spiest@water.dep.nyc.ny.us)
Dominique J. Thongs
(djt@catgis.dep.nyc.ny.us)
Jonathan R. Tuscanes
(tuscanesj@water.dep.nyc.ny.us)
Barbara J. Dibeler
(barbara@catgis.dep.nyc.ny.us)
City of New York
Department of Environmental Protection
Bureau of Water Supply
71 Smith Ave.
Kingston, NY, USA