Author: Barbara Gole Quinn and Richard K. Allen
Cincinnati Area Geographic Information System (CAGIS)
The Cincinnati Area GIS is a consortium of city, county, local utilities, and other local governments that has been successfully implementing GIS along with organizational changes to improve and coordinate service delivery and decision support across all the various businesses of its participants. Esri-based GIS, along with other integrated systems, is now employed by more than 1,500 users in direct, mission-critical support of their business processes.
This paper will discuss how organizational change is being achieved, the role of the Esri-based GIS in enabling that change, and how entire interagency business processes are being redesigned as technology is implemented. This will be a paper for those who want to improve their organizations on a massive scale and for those who wonder how you get buy in, and get folks to work together with, agencies not used to communicating or cooperating at any scale.
The Cincinnati Geographic Information System(CAGIS)today serves 1000+ employees of the City of Cincinnati, Hamilton County, and CINERGY. CAGIS Cincinnati participants are; City Planning, Transportation and Engineering, Buildings and Inspections, Metropolitan Sewer District, Water Works, Economic Development, Mayor's Office, Cincinnati Public Schools, Council Clerk's Office, City Fire Department, City 911, Office of Environmental Management, Health Department and City Real Estate. Hamilton County participants are; Regional Planning, Building Inspections, Hamilton County Engineer's Office, Hamilton County Auditor's Office, Hamilton County General Health District, Emergency Response, Parks, Hamilton County Communications (911), Department of Environmental Services, Sheriff and Township Fire. The private utilities of CINERGY and Cincinnati Bell are also served.
Other Cities and Townships within Hamilton County have also joined CAGIS. These are Delhi and Springfield Townships and the cities of Indian Hill and Forest Park. Other community users include builders, architects and developers, the business community such as Proctor and Gamble and the Chamber of Commerce, area universities and schools, and the walk-public of which there are 20-30 a day.
Funding for the consortium is allocated as follows: 42.5% to the City of Cincinnati, 42.5% to Hamilton County, 10% to CINERGY and 5% to Cincinnati Bell. Each new City, Township, and Village participant adds $10,000 or less depending on type of membership.
CAGIS began as a regional consortium to share the cost of an automated mapping project in 1986 as recommended by the infrastructure committee, the Smale Commission. Initial data conversion was completed in 1993.In the beginning there was novision beyond that of creating a shared map. System applications were limited to making and printing maps.There were no plans or strategies for maintaining the GIS resources.Most importantly, there were no recorded benefits. Originally a Synercom site, the first migration to the Esri technology occurred in 1994. There were 25 workstation users in 1995. Most importantly there was a $12million dollar map providing capabilities for a privileged few GIS users. Many top managers began to doubt the potential of GIS to deliver promised benefits. CAGIS was beginning to drown and dropping the system was discussed.
In 1993 CAGIS held visioning sessions to reassess the Consortium's mission. From this series of visioning sessions, important changes occurred; first that the Consortium was building something that was more than a map and secondly that the implementation approach needed to encompass more than a technical vision. The vision provided from the top was stated by the City Manager, John Shirey, When I point to a location out there I want to know everything that we are doing there and everything we have done. David Krings, County Administrator, stated that I want a technology that ensures that no one drops the ball. I want my departments to coordinate their behaviors. The vision required that all local government agencies share information and communicate to coordinate activities and service delivery. No department could be an island.
Visit Hamilton County or City of Cincinnati local government offices today and you will find GIS on the counter for City Building permits. GIS on the counter in Rural Zoning and City Zoning, enterprise address management in Regional Planning and Cincinnati Department of Transportation and Engineering. GIS is used by 911 for emergency service management, GIS on desks in Engineering, the Collection Division, Industrial Waste and Accounting at the Metropolitan Sewer District and GIS on the desks in Customer Service, Engineering, Distribution, etc at Cincinnati Water Works, etc., etc, etc. Seldom is it GIS alone though. CAGIS is now a system of technologies supporting the employees in each of these areas with both GIS and workflow technologies working in concert to support the entirety of an employee’s work tasks. CAGIS has expanded its vision statement to include the mantra that an enterprise information system must deliver the data employees need, when it is needed, where it is needed, in the form needed with the quality and accuracy needed for any purpose. There must be instant data accessibility from the desktop, customer counter, field, home, board and committee rooms and the software must be push button easy or it won’t be used. These goals translate to technology that includes application and data integration, data and application standards, everyone must be connected and everyone must be connected and everyone must share and this all must happen in real time. CAGIS is a region wide consortium that now covers virtually all city and Hamilton county agencies, local utilities and other cities. There are over 1,100 networked CAGIS system users with 1,500-2,000 trained in multiple platforms and nearly 700 scheduled for training in 2000. GIS technology is now embedded into many workflows, GIS is now an integral component of permit and licensing operations, and has become the vehicle for integrating work order, customer service and billing systems. CAGIS technology is now used by counter service, dispatch and field crews in many agencies.
CAGIS wanted consistent communication from the top of the enterprise to the front counter on what the system was supposed to provide to the organization and how the system would support the organization in improving its performance. The starting place was an assessment of how well the existing paper and pc standalone computer systems supported the various workflows. The focus was on the workflows that impacted map maintenance; permitting, capital projects, and complaint/work order processes. Group sessions involving process participants drawn from all involved departments and including directors, mid level management and front-line staff were held over a period of two years assessing the subdivision and parcel build out (building permit) processes. Participation was initially guaranteed by the high profile nature of the project. On-going participation was guaranteed by staff knowledge of the problems each department encountered so that CAGIS became the workflow resource serving the enterprise, City and County combined.
There was a need for strategies for managing the four risks of change: i.e. the risk that communication about the project would not be consistent; the risk that there could be a poor history on behalf of those implementing the change with the staff who would have to change the risk that the staff would adopt the wrong approach in implementing the change to automation and the risk the technology would not be flexible enough to meet every need. In the case of CAGIS the strategy was to have a single point of contact for process analysis and project visioning. CAGIS had to assure a consistency of communication about the project and the process being followed, the point person for CAGIS was new and had no history with the organization. Moreover a new credibility of service for the GIS staff in the area of process understanding was created that was much broader than the mapping component from which the GIS staffing had originally been drawn. Broadening the background of the staff to include change, utility and financial management skills added to the credibility required to undertake an enterprise-wide implementation. Finally, the CAGIS staff enhanced and emphasized its service and customer support orientation bolstered with a respect for the individual. Creating a database was one thing, impacting how hundreds of computer illiterate personnel were to perform their jobs with technology takes a special appreciation and respect for the person being asked to change. The procedure being used to implement changed processes had to consistently and honestly reflect that the control of the process had to remain with the employee. The CAGIS role was as a knowledgeable and empathetic technology consultant whose job it was to ease the path to improved organizational performance. While the goals of the change could be dictated by the organization as a whole the details of the change were to be firmly in the hands of those who had to do the changing. The fourth risk involved technology. CAGIS had to be able to produce technology that met and/or exceeded every change hurdle presented by those resisting change. What has developed is a customized interface for each role, each department. Between roles there are large differences as befitting the different tasks of front counter, engineering, etc. Similar tasks across departments may differ only in the language used by the process. Because of budget constraints all of the development and support has been constrained to twelve staff positions supporting the universe of users. The need for a small highly proficient staff has supported departmental versus centralized control of many support functions and automation of many CAGIS centralized support processes such as data and software updates. Technology and organizational skills have partnered to create real change.
The change process began with the recognition that there had to be a problem worthy of the expense of desktop deployment of technology. CAGIS focused on the organization’s mission of customer service and on its own initiative began to collect information on problems staff had in delivering service and why. When there was a customer call for better government service, CAGIS was ready with the process problem documentation it had collected. The documentation was enough to create enterprise projects in both the City and the County. Cross department committees were formed to develop the work program for the project.
The CAGIS staff person interviewed the individual staff performing the work in each of the involved departments, charted the workflow and then presented the information to the multi department committees for their reviews on the effectiveness of the current process. If the City and County did not know where they were how were they to know what it would take to meet their service goals. Process effectiveness was defined using re-engineering standards such as reviewing work around results, not tasks. For example the development process was viewed from the standpoint of time to process, how effective the process was in responding to flawed designs and unusual development requests (what happened to customer service when things went wrong in any way, how accurate the process was in getting new development not only constructed but onto utility and property billing and to infrastructure maintenance tracking, etc., etc. Processes were broken into results areas such as process management, construction of water infrastructure, construction of sewer infrastructure, construction of roads. Those elements of the application acceptance process able to be centralized and shared were identified such as address verification, and project description. Because local government represents six or more unique businesses we could not achieve single project review (it was a human impossibility to have a single person knowledgeable of every infrastructure and its current condition, etc.), however we could achieve single point of contact for plan submission, automate plan dissemination and move plan review from sequential to parallel across the various departments.
The goal was consensus that there were opportunities for improvement in the current workflows and that technology offered the solution for better organizational performance and customer service. These changes were written and voted upon and the consensus on the broad approach has held over the five plus years it has taken for implementation. The goal was consistent communication about technology implementation and that consensus has stood us in good stead as our knowledge of the inter-relatedness of enterprise workflows has increased and encounters with change resistance has tested our technical abilities to produce technology that is push button easy. Presented below is a summary listing of the eight general types of information problems encountered across all departments.
Employees often had problems accessing information about the infrastructures their departments were paid to manage. For example at the Metropolitan Sewer District (MSD) there were four separate databases purporting to represent the sewer system but all of which had conflicting data. To gain an accurate picture of facility location an employee could search up to fourteen separate sets of paper records consuming several hours in the process. The current system allows all MSD Divisions access to location and system performance data through the GIS. The sewer front counter and engineering sections now can locate the sewer to which a tap is being made and can identify if adding a new customer will exacerbate existing combined sewer overflows, sewer system overflows, department lining projects, water in basement complaints, etc in less than one minute. A saving per service request of forty-five minutes to several days is being experienced.
There was an inability for sewer, water and highway engineers to view the work activities of related maintenance areas. While engineering bears the responsibility for system design and performance overall, engineering in water, wastewater and roads could not view the repair efforts, number of mobilizations, etc. easily for capital projects planning. In the alternative, the maintenance area in sewers had been known to connect customers into the sewer system without notice to tap records and the addition of new development was often permitted in ignorance of the performance problems that would be exacerbated downstream. When the agencies strove to take all of these issues into consideration weeks to months were lost as data was recreated for one-time evaluations. In sewers the lack of access to land use plans in comparison with design calculations, resulted in lift stations performing a total re-assessment of land use (using windshield surveys because of lack of knowledge of and access to data from the Planning Departments) in comparison to the stations design parameters.
Process customers were frequently the communication bridge between departments because the old paper system did not allow the departments to review all of the actions in the process department or division in comparison with one another but only as sequentially.. The customer was required to perform the comparison, often between ten or more review sets, to arrive at an overall determination of what the developer was being requested of the developer to fit into the communities built environment. The workflow system allows the reviewer to move seamlessly between screens where critical dates are noted, to the GIS where scanned drawings may be imported enabling the employee to view the applicant’s request in comparison with the existing infrastructure. The employee may move to the document management system and with the touch of the a button move to the redlining application where he can post his redline corrections to the proposed plans and view his recommendations in concert with those of his peers in other departments. The software allows the applicant to receive one integrated set of city/county agency review comments as well as individual utility sheet breakouts. The CAGIS solution for each infrastructure has been to use the GIS as the window to identify both the built environment and, by integration with the workflow and other softwares, the transactions that are in the status of applied, issued, in transition, etc. that could impact a construction area or proposed development project.
The GIS software holds the built environment and is a window through which information about transactions pending in the area and their status may be accessed to identify conflicts.
Department records enterprise wide were inconsistent and often incorrect. These imperfections became more obvious the more the data was used. Correcting data, both the users own department information, and data from other departments required special communication tools to be added to the software. An example of a collaborate tool developed by MAGIC is included below. A point is placed at the problem location. The users name is loaded to a shared workspace on the server as he/she telephones the owner of the data to request a correction in data. The data owner answering the call selects the binoculars tool displaying a box with the names of users who have loaded data to the collaborate workspace. Selecting the callers name, the data owner is zoomed to the location on the map being referenced by the caller and they both may discuss the problem now looking at the same data.
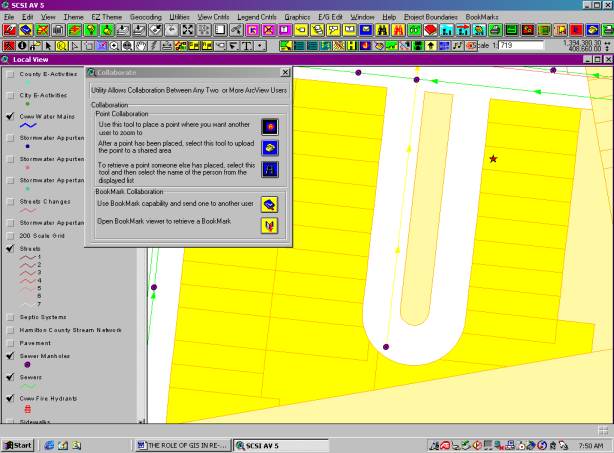
Another tool allows the user to label problems, comment, etc and bookmark his/her screen, saving the data and all of data relationships for work later on their own drive, to a department server for sharing with co-workers to enterprise servers for cross-department collaboration.
There was duplication in logging transactions which was able to be resolved through the use of the data entered one time at the source features of the workflow software, Accela's Permits Plus*. Use of the "copy down" feature allows key common data to be copied between different but linked workflows.
Logging of data problems are most prevalent in the who, what, when, where key index areas common to all transactions. In the subdivision process alone it was documented that the applicant’s name, title of project, location and type of project were entered redundantly over fifty times throughout the enterprise as the project was processed. However the problems are not restricted to index data. What CAGIS has termed a failed information handoff appears frequently whenever processing moves from one section of a department to another or from one department to another. An example of the problem occurred in the easement acquisition workflows at the Metropolitan Sewer District. Hours to days were lost in trying to match construction and easement plat drawing numbers created by design engineering (termed accession numbers) to the parcels on which easements were to be acquired. Designs were created in AutoCad with no linkage to the underlying parcels, assigned sheet number and those numbers were entered into an excel spreadsheet log associated with a project number. The designs were transferred in paper at a 50 or 100 scale, the easements also transferred in paper but at a 20 scale. Parcel data stored in the GIS is computerized. Real Estate could see the parcels in the GIS however the human was the bridge joining the three project views together to provide the linkage between the design document number and the parcel number components required to record an easement acquisition on a property. The technology solution was to scan the engineering designs with the drawing accession numbers into the GIS and allow the software to correct the scale differences. GIS technology then provided a tool allowing the user to select the parcels involved in the project onto a form accompanied by the range of accession drawing numbers used in the sewer design. The user can point, drag and drop the accession number next to the related parcel number. Automated task time one to ten minutes depending upon the size of the project. The data coordination task performed using paper documents mixed with computer data consumed four hours to one week depending upon the size of the project and was a task performed by default by the real estate staff. Because the task time was long and the design staff vastly outnumbered the real estate staff the real estate acquisition process impact was exacerbated. The new shorter process is now the responsibility of design engineering as part of the tasks to ready the design for further processing.
Routing designs for review by the various infrastructure agencies is a component of the enterprise processes of development, parcel buildout, and street opening/realignment. Many routing inaccuracies stem from the inability of the front counter intake staff to determine which areas of the county are served by the various water and sewer utilities, which city properties are historic or part of a particular zoning district. The GIS now performs a spatial proximity analysis to compare the transaction address with the location of infrastructure and zones, accurately identifying the departments who should receive notice of the request.
Routing processes in the paper world were sequential and dependent upon interoffice mail. Document imaging has been integrated with the transaction processing software, redlining software and the GIS to enable the routing process to become parallel and to improve the coordination of redline/plan review comment information being provided the customer. Software was developed allowing the permit, complaint or capital project number to be entered which pulled the address/parcel ranges, applicant name, applicant role such as engineer, developer, or project manager, and project description which were previously entered into the transaction tracking system and transferring that same index data to the document index. In parallel e-mails and/ work calendar assignments are created by the software. The e-mails or work calendar assignments notify the involved reviewers from the various agencies that a drawing or revision is available for their review. Selecting either the project and clicking an image button or going to the map and querying the GIS for all documents in an area will retrieve the document for the reviewer and allow him/her to go access the drawing and begin review. Time involved in the paper world to prepare copies of drawings for routng, transfer a drawing an make it available for review averaged one hours to days or weeks depending upon the size of the project, inter- office mail schedule and the distance between offices. Some offices had once a week mail service between them. Time for the entire automated process to scan each drawing page submitted in a paper format is less than one minute, less than ten minutes to import entire digital submissions. Automated e-mails and/or calendar notifications are performed as automated system processes transparent to the user.
There were problems in scheduling reviews and inspections. In the paper world a secretary assigned the inspection area to a complaint or a permit. The computer automatically makes the linkage behind the scenes using the GIS to make the proximity linkage between the address and the inspection area. The GIS automatically assigns the permit/complaint to the proper inspection area and department for review. The workflow software's calendar feature allows scheduling for reviews and inspections and assignment when the review is linked to type of permit rather than area.
Many fees were complex and several were area dependent. For example, it was more expensive to block a street or sidewalk in the downtown business district than in other parts of the City. The GIS now assigns the requested area automatically to a fee district and the workflow software calculates the fee automatically. The workflow software tracks who has receipted funding noting the user log-in and improving accountability. The system allows fees to be summed across processes so the total revenue related to a project can be easily calculated in a few seconds, a process, which in the past, consumed hours.
Inspection area scheduling and load balancing was complex and difficult to track. Calculating installed quantities in capital project areas resulted in redundant logging of information and difficulty in achieving quick comparisons between the percentage of a job installed and the percent of dollars reimbursed. In high volume permit and code enforcement areas the paper system provided no way to quickly identify those properties that had not called for inspections and there were instances of system hookup and turn-on without inspection and without being added to the utility billing system.
At times inspection tasks on one agency’s facilities were delegated to another agency or construction processes demanded that inspections be conducted in a specific order. This is particularly prevalent in building departments. Identifying which inspections were eligible for scheduling based upon other inspections completed could not be reliably determined. Quality control information on the effectiveness of the inspection scheduling process in place such as active jobs without inspection during the last thirty days was not available without extraordinary effort of 4 hours to one week and then the data compiled was a snapshot only.
Paper plans were often delivered in scales different from those in which department facility records were maintained required the human to make time-consuming comparisons to ensure that the proposed infrastructure fit the existing system. The customer had to identify when agencies were issuing conflicting customer instructions. Each revision required a total re-review to verify that only the requested changes had been made and no others. This last problem area alone could add four to eight hours to the review process.
Inspection result data was hand entered in the field, re-entered by clerks in letters to builders. Plan reviewers noted comments on drawings, again in project files and again in letters sent engineers. Data entered as redline comments on drawings is now transferred to the workflow software where it may be edited and automatically inserted into documents printed from the system. Enforcing that the builder meet map accuracy standards in all drawing submissions and that field changes result in plan updates has ensured that the mapping area is not recreating the design again. The design changes move the initial documents to become the as-built draft with only slight additional changes required from survey.
The general conclusions drawn from the group analysis was that our PC and paper departmentally focused systems hampered and in some cases prevented us from acting as a coordinated service enterprise. Our focus became the improvement of customer service through the development of a coordinated organization. Improving our cross department, cross enterprise coordination demanded an information system that would support information sharing, communication and collaboration.
For example, parcel addresses are assigned during the development process but were often not available to the building departments at the start of the parcel build out phase. This resulted in multiple instances of employees in every section of the seven departments involved in review of the building permit researching the location of the parcel under discussion with hours of delay, and often error. Critical cross department errors occurred where the address on the building permit did not match the address on the water tap permit, for example. resulted in "out of sync" records for the same property. This was a primary contributor to the "silo" service approach where the customer called for information on his/her property and could not obtain a consistent response across departments. The analysis compared this inability to link service requests by address to the consistent customer number used by department stores. The consistent customer number enabled the store to provide information on customer transactions with the store instantly even though its individual departments sold products that differed dramatically as did the services provided by local government departments. The department store ability to access customer service information on transactions enterprise-wide became a service model for the project. When research into why the address was not available to the building permit process was conducted it was identified that the address was linked with the parcel in the paper workflow only at point of record plat. Contractors were allowed to proceed to parcel build out for an increasing number of model homes prior the filing of the record plat and the linking of the address with the parcel. The solution is enterprise GIS and the ability to track addresses by unique project name and lot number. This allows a business rule to be implemented that no service delivery is to be initiated in any department without the entry of the address. That in turn resulted in a massive multi-year project to add all addresses, official, posted, permit, post office, etc. into the GIS. Addresses are now selected from pick lists by intake personnel to avoid spelling errors, etc. The GIS plays the key role in address maintenance enabling the local government version of the "customer number used by department stores" that allows local government information to be sharable and usable, ie; the key to the easy sharing of information. It was the sharing of information that would spur communication between the departments about potential service conflicts and enable the improved coordination being sought.
Accompanying the automation of address assignment and maintenance was the development of geographic integration framework linking organization-wide spatial identifiers such as address and parcel id to census track and inspection area. An inventory of spatial identifiers was made and standards developed. Cross reference and translation tables were created identifying the key relationships of GIS features. Geocode aliases and source tracking was implemented. Primary keys and attributes of integrative features were inter-linked into a fabric of foreign keys managed by the GIS. The integration framework allowed department data with nothing in common other than it represented facilities occupying the same point on earth to become information.
Presented below are simplified charts of the four primary workflows; permitting, capital improvement tracking, complaint tracking for code enforcement, and complaint tracking for municipally owned facilities using work orders. These simplified charts are included to show the multi-department, divisional transactions what must successfully occur to accomplish a single service request. Each change in section, division, department and workflow juncture must be evaluated as to the effectiveness of the information exchange. For example, cross workflow coordination issues, such as the failure to consistently track new utility accounts that were linked to the parcel build out (building permit process) were identified. The failure to successfully link the two processes had cost the sewer department $2 million in lost revenue per year. In this case the integrated use of the GIS for addressing and the use of workflow software linking the certificate of occupancy release with a confirmation of account creation in utility billing were employed in tandem.
Other examples of workflow issues are the crossovers between the permit, complaint, work order and capital improvement workflows. All of these activities are conducted in the right-of-way and must consider these other service workflows as potential sources of conflict. Again the integrated use of the GIS for addressing allows for the identification of work that could be in conflict. The use of the workflow software capabilities to link related permits with complaints, with capital projects accomplishes the linking of diverse but related projects that is missing in the paper world. The system allows the user to search the map for all types of transactions in an area and enables the sorting of those transactions by status and type. For example, street engineers are able to see construction conflicts presented by street opening permits and sewer and water work orders as they relate to in-house road repaving projects.
Presented below are charts demonstrating the primary process coordination points in the primary local government workflows.
The following chart demonstrates both the external and internal coordination points necessary to successfully accomplish the parcel build out process from the perspective of the sewer district.
Southwestern Ohio has a two hundred year history of municipal government and a community-wide distaste for change. The cure for each of these issues is more talking and visualization of change to allow the human a longer time to adjust. But change is not easy and highlights of some of the group and individual responses to the change process have been encountered.
Loss of status this category of change resistance occurs with senior staff used to a servant class of engineering techs or clerical personnel. These staff are assigned the largest development and capital project construction. The technology design for this type of staff and project embeds the workflow in the system. The computer recognizes the employee and the next task to be done on a project and queries the staff person if that is what he/she wishes to do then either enters a date or switches the employee to the application needed such as the GIS, GANTT chart, etc. The system interface was changed to allow instant insight into the status of groups of projects helping the employee to instantly identify the next task to be performed without review of all of his/her project folders. Integration of project tracking with the GIS for facility information and accounting software for exact financial updates were identified as benefits to the individual user.
One of the most difficult implementations was in an organization with a very poor history of management control and team work. Historical lack of trust in management, a mixed history of management versus employee control of the workflow and resistance to being made accountable for work and its progress was encountered. Across ten departments this user response was encountered in employee unit of one division of one of those departments. The implementation of workflow tracking and improved communication of data made project research time known and the status and length of time that work has remained at any one stage apparent to all. The target implementation group had a long history of weak divisional management and uneven production in the work group with a few employees doing all of the work Any employee complaint about design was addressed and satisfied including a change in system access interface from that provided by the vendor to one which matched the spreadsheet design the group preferred. The change in interface creates an instant insight on all projects throughout the organization in a spread sheet form displaying and sorting on the project, project manager, status, last task performed, date performed and next project task in the project workflow. Highlighting a project and clicking reveals the detailed tracking screens for that project. One on one training was provided. One of the first accountability issues which arose was that peers would change dates on an individual’s project therefore he/she could not be held accountable. The security design made each employee his/her own division. The benefits of the management information system were identified department wide, and a small group splintered off that begin enthusiastically to use the software and management linked performance reviews to use of the system. All of these responses is showing a softening of employee resistance and the system use is on the rise.
Stress illness induced by change is a third impact. This symptom was encountered in a large inspection automation project using palmtops. Sixty-two inspectors were involved in one department with these types of complaints coming from five. The response was to provide additional training and a support partner to strengthen the development of new habits and aid the employee until the new habits required by the change were firmly in place and in some cases, changes in the types of type of field equipment were made i.e. if the employee wanted a machine with a larger screen he would be provided one and part of the testing to select the equipment.
Refusal to change by individuals in controlling roles has been encountered a few times. Sometimes the project implementation has waited until the employee retired or changed position. At times peer pressure has been brought to bear. At least thirty percent of these problems have been encountered with technical staff threatened by the change or unwilling to assist in providing the service to meet needs of staff employed in a secondary mission area of a department. These problems have occurred primarily in Health and Fire departments where the department’s primary mission is viewed as hospital management and/or emergency response both of which were mainframe based. The GIS related implementations in the departments’ inspection sections were blocked at every turn not by inspection units, but by peripheral department personnel. The response has been to secure funding from an enterprise level, provide technical support solutions reducing or eliminating dependence on local staff through Citrix servers technically separating the group from the departments primary technical providers. In at least one case, the affected unit partnered with another department who, in return for sharing a server, provided the system support for the server.
There is no perfect organization ready for change. Every group is different. The CAGIS approach has been to describe the organization as a family with some unusual aunt’s and uncles but where the family does all it can to assure its members’ needs are met using traditional and non-traditional means. The design is supportive and the results have been a wider appreciation of the efforts that must be made in the name of improving customer service city and county-wide. While CAGIS is providing leadership, every department at every level has contributed in some way to the transformation that is occurring.