Abstract: Watershed-wide management approaches to meeting water quality and quantity standards are evolving across the United States. Involving community members and stakeholders who live in a watershed can significantly help identify, prevent, and control sources of beneficial use impairment. A 3-dimensional (3-D) geographic information system (GIS) allows users to show models of alternative solutions to watershed problems. A 3-D display simulates spatial reality that allows the viewer to more quickly recognize and understand the topography.
This paper will present a 3-D model of a watershed. After the 3-D model was developed, fly-by-animations were created. The 3-D model and fly-by-animations were very effective in public presentation. The paper also outlines the computer-related technical issues encountered and overcome during the course of development of the model.
3-D GIS is a type of GIS in which all the features are represented in three dimension by adding a z-axis. A 3-D GIS can be effectively performed using the 3-D Analyst and Spatial Analyst extensions to the Arc View 3.x software.
Analyzing a 2-D contour map of a hilly terrain can be difficult and time consuming for those without the required background and knowledge. The use of 3-D display, which simulates spatial reality, allows viewers to quickly recognize and understand the physical conditions and spatial relations key to analyzing problems.
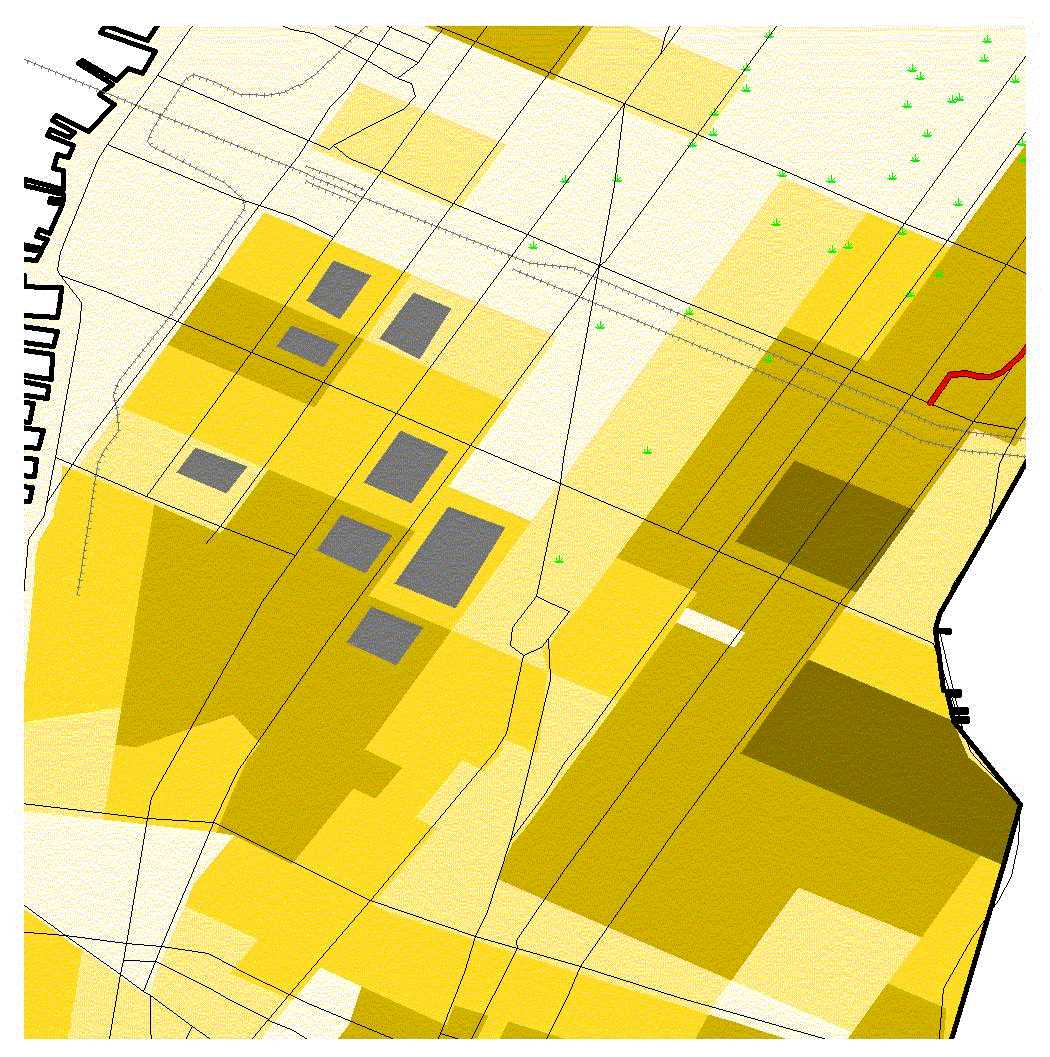
Figure 1: A typical 2-D map featuring eight buildings of different heights
3-D GIS can be used in many sectors and is particularly valuable in sectors demanding public involvement and/or participation. In this paper, the uses of 3-D GIS in the water resources sector and other fields are explored.
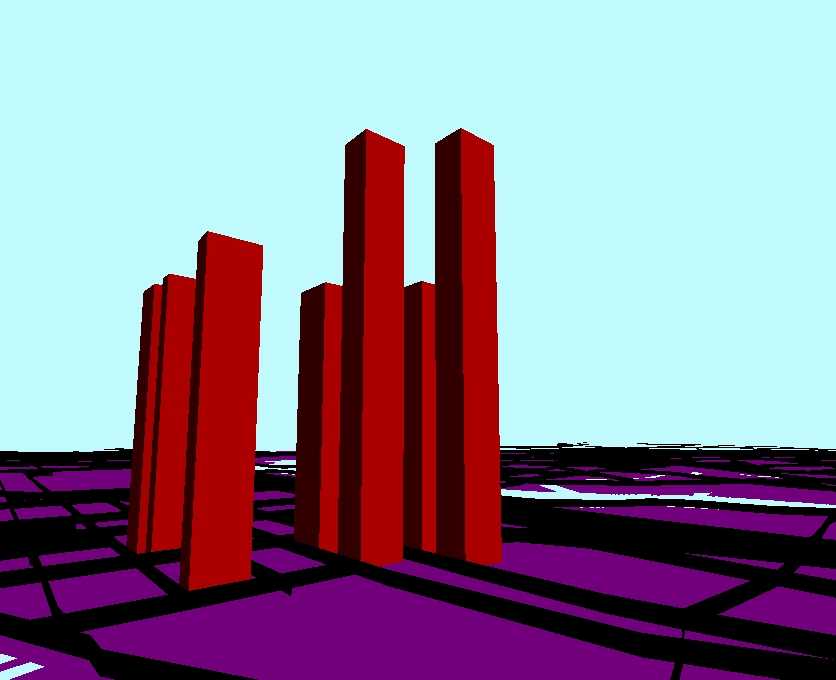
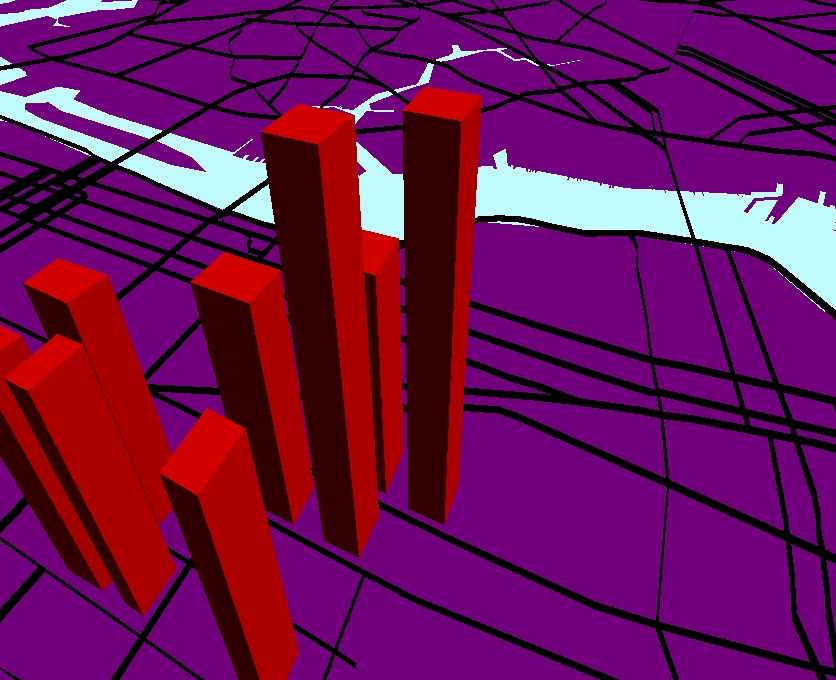
Figure 2 &3 : Figure 1 transformed into 3-D, making viewing easier and providing a clear perspective of each building’s relative height.
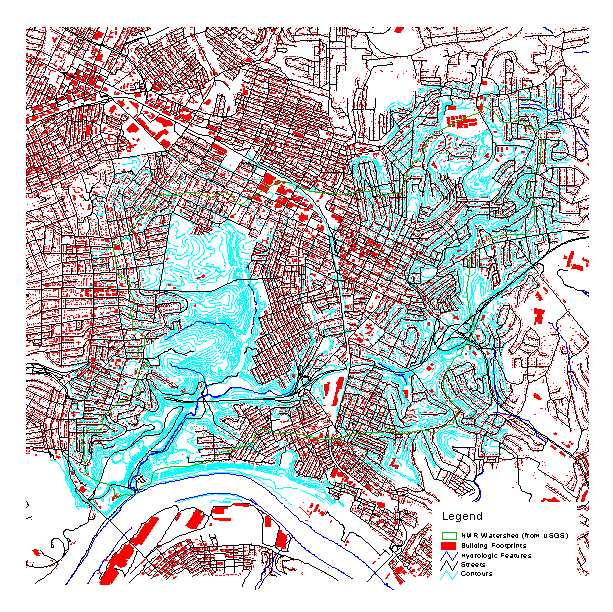
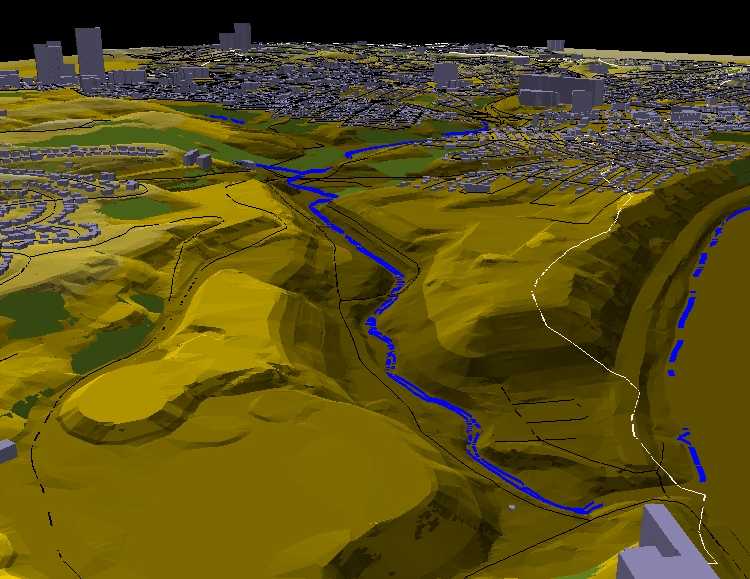
Figures 4 and 5: A typical map of the Nine Mile Run Watershed, and the same map transformed into 3-D, making viewing easier while providing a clear perspective of height of the buildings with respect to each other.
Most vector data used in a conventional GIS can be transformed into 3-D. The vertical elevation or the z-axis is obtained from the three sources. They are attribute value of the vector data, a constant value that can be input during the transformation into 3-D, and a surface that is usually a TIN (Triangular Irregular Network) or a GRID. Figure 6 shows the dialogue box that appears while converting the two dimensional data into 3-D.
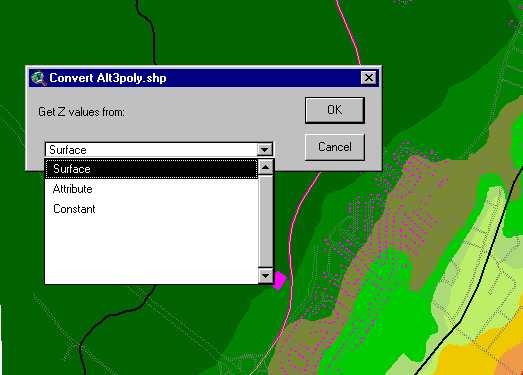
Figure 6: A dialogue box that appears while converting two-dimensional data into 3-D.
A TIN represents one or more geographic layers, usually at least a surface layer, where space is partitioned into a set of non-overlapping triangles. Attribute and geometry information is stored for the points, lines, and faces that comprise each triangle. This information is used for display, query, and analysis purposes.
Usually, points and lines with attribute elevation data can be easily converted into TINs. As demonstrated in Figure 8, lines and arcs with the least elevation interval produce smooth TINs that look more like the real surface topography. Figures 7 and 8 show the TIN created from the lines with elevation intervals of 10-feet and 2-feet, respectively.
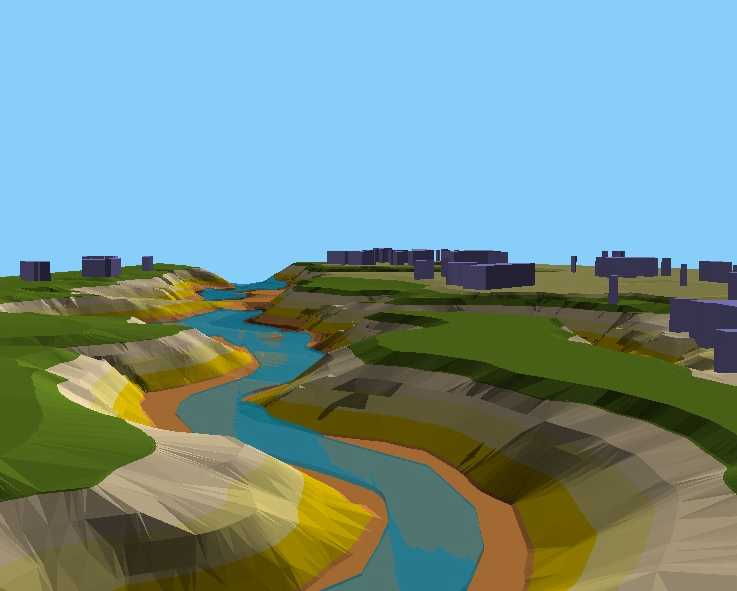
Figure 7: TIN created from lines with elevation difference of 10-feet. Angularity in the surface is evident on both banks of the featured stream.
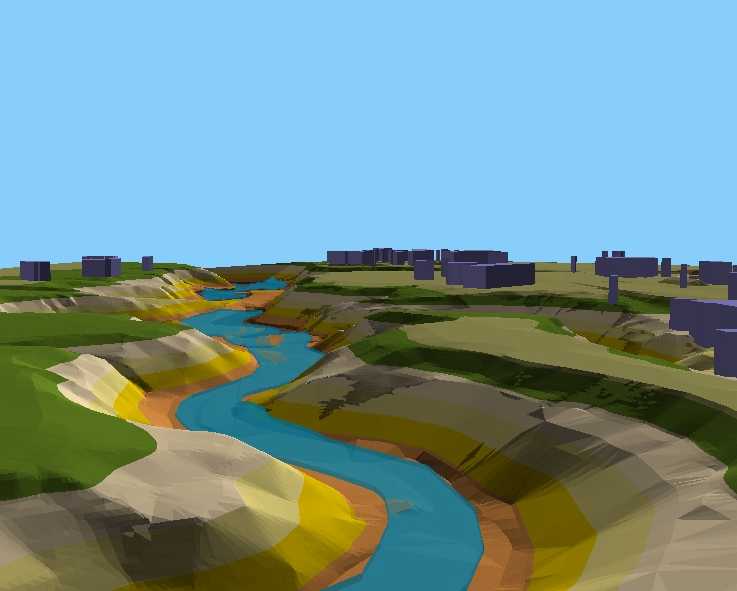
Figure 8: TIN created from lines with elevation difference of 2-ft. Banks of the stream appear smoother than the above and are closer to the real topographic surface.
Watershed management programs seek to prevent and control pollution that may have a detrimental effect on human health and/or the environment. 3-D GIS can be used to create real world models of a watershed that enable the public to understand the complex interactions within the watershed.
Such an approach was used in the Nine Mile Run watershed -- the largest undeveloped land in the city of Pittsburgh. The watershed is a hilly terrain with elevations ranging from 700 to 1,000 feet. The Monongahila River meets the Nine Mile Run stream at the southern end of the watershed. The watershed includes some residential developments and a large urban park. Extensive amounts of slag were dumped there during the period of 1925-1970, as a byproduct from steel manufacturing in the city. The Nine Mile Run stream is highly polluted and its aquatic habitat is being restored by the US Army Corps of Engineers, City of Pittsburgh Department of Planning, and the Allegheny County Sanitary Authority. The 3-D models in Figures 9, 10, and 11 were prepared for the public presentation of the Aquatic Habitat Restoration project and were used extensively by project engineers to explain the city’s various restoration alternatives and the watershed management aspects of the project.
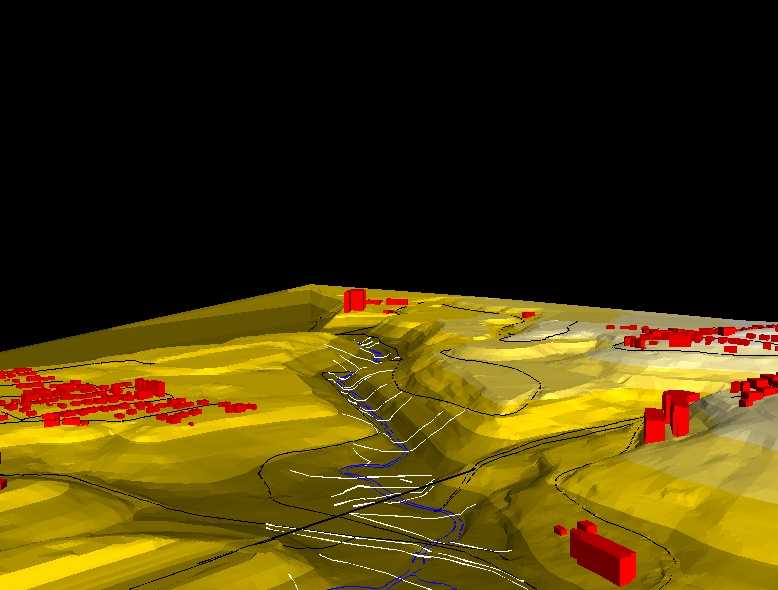
Figure 9: A bird’s eye view of the Nine Mile Run Watershed.
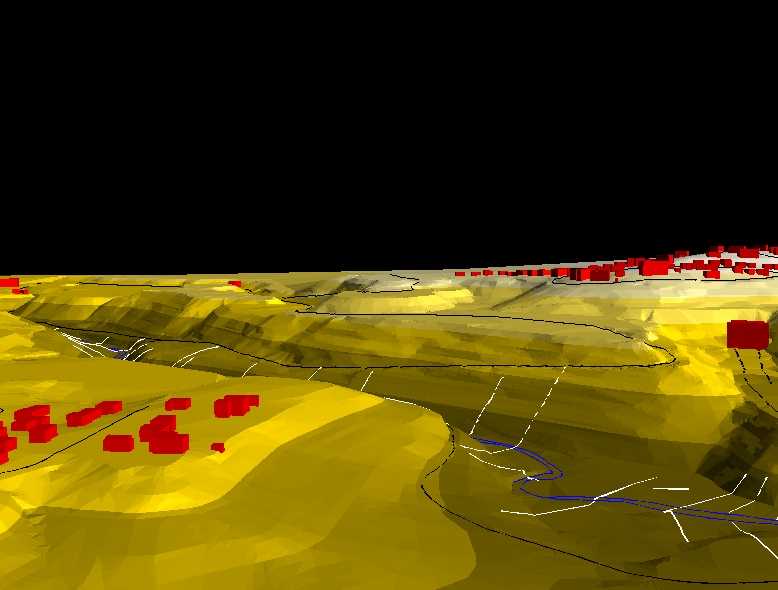
Figure 10: A closer view of the Nine Mile Run Watershed from low altitude.
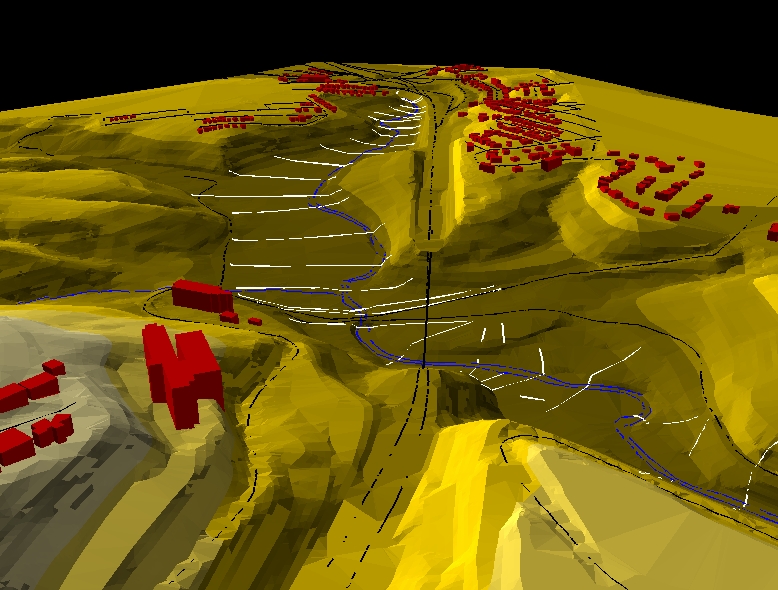
Figure 11: A bird’s eye view of the Nine Mile Run Watershed from low altitude.
While 3-D GIS has proven to be an invaluable tool in Watershed Management applications, the use of 3-D GIS is also growing rapidly in other fields such as Hazardous Waste Remediation/Investigation Projects, Environmental/Traffic Planning and Impact Analysis. The following narrative describes some of these applications:
As demonstrated in Figures 12 through 16, 3-D GIS can be used for visualization and volumetric analysis of underground contamination, 3-D representation of contamination at different depths, 3-D profile of monitoring wells etc.
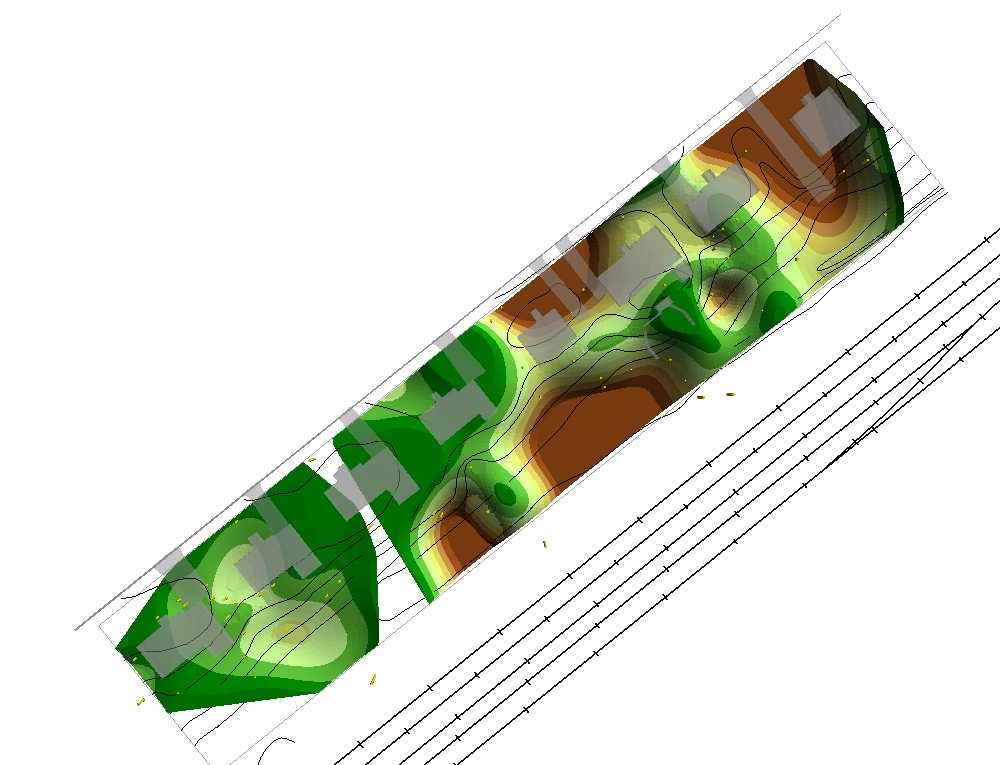
Figure 12: Plain view of a site with underground contamination.
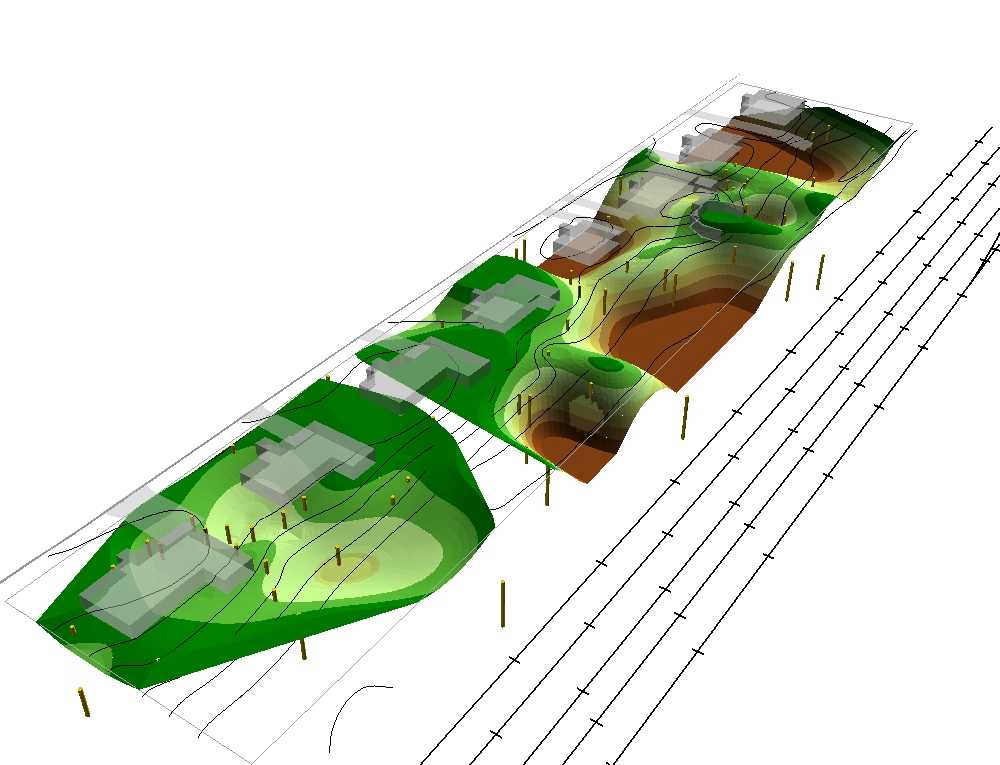
Figure 13: The same site in 3-D representation. The image gives clear perspective of contamination that varies with the depths and location.
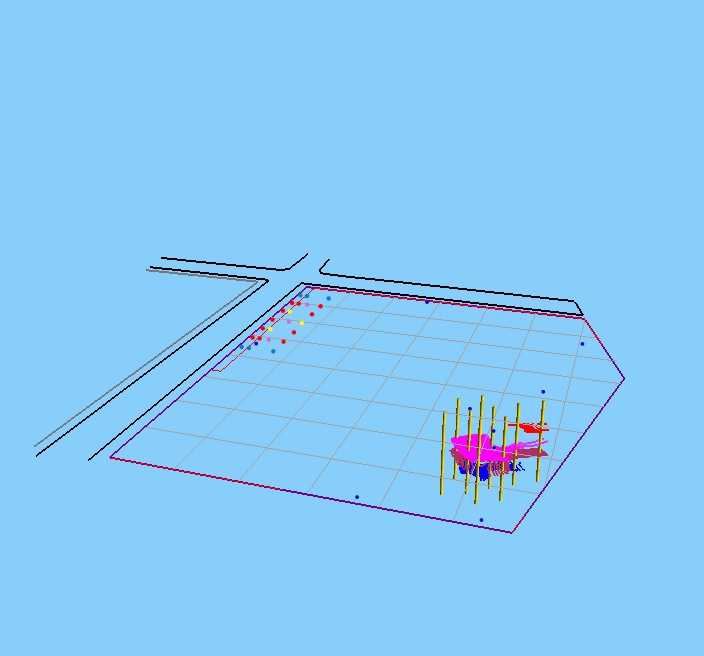
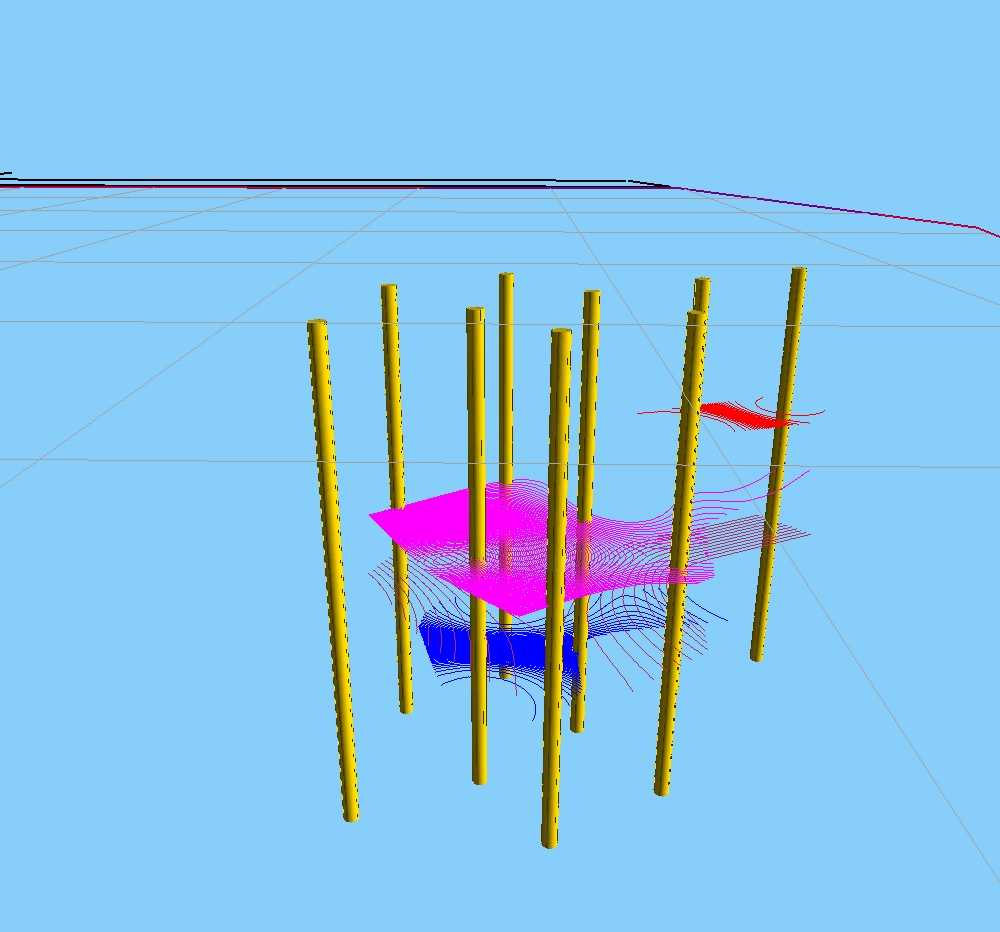
Figure 14 and 15: Underground contamination in 3-D representation, shown as contours at different depths.
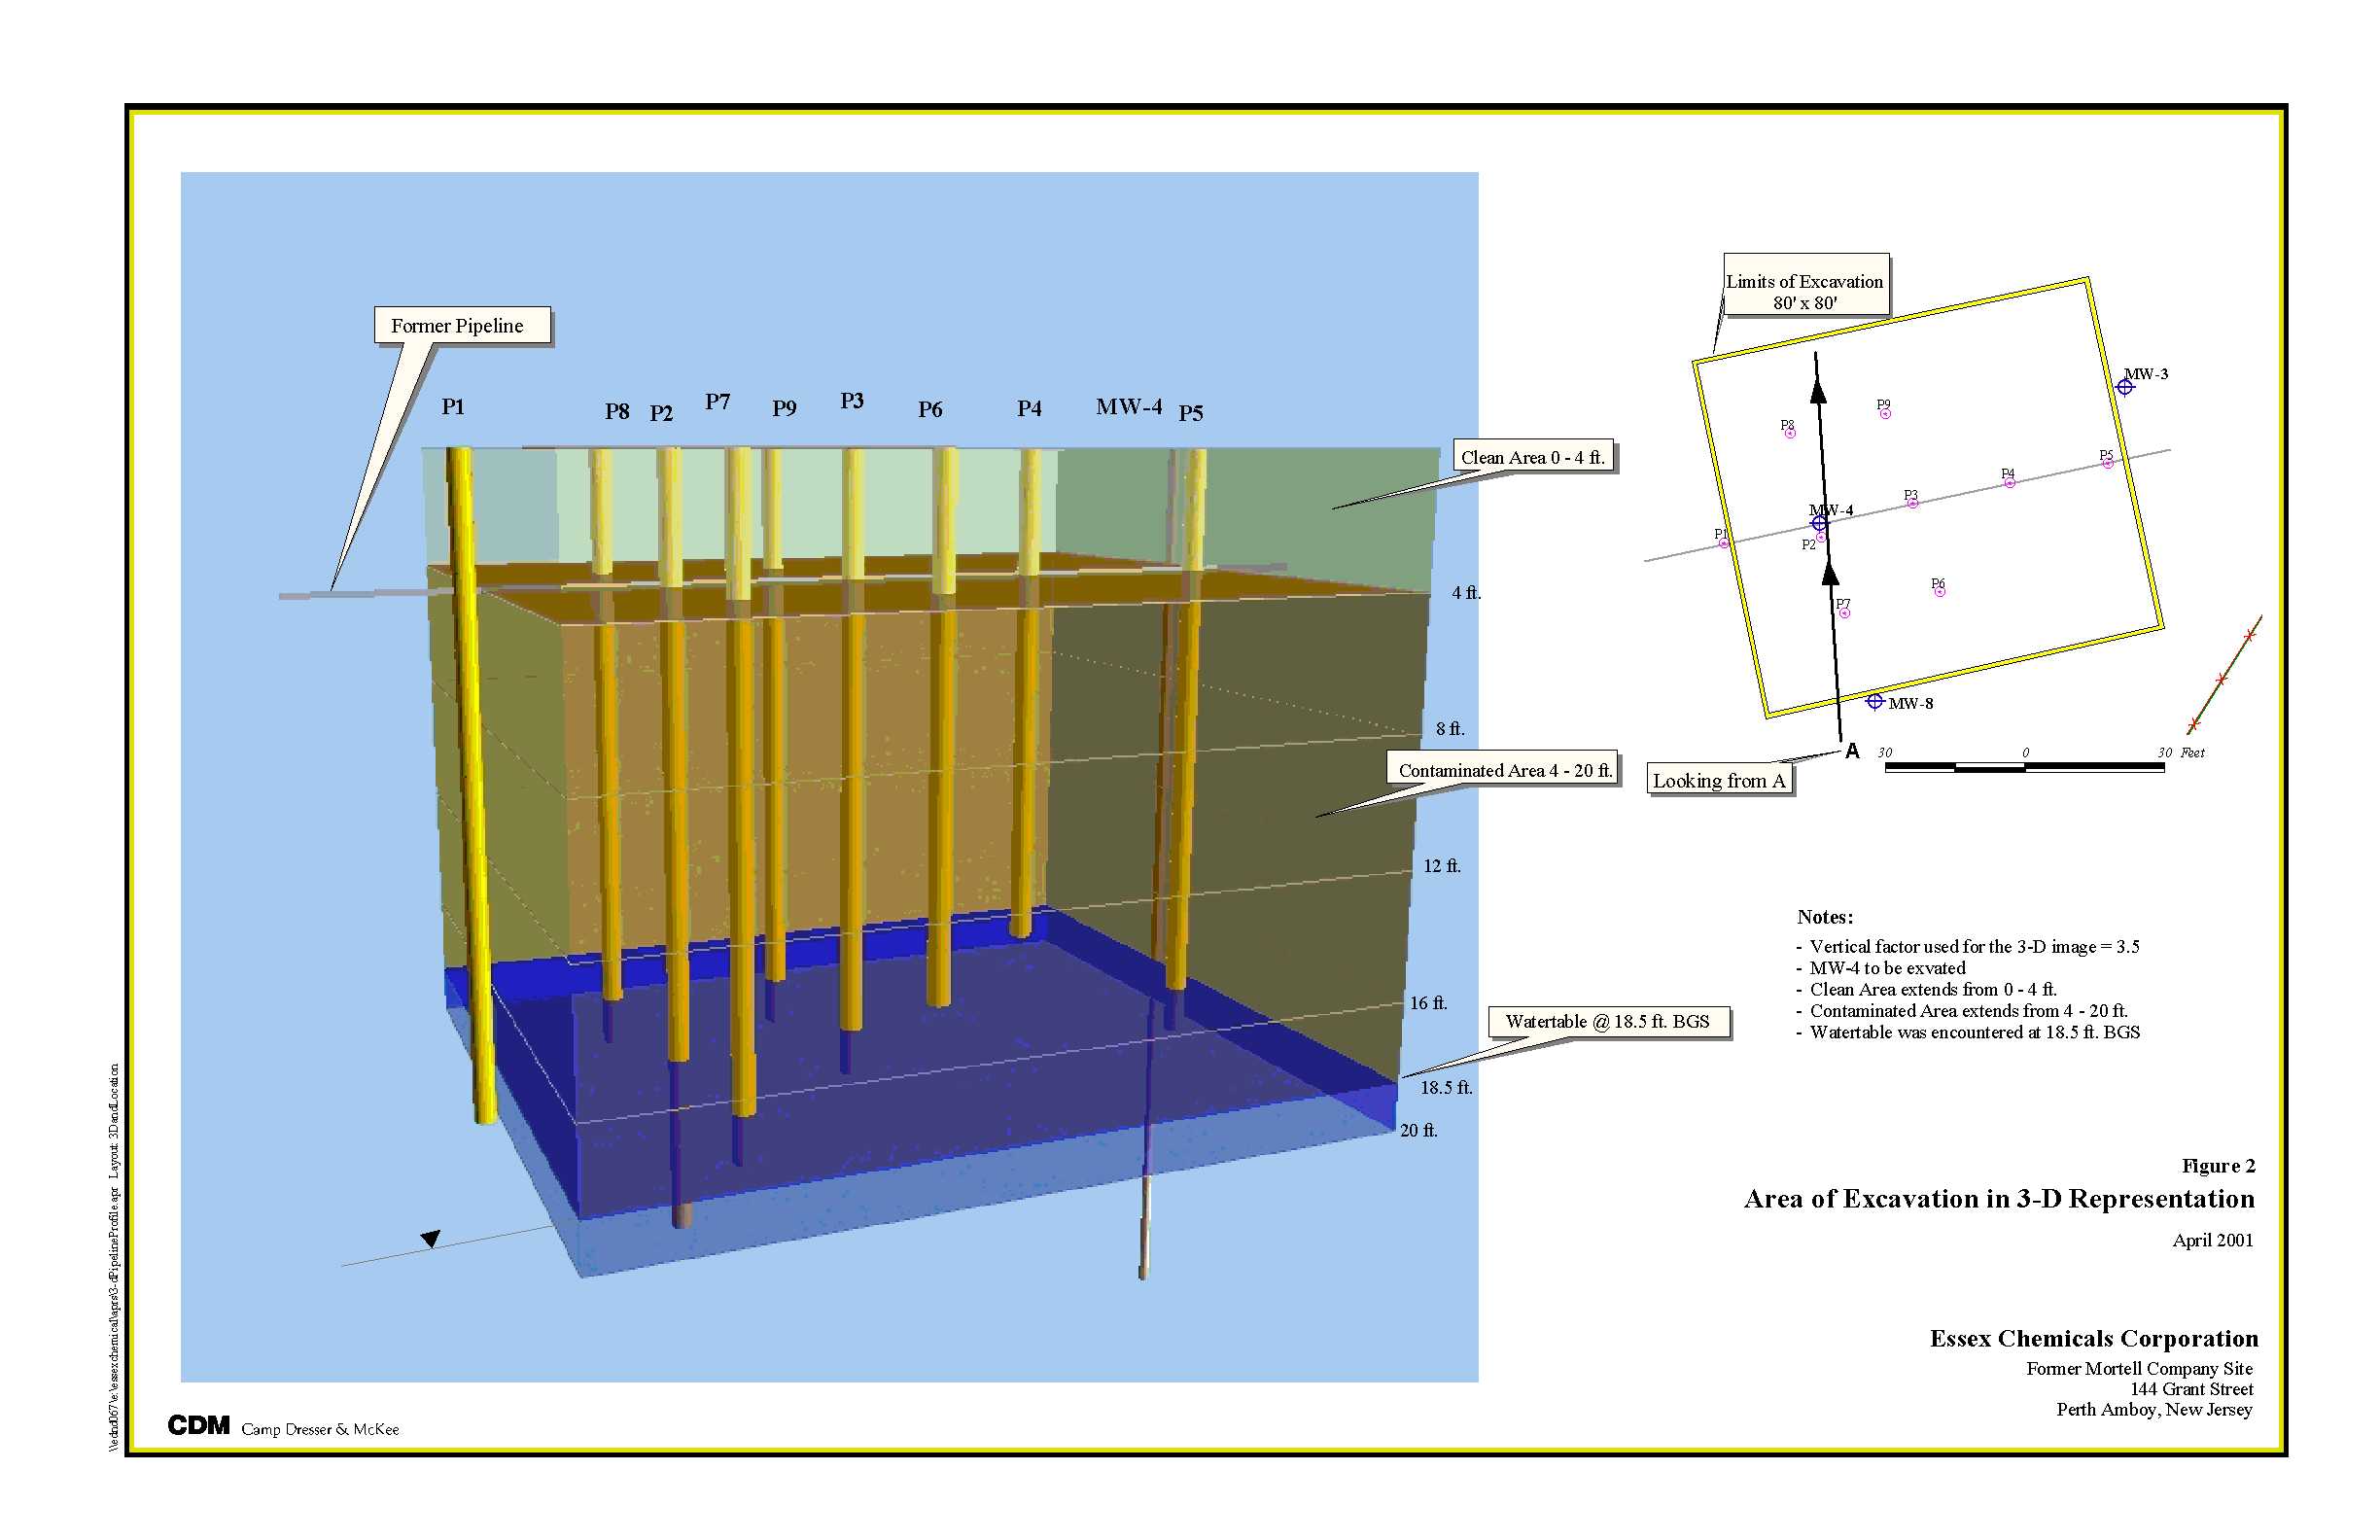
Figure 16: Area of Excavation in 3-D representation of the site shown in Figures 12 and 13. The image clearly distinguishes between the clean area, contaminated area, and the depth of water table. The figure was helpful in visualization and planning of remedial alternatives.
Figures 17-19 display a proposed alternative route (shown in green and yellow colors) currently under development that is to pass through a state park. The alternative route is an extension of a major highway and its construction is likely to affect the wild life in the park, in addition to some commercial and residential establishments located along the proposed route. Efforts are currently underway to develop an alternative route that minimally affects the surrounding environment while effectively solving traffic congestion problems in the area. The 3-D images will be used for the public presentation of the project and are still in the developmental stage.
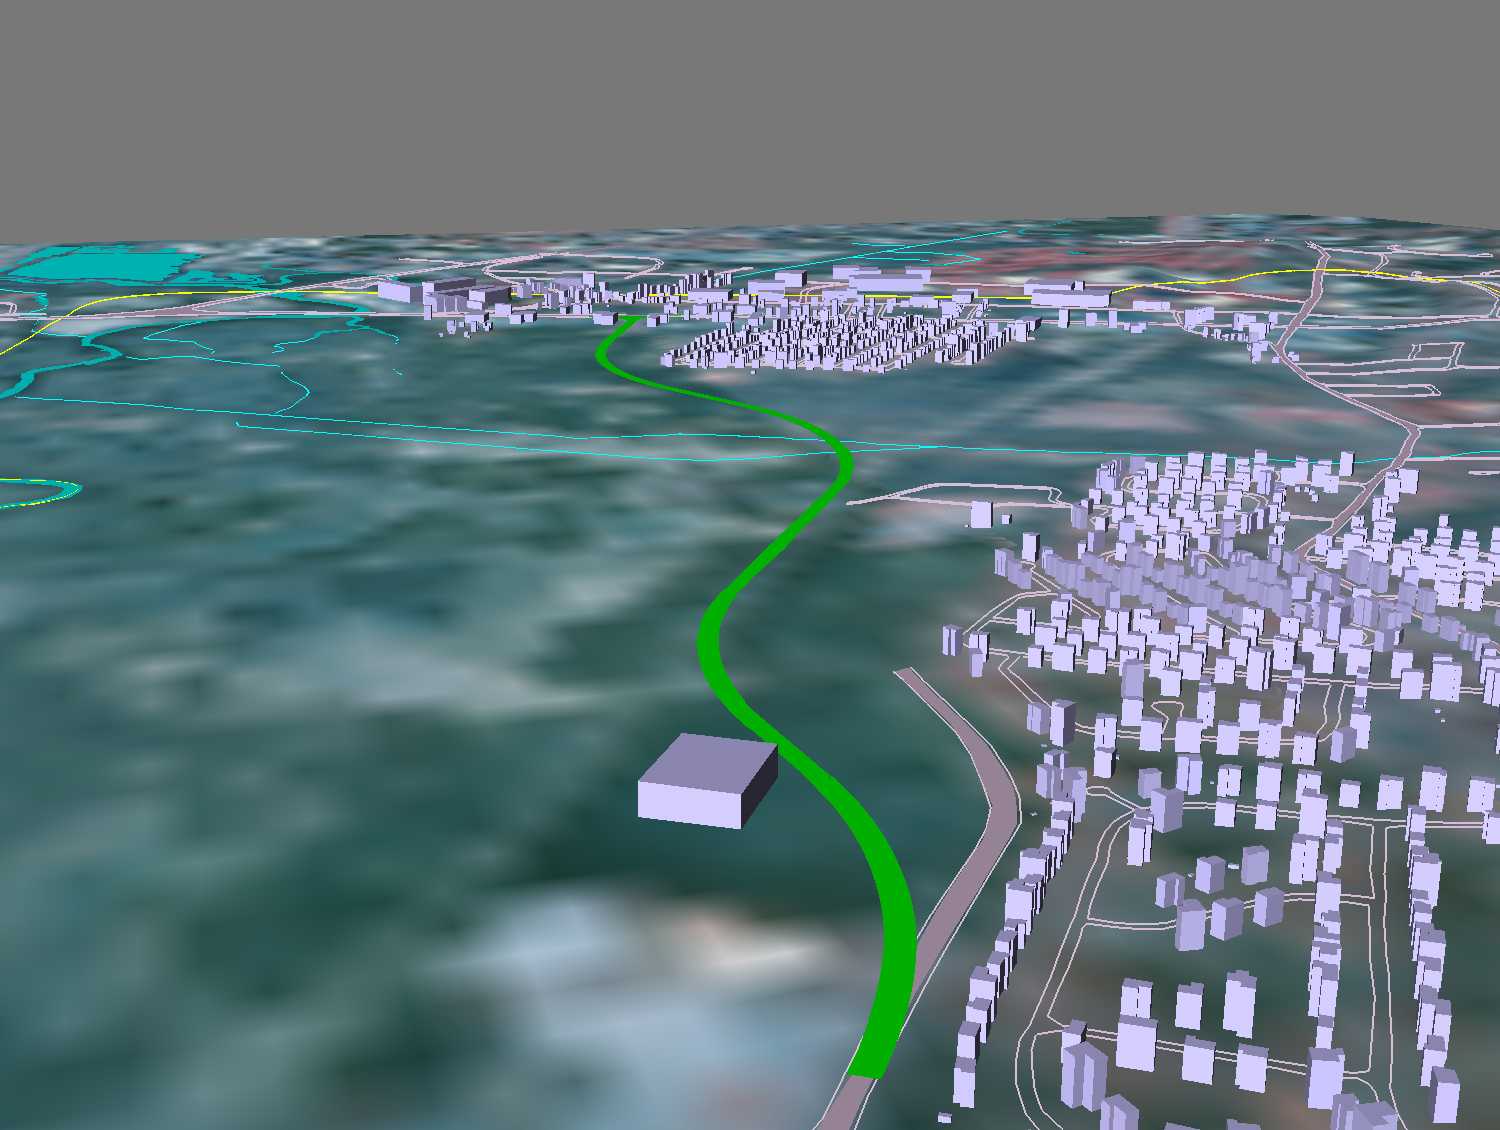
Figure 17
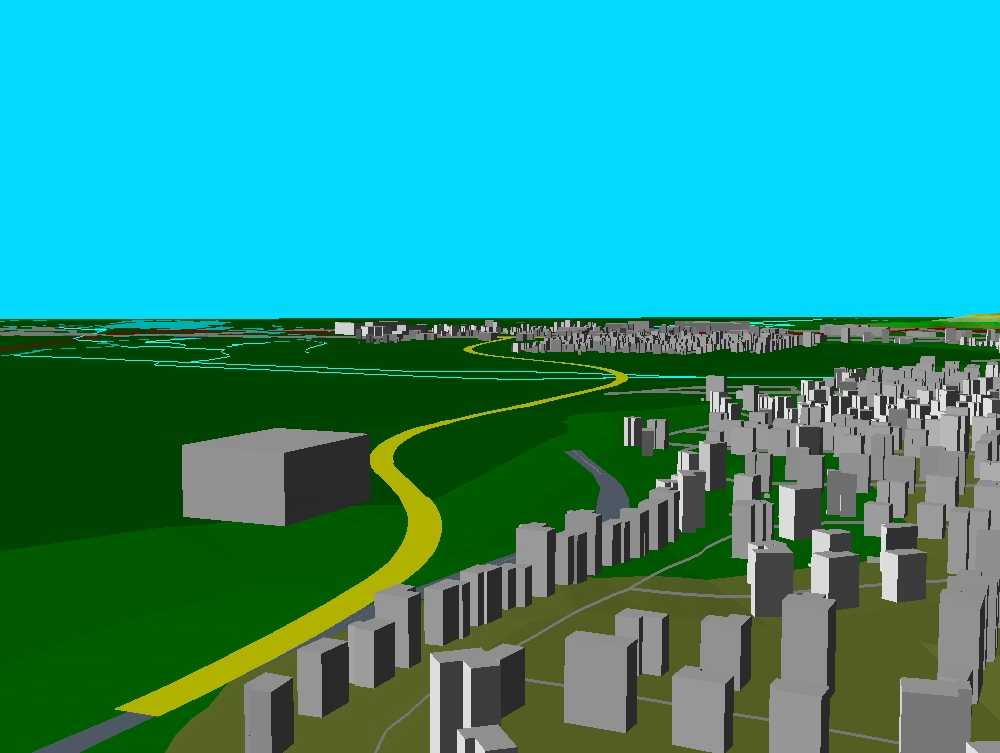
Figure 18
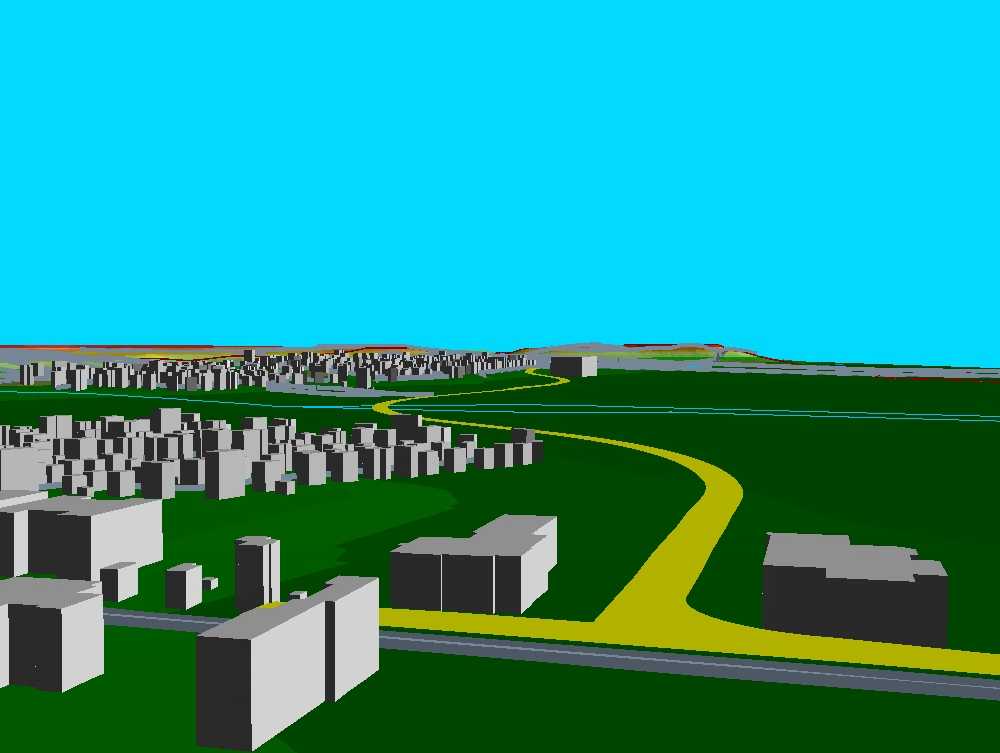
Figure 19
Once a 3-D model has been developed, fly over animations can also be created. A fly over animation - a simple animation file that simulates the effect of flying over the featured area - helps to capture a vast area in a single animation file. This is helpful because it is difficult to cover an entire watershed area in just a few images. Creating a number of images would be both cumbersome and time-consuming (see Obstacles in Implementation) when viewing a large data set in 3-D.
A fly-by-animation extension developed by Esri and available free on its web page, can be used to create fly over animations. The process is simple and involves specifying the required parameters such as step distance, flight path, camera altitude, angle and extent, image size and quality etc. After these parameters have been specified, the mpeg movie can be created. The value of each parameter and the time required to create a movie varies, depending on type, size, and the quality of the data.
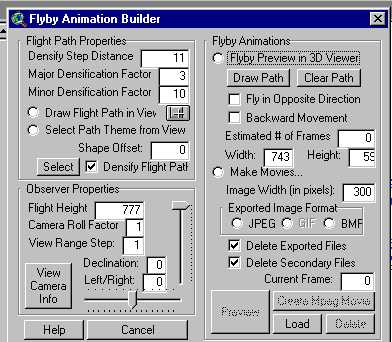
Figure 20: The fly-by-animation builder extension interface that is used to create animations. It also allows the user to preview the animation before it is created.
The Nine Mile Run Watershed is characterized by a complex topography that results in an exceptionally large TIN. Large TINs take longer to load on the computer, and because the screen also takes longer to refresh, it also takes a significant amount of time to create animations. The workstation used for the Nine Mile Run project was a Dell Precision 610, with 528 MB of RAM and a Pentium 550 Xeon Processor. For large 3-D jobs it is recommended that operators use high-end workstations. An ideal workstation has a 30 GB hard drive, 528 MB RAM, 16 MB Video Card, and 800 MHrtz Processor Speed.
It is also recommended that all of the contour attributes be verified before turning it into a TIN. This is necessary because there may be arcs with differing neighboring arc elevations (though in reality they should be equal), which could result in an irregular surface much different from the actual topography. The attributes of the contours can be verified by the querying functionality, or the legend editor tool, of the Arc View 3.x Software. Users can color or query arcs with different elevations and observe the continuity. If any discrepancy exists in the data, the attributes can then be rectified.
3-D GIS will likely become an essential component of the GIS toolbox. While 3-D analysis is not yet commonplace in decision-making, the ability of 3-D GIS to render complex contour maps understandable for the layperson, makes it an invaluable tool. Currently, 3-D GIS is a work in progress. Since it doesn’t offer flexibility in data editing, processing and analysis as a practical tool, it must be developed further.
Some of the areas that require further development follow:
A large sized TIN (created from lines with smaller elevation intervals, with complex surface topography, covering a vast area) when added to the 3-D scene window within the Arc View, makes it difficult for general viewing. The user must wait for a significant amount of time for the screen to refresh if the angle of observation in the 3-D scene window is changed. The animation process involves capturing multiple screen shots, saving them as images, and processing them into a single mpeg file. Making animations with such TINs becomes very time consuming because it takes so long for the screen to refresh as the camera moves forward, capturing each screen shot and saving them as images. If such data were viewed as compressed data it would eliminate many of these problems.
The symbol palette feature available within the Arc View software contains a large category of symbols used in various fields, such as geology, realty, weather, oil and gas, etc. These symbols, when viewed in the 3-D scene appear only as a point - as a result losing their 3-dimensionality. It is very difficult to create a building or a house (that shows doors, windows etc.) with just lines, points, and polygons (although not impossible). The availability of a 3-D symbol palette allowing the user to add a building or a house in the 3-D scene window by maintaining its 3-dimensionality would help simulate real world situations, and provide an image that is closer to the reality. This is indeed a technical challenge and may not be possible in the near future.