The Amazon Basin covers an area of 2.2 million square miles. The difficulty in identifying activities over this vast area is of major concern for its sustainable development. This paper focuses on the use of geographical data to support a Wide-Area Surveillance(WAS) application implemented in the Amazon Region of Brazil. Sources of data include digital cartographic maps, remotely sensed images, and geo-located information from aerial, environmental and communication sensors. Data is managed in a database and further manipulated via overlays and spatial analysis to extract information. This information in turn supports WAS Artificial Intelligence models in situation assessment.
The system is organized into sub-sectors, each in charge of providing support on different tasks. The application named WAS - Wide Area Surveillance, is part of a sub-sector that will provide support to the identification, location and classification of illegal and irregular activities, monitoring diseases, and socioeconomic development.
This paper focuses on the use of geo-located information to support the reasoning component of the WAS application. It covers the construction of Bayesian networks to support the analysis of spatial and non-spatial information. Also covered is the process of using remote sensing and GIS to extract features from images used to generate spatial information used in Bayesian networks.
The reasoning tool consists of G2 and Gensym -BayesOn-Line TM - (BOL). It supports the analysis of data originating from a variety of sources, spatial and non-spatial. The reasoning system aids the analysis by its organization of confirmed and refuted hypotheses, investigated and non-investigated data sources, causal relations between hypotheses and evidences, and the frequency of events.
The GIS was developed with Esri's ArcView GIS and Spatial Database Engine(SDE). ArcView was customized to utilize spatial data produced within and outside of the WAS application. Customization provides a simple interface to spatial data models in SDE, allowing for queries and manipulation of database layers. Thematic layer processing tools enable automatic extraction of objects from images to generate spatial data supporting the reasoning tool.
The qualitative and quantitative knowledge of the Bayesian networks were gathered through interviews with domain experts. The qualitative knowledge of an activity comprises basically of events that are casually related to the activity. When considering a causal relation between an activity and evidence, it is also taken into account other causes of the event. Events are also matched with data sources to support the investigation.
After the gathering of qualitative knowledge and the inter-dependences among events, the qualitative knowledge is inputted into the Bayesian models. Quantitative knowledge is conditional and prior probabilities representing the frequency of the events in the presence of the activities and frequency of the activities in the area of the investigation respectively. Providing probability is the most difficult part of constructing Bayesian models since statistical data about the events as related to the domain activities are largely unavailable. To overcome limited knowledge about statistical information, subjective probabilities can be used to obtain the frequency of events from the beliefs of domain experts. It is also possible for training BOL to learn the conditional probabilities from statistical information gathered during the operation of the WAS application.
When the user starts an analysis, WAS suggests the Bayesian models available for the analysis. The execution of a model is a cycled-process of gathering evidences, setting their corresponding nodes in the Bayesian network, evaluating the model to identify likely hypotheses, and again investigating other evidences to confirm and/or refute candidate hypotheses.
Image processing was performed using Erdas Imagine. Erdas was customized for the WAS application to guide users without image processing backgrounds to complete the tasks required. The GIS was performed using ArcView GIS with the Spatial Analyst extension. It was also customized to enable easy use by inexperienced users. Data produced by the Feature Extraction Workflow was managed by SDE for Oracle.
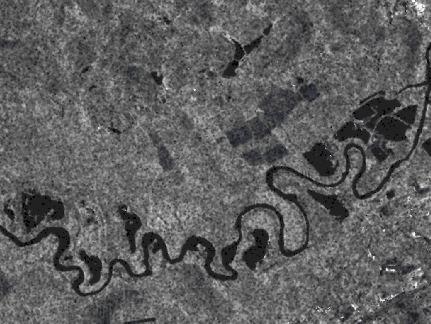
Sources of image data used in the feature extraction workflow come from airborne sensor image data. MSS image data (Airborne Multi Spectral Scanner) consists of 11 or 31 bands. This sensor data provides the majority of information that is extracted from images. Features extracted using MSS image data include clearings, turbid water, small populated areas, likely mining areas and landing strips. SAR (Airborne Synthetic Aperture Radar Data) provides for extraction of landing strips and clearings. It has two bands with a total of five polarizations. This sensor provides all-weather, all-time data.
When ingested by the WAS application, the images are geometrically
rectified. Additional preprocessing is performed by the
WAS application on SAR images to remove speckle. Each image is then classified
by land cover type. The classification scheme for each features was determined
based on the types of land cover that are known to harbor the features
being extracted. In addition, the scheme attempts to use one classification
for the identification of multiple features. For example, landing
strips typically occur in cleared areas surrounded by forested areas or
grassland while mining causes exposed soil and turbid water.
The classification produces a thematic image which can be exported from
Erdas as an ArcInfo grid file.
Processing continues in the GIS to determine geometric properties
and spatial relationships. The Grid file contains the full classified
image produced in Erdas. The user then determines the class or combination
of classes to use in performing further calculations. This flexibility
allows the analyst to make adjustments based on the image quality and level
of classification. It also provides an utility independent of the
image source and band combinations used for classification. Each
class selected by the user is separated from the image and reclassified
into one class. A user intending to extract lilely areas of mining may
choose to utilize two different types of exposed soil as one exposed soil
class.
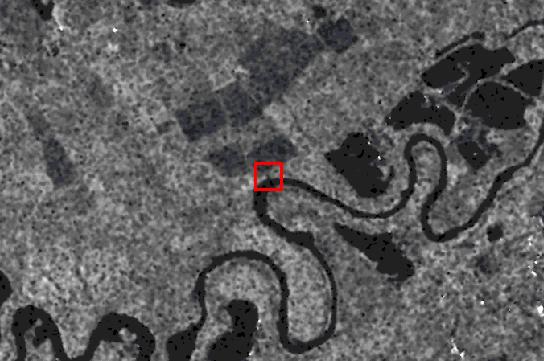
The absense of filtering during the image processing allows the
GIS to take advantage of small insignificant groupings in the image to
be expanded and combined. A region growing algorithm is applied to
connect multiple insignificant bundles into one larger bundle. Bundles
that are too far away from another bundle are left isolated and removed
from the image. For intermittent occurrences of a feature, this can
be a very valuable filtering technique. In the case of drug plantations
or small settlements, individual clearings may not occupy an area large
enough to arouse the interest of an analyst. However, grouping them
together into one larger object might catch the eye.
Each bundle in the image is assigned a unique number to create a new thematic layer. This allows each potential feature to be identified among others in the image. Relevant geometric properties of each potential feature in the classified image is calculated. The initial registration of the image makes it possible to perform absolute calculations on size, rotation, thickness, etc... Each calculation is then stored in the attribute table of the grid file.
The spatial relationship to other relevant features within the image is also recorded. This ability enables the user to take advantage of information that may be present in the image but not available in existing spatial data. It eliminates the constraints imposed by out-of-date data and scale.
The final thematic layer then contains objects with the spectral properties matching the object of interest as well stores the geometric measurements and spatial relationships. The analyst then applies threshold values to the geometric measurements and spatial relationships to filter out objects similar to the objects of interest. After applying thresholds, the resulting layer is overlayed with other relevant spatial information as well as the original image to further confirm or refute the object as a feature of interest or not.
The large area covered by an image makes it difficult to visually
identify features. Using image processing coupled with a GIS enables
the automatic identification of features. It also enables the analyst
to inspect a large area with coverage of multiple images in a short amount
of time. The objects extracted by this process are vectorized and
loaded to SDE support the location and identification of activities
by the WAS application.
Erdas Imagine was used in the WAS application to perform image processing tasks including classification and filtering. The processing resulted in a thematic layer with classes related to the event attempting to be identified. This thematic layer was then ingested into the GIS to perform geometric measurements and spatial analysis.
Arcview was used in the WAS application to perform the spatial analysis tasks including geometric measurements and spatial analysis. Rectification of the original image allowed for absolute geometric measurements. The geometric measurments were applied to such objects as landing strips or to eliminate banks of rivers and roads. Spatial analysis involved overlays of cartographic data. Thresholds applied by the analyst filtered possible objects from the image. Viewing the area of the original image where the possible objects resided allowed for final confirmation.
Marcia Ruble
GIS Analyst
Amazon Technologies
Alexandre Rezende
System Engineer
Amazon Technologies