Steven French and Xudong Jia
ABSTRACT
High-speed telecommunication facilities are the railroads of the new
millenium. The Georgia Tech Center for Geographic Information Systems developed
an interactive atlas of telecommunication facilities in Georgia to support
economic development and commercial site selection decisions. The atlas
was originally based on ArcView IMS. This paper describes an ArcIMS-based
enhancement of the system that allows companies to locate high-speed telecommunication
providers serving specific locations. The system discussed in this paper
enables a firm to locate his/her address on a street map and display the
nearby telecommunication facilities.. The paper compares the ArcView IMS
and ArcIMS technologies used in the system.
INTRODUCTION
High-speed telecommunication facilities will be the railroads of the new millennium. Communities that have access to advanced telecommunication facilities will be able to participate in the fastest growing, high-wage sectors of the economy. Those communities lacking such access will wither, much as towns bypassed by the railroads did in the nineteenth century. There are several classes of users that require high bandwidth telecommunication facilities. The first and most obvious are the rapidly expanding e-commerce firms, which include not only newly created companies like Amazon.com, but also "old economy" firms that are rapidly moving more of their business to the web (e.g., Delta Airlines). The second class is a whole new breed of firms that specialize in providing web-hosting services or acting as application service providers to other companies (e.g., Exodus Communications and PSINet). While not a large sector of the economy, this sector is experiencing explosive growth and has an almost insatiable demand for bandwidth. The third group of users is those organizations that need to provide rich communication links among distributed locations. These include universities that want to implement distance learning technology, state agencies that want to share documents and databases and branch offices that need to maintain contact with a central headquarters (Malecki, 1997; Read and Youtie, 1995). Taken together, these activities represent a large enough portion of overall economic activity to make telecommunications infrastructure an important determinant of future economic development.
The increasing demand for high-speed services has provided incentive for the telecommunication industry to take advantage of technological advancement in fiber optics. Additionally, many local communities have taken the initiative to establish their own municipal fiber networks as part of their economic development strategy to attract business to the community, rather than waiting for demand to grow strong enough to entice a private firm to provide service. In this model, the infrastructure investment risk is borne by municipalities or public-private partnerships. Telecommunication facilities are often packaged along with the other municipal utilities such as water, electricity, gas or cable TV (Niles, 1997; Youtie, 2000). In areas where private providers offer high-speed services as well, city-owned systems can promote price competition and help give both firms and citizens better access to the Internet. The city of LaGrange, Georgia became the first city in the United States to offer free Internet access to all 27,000 of its residents on its municipal system. The Lagrange municipal telecommunication facilities have already attracted several new firms to the area. Ten other rural Georgia municipalities had put their own systems in place by the end of 1998, and several had as many as 15 competitors providing services (Youtie, 1995, 2000).
Telecommunication networks are clearly emerging as highways for information
exchange in business and industry (Malecki, 1997). Many researchers and
governmental officials, including key Georgia legislative leaders, the
Governor�s Office, the Department of Industry Trade and Tourism and the
Metropolitan Atlanta Chamber of Commerce, strongly believe that improvements
in telecommunication infrastructure should be an important component of
the state�s economic development strategy. Recently, the Georgia Center
for Advanced Telecommunications Technology, the Georgia Tech Center for
Geographic Information Systems, and the Georgia Department of Industry
Trade and Tourism initiated a collaborative project to develop the Georgia
High-Speed Telecommunications Atlas. The Atlas is an on-line, interactive
inventory of Georgia's high-speed telecommunication infrastructure designed
to provide information to economic developers and the commercial real estate
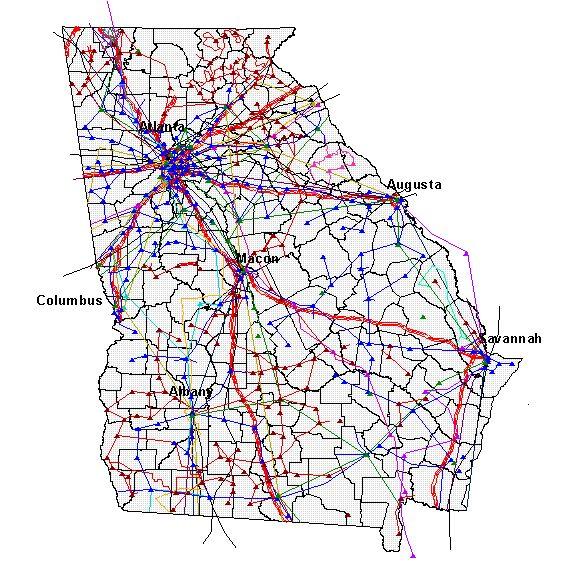
industry. It contains the first comprehensive inventory of high-speed telecommunication
lines and access points from twenty facilities-based carriers in Georgia
(French, 2001). The major telecommunication lines and points of presence
in Georgia are shown in Figure 1. The Atlas is
originally developed using the ArcView IMS technology.
"Last Mile" Challenge
The Atlas provides firms and economic developers with the identity and location of major backbone facilities that serve their location. However, it does not provide detailed information on local lines that link the location to the backbone. The "last mile" is the term the telecommunications industry uses to refer to a circuit, facility, or service used to connect a customer or a Point of Presence (POP). A POP is the point at which the facilities of an inter-exchange carrier are accessible. The "last mile" problem refers to the difficulty of establishing the connection from a POP to the site location of the user�s office or residential house. Clearly, the closer a site is to a POP, the easier and more cost effective it is to make this connection. This "last mile" issue is analogous to the interstate highway system with the most desirable points of location being near the ramps. Just being near a fiber optic line is not useful unless there is a node (or a POP) to allow connection.
How important is the "last mile" issue to firms that require bandwidth and to the communities seeking to attract those firms? Many experts speculate that it is important enough to raise office space leasing and sales rates in areas with optimal access to points of presence. Real estate developers are beginning to use this location factor to site certain types of projects. According to the Metro Atlanta Chamber of Commerce, two key infrastructure questions are typically posed by business prospects looking for high-tech office space in metro Atlanta: "What is the location�s distance to the nearest Central Office or Point of Presence?" and "What are the capabilities of the telephone infrastructure feeding into the specific building, the fiber technologies and redundancies?" Initial research does not indicate that the general office sales or leasing price have been affected by distance to a point of presence, but anecdotal evidence suggests that the "last mile" problem has become a key in some specific cases.
To address this "last mile" issue, the Georgia Tech Center for Geographic
Information Systems has recently developed a Web-based service using Esri�s
ArcIMS technology. The service is an important add-on to the Georgia High-Speed
Telecommunications Atlas. It enables a user to locate his/her address on
a street map and display the nearby telecommunication facilities within
a 0.5, 1, or 2-mile radius.. The Atlas lets the user view the telecommunication
facilities for a given location and supplies contact information for the
providers. This paper describes the conceptual framework and the implementation
of this Web-based service. The paper goes on to describe the experience
gained from the implementation of the Georgia High-Speed Telecommunications
Atlas using both ArcView IMS and ArcIMS technologies.
Conceptual Framework for Web-based atlas
The objective of the Web-based Atlas service is to provide potential high-speed bandwidth subscribers with an Internet mapping system that can display telecommunication services for a given address. When a firm or realtor is considering a business site, he/she may need to know the distance from the site to the nearest POP. This system accepts a site address as input, uses address matching to create a location and then searches for all the POPs in a user selected radius.
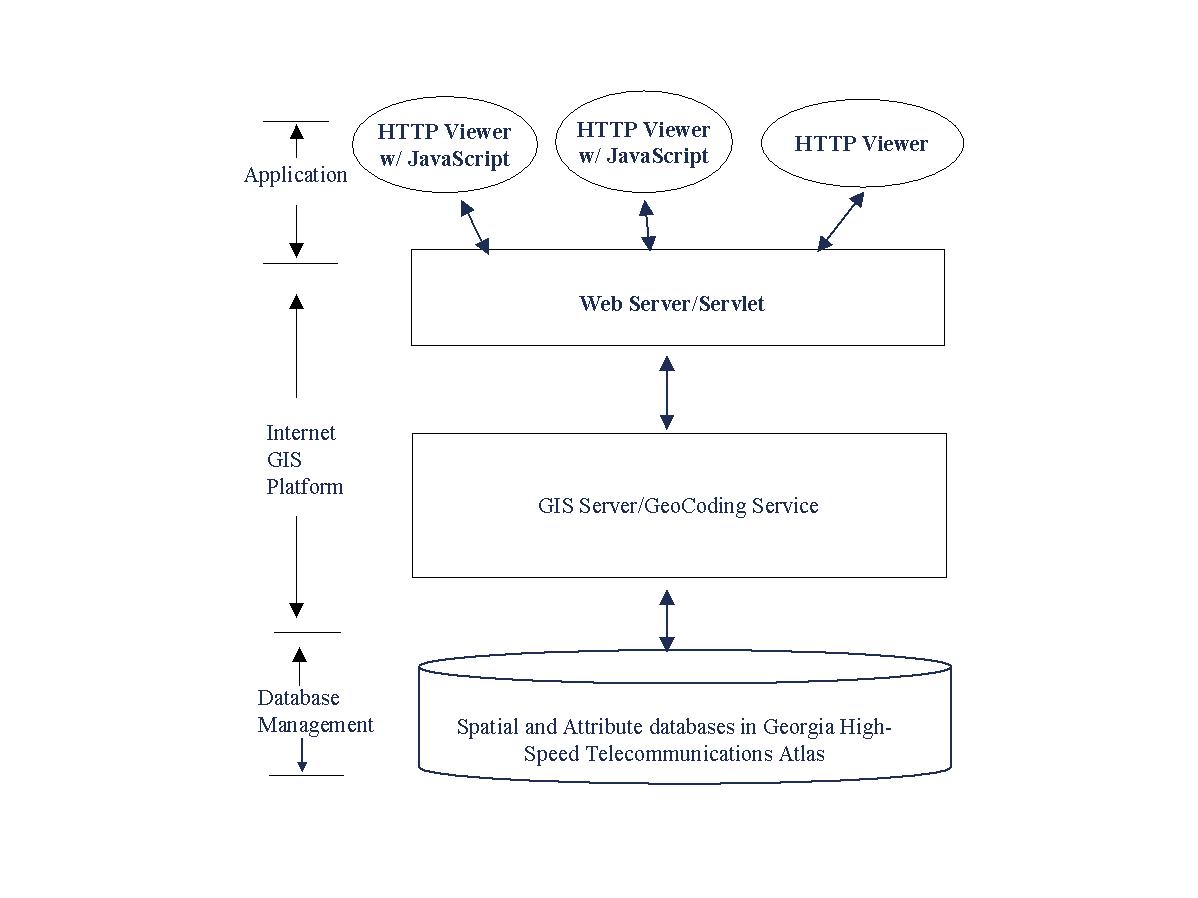
A conceptual framework was developed to enable the integration of GIS databases through Internet and to locate the nearby telecommunication facilities (see Figure 2). The conceptual framework is an Internet-based client/server system with three tiers. The bottom tier is the GIS database management layer. It contains spatial and attribute databases that are used for the Georgia High-Speed Telecommunications Atlas. The primary databases include a GIS base map, points of presence, and business contact information for the service providers.
The middle tier is the critical component within the conceptual framework whose primary function is to provide an Internet service. There are a series of servers included in the platform. The Web server monitors requests sent from clients using Hypertext Transfer Protocol (HTTP). When requests are received, the Web server further distributes the requests to appropriate applications for processing and sends the results back to the clients. The Web server has a supporting "plug-in" called a Servlet. The Servlet provides seamless links between the Web server and the GIS server. The GIS server contains geocoding and other functions required by this application.
The top tier provides the interface to the system users. This layer
includes an HTTP interface into which the user can enter a street address.
It also provides the capability to display the POPs that fall within a
0.5, 1 or 2 mile radius of the entered street address. This layer also
contains a reporting function that enables the user to print the results
of the query.
Implementation of Web-Based ATlas
Based on this conceptual framework, the project team implemented the
ArcIMS query service during the summer of 2000. The implementation process
involved a number of tasks including collection and preparation of GIS
data, selection of the Web and GIS servers, design of web pages, and development
of the address-based query tool.
Data Collection and Preparation
One of challenging issues involved in this project is the collection of GIS data that represents the facilities of the Georgia telecommunications network. Because of security concerns and fear of losing competitive advantage, most telecommunication providers are generally reluctant to release the location of their lines and points of presence (POPs). The Georgia Center for Advanced Telecommunications Technology (GCATT), which routinely works with the major telecommunication providers, was instrumental in convincing fifteen companies to share this information in order to support state economic development efforts. The data describing the location of high-speed fiber optic lines and POPs was provided in wide variety of forms: GIS maps, CAD maps, paper maps, and even Microsoft PowerPoint marketing slides. These various map representations were digitized and converted into a standardized format that could be displayed on a GIS base map of Georgia.
The data collected for the project included fiber optic routes with a network capacity of OC-3 or greater (see Table 1 for definitions of fiber capacity terminology). Therefore, the Atlas does not include lower capacity telecommunication facilities, such as T1 lines. Neither does the Atlas include the capacity of specific fiber routes. Most providers say that fiber lines can be upgraded at any time, therefore making capacity information too difficult to keep. While efforts were made to contact all telecommunication providers in the state, not all were willing to provide information on their facilities.
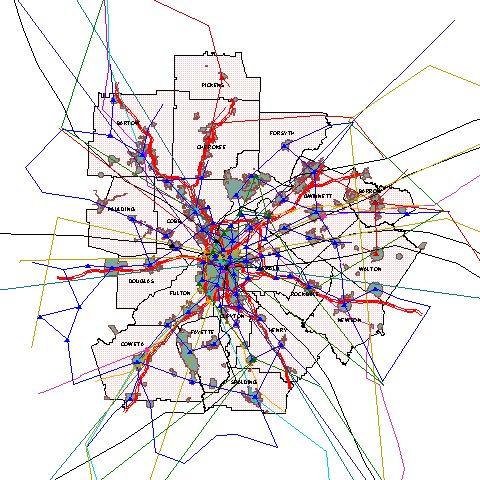
The data collected for the project also included contact information
for the various telecommunication providers as well as basic population
and employment information for cities and counties. Figure
3 is a blow up showing the location of POPs and central offices of
telecommunications carriers throughout the Atlanta area.
Selection of Web and GIS Servers
The Apache web server and Esri�s ArcIMS GIS server were selected for
use in this project. ArcIMS is a powerful Internet Mapping system that
has a development environment for the project members to implement the
Web-based query tool. In comparison to other Internet-based mapping services,
ArcIMS provides a rich set of spatial services that includes geocoding,
the most important service for the project. ArcView IMS and MapObjects
IMS were initially considered in the early stage of the project. The ArcView
IMS and can only provide rudimentary GIS capabilities such
as zooming in/out of a map, searching a database, and identifying owners
of specific facilities. However they cannot support the Dynamic Hypertext
Markup Language (DHTML) that is required in the project.
Table 1. Fiber Optic Line Capacities
| T1 | A digital line capable of carrying either voice or data at a speed of 1.5 Mbps. Typically, a copper telephone line with special equipment to accommodate higher transmission rates. Currently, a popular level of service for businesses communicating internally. |
| DS-1 | Digital circuit with a capacity of 1.54 Mbps (million bits per second), equivalent to a T-1 line. |
| DS-3 | Digital circuit with transmitting capacity of 44.736 Mbps. Typically used by a firm with moderately high bandwidth requirements. |
| OC-3 | A digital circuit transmitting at a speed of 155.52 million bits per second (OC-Optical Carrier). |
| OC-48 | A digital circuit with a capacity of 2.5 Gbps. |
| OC-192 | Digital transmitting capacity of 10 Gbps. |
| OC-768 | A digital circuit with transmission capacity of 40 Gbps. The largest fiber optic pipes currently deployed. Typically, used in the main backbone of interstate data networks. |
Source: MEAG Power Telecommunications Glossary of Terms,
Telson Telecommunications Glossary
The Apache web server was chosen in the development phase because it
is the web server on which the ArcIMS software package was initially developed
and tested. The Apache web server was found to be fully supportive of the
operations of ArcIMS. Additionally, the Apache web server can be downloaded
from Internet. The Apache web server is replaced by Microsoft�s Internet
Information Server (IIS) in the delivering phase because of its limited
technical support available. Such a change will be helpful for the later
upgrade of the system.
Web Pages Design
The address-based query tool is designed to support commercial site selection decisions and public access to telecommunication information. A key criterion in the design of the web pages was to make them as easy to use as possible. There are three viewer alternatives provided by the ArcIMS technology for web page design. These three viewers are HTML viewer, Java Standard viewer, and Java Custom viewer. The Java viewers require two downloads. The first one is the Java Runtime Environment and the second one is the ArcIMS viewer components. These two downloads require about 10 MB of storage space and significant download time. In considering the stringent user requirements, the project team has decided to use the HTML viewer for the web page design.
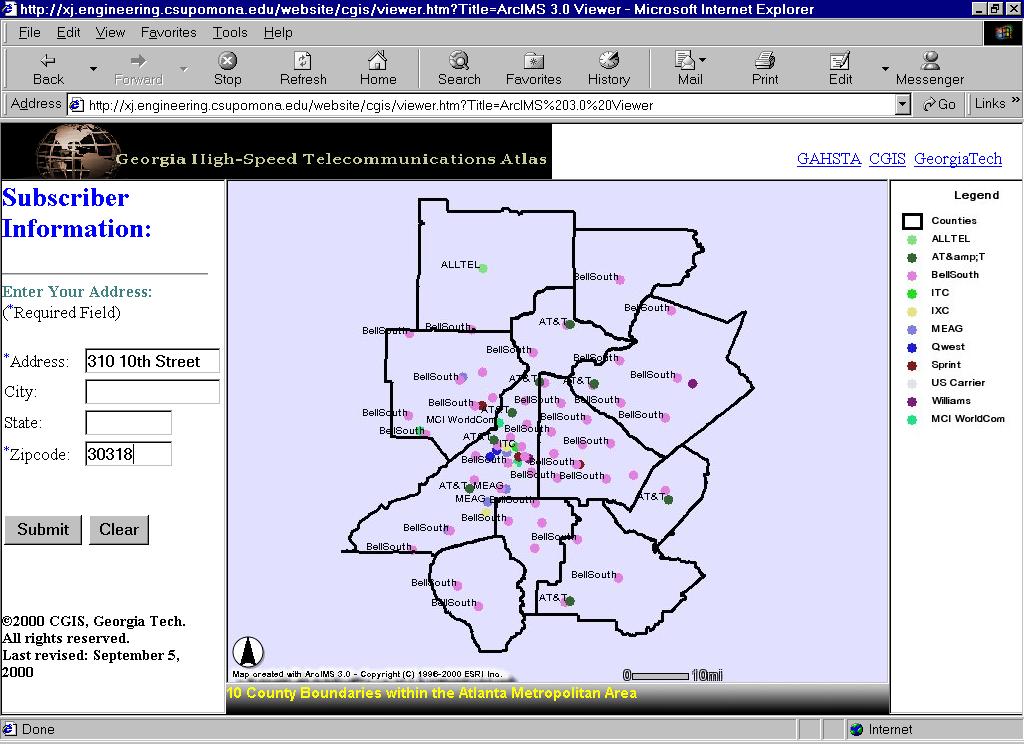
The home page of the address-based query tool is shown in Figure 4. The home page, developed using JavaScript and ArcIMS HTML viewer template, contains two parts. The first part on the right side shows 10 counties within the Atlanta Metropolitan Area. The dots within the map indicate the locations of POPs of the telecommunications providers in the area. The second part on the left allows a user to key in a street address within the Atlanta Metropolitan area in the address field and a zip code in the zip code field. For example, a user may first key in "410 10th Street" in the address field and "30318" in the zip code field and then click the Submit button to submit the query.
The address-based query tool utilizes three primary components of ArcIMS
(Author, Administrator, and Designer) to receive the user�s information
via Internet, geocode the user�s site onto a GIS base map, display a circle
around the site and layout points of presence on the GIS base map. Author,
Administrator, and Designer are used sequentially to set up the Web site
on which the Atlas service is provided. Author is used to create an AXL
file called atlas_service.axl to define what data resources
and GIS functions should be used by the system. Administrator is used to
start the system based on the AXL file. The Designer is used to design
the web site that integrates the system with the web pages discussed in
the previous sections.
Three primary tasks are undertaken to implement this project. These
three tasks are discussed as follows:
1) Authoring a map configuration file
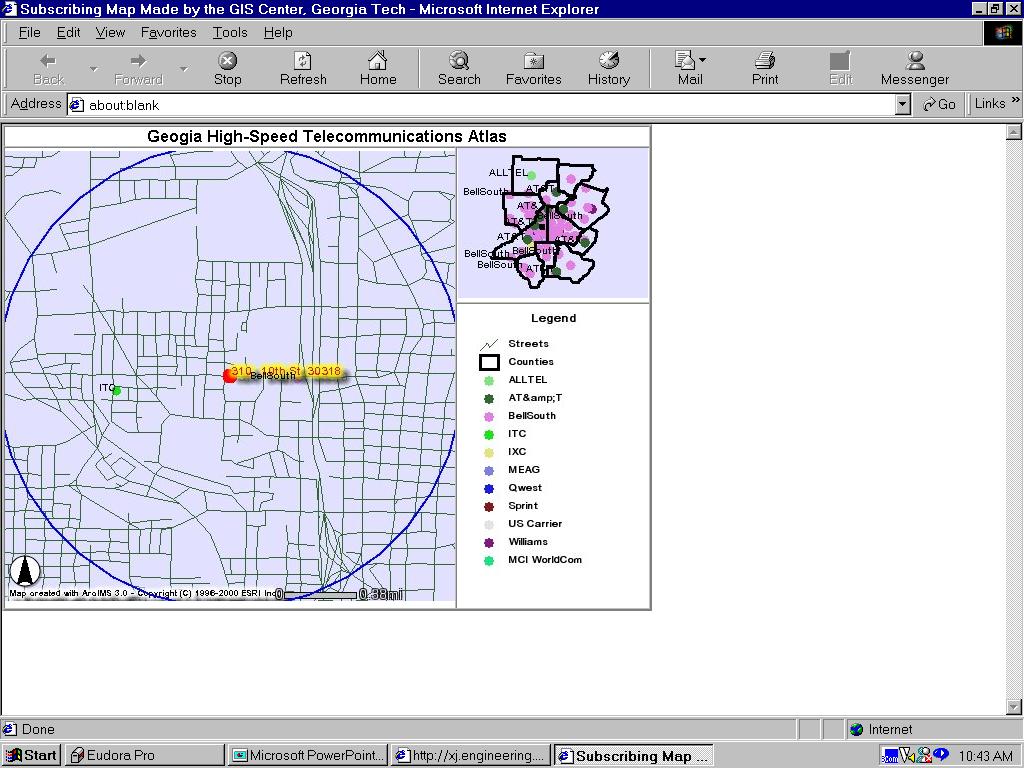
The web-based system provides users with two Web functions: contact
and print. When a user clicks the contact button, the Atlas service will
list the contact information of the telecommunications carriers in the
area. When a user clicks the print button after finishing the search, the
system will assemble the search map and legends and generate a map that
can be printed easily. Figure 7 shows the printable
map produced by the print function of the service.
CONCLUSIONS
The Georgia High-Speed Telecommunications Atlas is a powerful GIS tool to analyze the relationships between telecommunications infrastructure and economic development. It provides an on-line, interactive inventory of Georgia's high-speed telecommunications infrastructure designed to provide information to economic developers and the commercial real estate industry.
This paper discusses how the initial high-speed telecommunications atlas
was extended to incorporate an address based query tool that is useful
to firms, realtors and economic developers making location decisions on
new buildings, firm headquarters and branch offices. The Atlas provides
users with a powerful one-stop shop for telecommunication information for
any given location in the Atlanta area. The use of an address-based front
end makes this system available to users who are interested in their particular
location. This address-based query tool is an important addition to the
existing High-Speed Telecommunication Atlas. It can be accessed at http://pansy.gis.gatech.edu/website/telecom_gc/.
REFERENCES
French, Steven and Martin, Claudia B. "The Geogia High-Speed Telecommunications Atlas." Presented at 42nd ACSP Annual Conference, Atlanta, Georgia, November 3, 2000.
Malecki, Edward J. Technology and Economic Development. Harlow, England: Addison Wesley Longman. 1997.
Niles, John S. "Digital Infrastructure: The New Public Works?" New Telecom Quarterly. 4th Qtr, 1997.
Read, William H. and Jan L. Youtie. "LaGrange Georgia�s "Field of Dreams": Economic Development and Telecommunications in a Rural Area." Economic Development Review. Vol 13, Issue 1, 1995.70-76
Read, William H. and Jan L. Youtie. "Field of Dreams Revisited: Economic
Development and Telecommunications in LaGrange, Georgia." Economic Development
Quarterly. Vol 14, Issue 2, 2000. 146-154
AUTHOR INFORMATION
Steven French, Ph.D., AICP
Director
Center for Geographic Information Systems
Georgia Institute of Technology
Atlanta, GA 30332-o695
Phone: 404-385-0901, 404-385-0450
Email: steve.french@arch.gatech.edu
Xudong Jia, Ph.D. PE
Assistant Professor
Department of Civil Engineering
California State Polytechnic University, Pomona
Pomona, CA 91768
Phone: 909-869-4312 Fax: 909-869-4342
Email: xjia@csupomona.edu