topABSTRACT
INTRODUCTION
MAPPING METHODOLOGY
THE CLASSIFICATION SYSTEM
PROGRAM STRENGTHS
THE RESULTS
ENVIRONMENTAL INDICATORS
ACKNOWLEDGMENTS
ENDNOTES
REFERENCES
AUTHOR INFORMATION
The New Jersey Department of Environmental Protection (NJDEP) has recently completed an update of a 1986 Land Use/Land Cover (LULC) GIS dataset to 1995/97 digital imagery. The production project and statistics for the state and for the 20 Watershed Management Areas (WMA) will be presented. These statistics detail patterns of change in a highly urbanized east-coast state. The update process involved examining the 1986 data set over the 1995/97 CIR digital imagery, (1 meter resolution), and capturing changes as a 'heads up' edit function using a special ARCVIEW application developed for the project. The update details the extent of land use/land cover change in New Jersey over this time period, and provides baseline information to assess the priority status of environmental indicators
The New Jersey Department of Environmental Protection (NJDEP) has been actively mapping the land use and land cover (LULC) of New Jersey in detail since 1986. The first LU/LC map, based on 1986 imagery, included 32 classes, with a minimum mapping unit (mmu) of 2.5 acres. The classification system used was based on Anderson et. al (1976) "A Land Use Land Cover Classification System for Use with Remotely Sensed Data," as edited by the NJDEP. This digital data layer proved to be a watershed in digital environmental analysis and informed decision-making using GIS in New Jersey. Recently, the NJDEP GIS Unit completed an update of the 1986 LU/LC dataset, delineating over 60 classes of LU/LC to a 1-acre mmu. The mapping methodologies and basic findings of the status and trends in land use and land cover from 1986 to 1995/97 are presented.
Land use and land cover maps describe the landscape of a particular area by assigning each land unit to a specific category or class, such as residential, forest, or agricultural. When LU/LC maps are completed, they can be used to describe the land utilization patterns of municipalities, counties, states or regions. Describing these land utilization patterns, and tracking changes in them over time, become key elements in managing and protecting environmental resources, and in monitoring and assessing environmental indicators.
The terms 'land use' and 'land cover', though often used interchangeably, refer to different landscape attributes. Land use refers to how particular land areas are being utilized by humans, while land cover refers to the natural vegetative communities. For example, identifying a particular area as "high density residential" is a description of the land use, while identifying an area as "mixed coniferous/deciduous forest" is a description of land cover.
The intent of the1995/97 LULC update was to edit the 1986 GIS data set to reflect conditions existing on 1995/97 imagery, using more sophisticated photo-interpretive techniques, and a more detailed classification system. The 1986 data layer has been used in a wide variety of environmental analyses, but had become very much out of date. In addition, there was a need to increase the level of detail in the LU/LC data, both by adding some additional categories and by reducing the mmu to 1 acre. Lastly, it had become clear that one of the more important factors affecting environmental quality is the amount of impervious surface found in an area of interest. Impervious surfaces directly affect run off and water quality, which in turn affect environmental health. Calculations of the amounts of impervious surfacing by land use polygon were also included in the present study.
The 1986 baseline data set was produced by analyzing a series of Color Infrared (CIR) aerial photos, and delineating the land use/land cover polygons interpreted from the photography onto hardcopy orthophoto base maps. The base maps are controlled ortho-enlargements of the aerial photos, so that the interpreted land use/land cover polygons could be drawn by hand around the same features seen on the photos. Each polygon drawn was coded with an appropriate LU/LC code. When all such delineations were completed, the delineation overlays were scanned and put into an ArcInfo digital format and coded for use in the NJDEP's GIS.
In 1995, the NJDEP partnered with USGS, EPA, NRCS, FSA, NJDOT, NJTransit and several other organizations to produce a set of NAPP standard CIR photos and DOQQ digital imagery. For the 1995/97 LU/LC update, the NJDEP again had photo interpreters use the 1995/97 CIR stereo imagery to interpret land use/land cover. However, this time, LU/LC polygons were captured directly in digital format over the digital image base using a special ARCVIEW application and "heads-up" digitizing. New line work was added where needed to capture any LU/LC changes. New codes representing the 1995/97 LU/LC categories and impervious surface amounts could be added to the data set. The application greatly streamlined the editing and coding process, and included several important quality control functions.
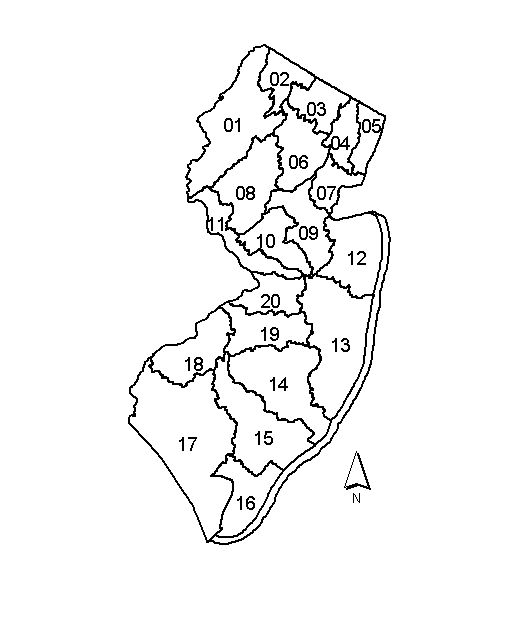
The 1995/97 LU/LC update layer was produced (delineated) by Watershed Management Areas (WMA) instead of by more traditional political boundaries (Figure 1). There are 21 WMAs for the state: 20 cover the land area of the state with a 21st that covers only an open portion of the Atlantic Ocean, created for water quality monitoring purposes. The boundaries of these 20 land based WMAs follow physical drainage basin boundaries. Land use/land cover for each WMA was mapped and delivered separately. All WMAs were mapped using the same criteria and categories, and all final data sets were standardized and edgematched for statewide consistency. Aerial Information Systems (AIS) of Redlands, CA. was contracted to produce the 1995/97 update and impervious surface mapping for the NJDEP, GIS Unit.
The digital images used in this mapping effort had a ground resolution of one meter. With
this high resolution, photo interpreters could accurately identify, classify
and delineate actual land units of 1 acre. The entire state of New Jersey was analyzed and classified
acre by acre. The use of high resolution images also means that a more detailed classification system
could be used in the mapping effort. Over 60 land use/land cover categories were mapped in this project,
allowing data analyses of a wide variety of land use/land cover types to be undertaken.
Watershed Management Areas
Using classic photo-interpretation to make land use/land cover determinations has many advantages, particularly in a state like New Jersey in which the landscape over relatively small areas is often fairly complex. Photo interpreters use their knowledge of the area being mapped, of subtle distinctions in the classification systems, and of subtle differences in the ways different land use/land cover categories appear on aerial photographs (known as photo signatures), to improve land use/land cover determinations and delineations. And while the delineations for this project were created over a two dimensional image on a computer screen, the actual photo interpretation and classification were done using stereoscopic analysis of the photographs that allows the landscape to be viewed in three dimensions. This ability to view the landscape in 3-D greatly improves classification accuracy.
Verification of classifications and delineations by actually going out and checking the LU/LC in test areas is an important part of supporting the classification developed. Tens of thousands of field sites were visited in this mapping effort. Sites included both pre-compilation visits to match photo signatures with land use categories, and post compilation field visits to check the delineations and classifications after they were completed. This level of field investigation has rarely been a part of a mapping effort as large as this present statewide effort.
The data set produced in this process included all delineations and codes representing LU/LC as it existed in 1986, as well as the lines and codes representing LU/LC as it existed in 1995/97. Tracking the history of any area over the 1986 to 1995/97 time period can be investigated from this one data layer by performing some simple data queries. This eliminates problems and errors associated with comparing two separate LU/LC datasets.
Together, all of the land use and land cover categories used in a mapping effort make up the classification system used. There are many classification systems in use, with many systems developed just for use in specific projects. NJDEP uses what might be called a modified Anderson classification system. The Anderson system was developed by researchers at the United States Geological Survey, and was named after the principal investigator responsible for creating the system. NJDEP used this system as a base, and added and deleted categories as necessary.
This system is hierarchical, meaning that there are various levels at which each land unit can be described. At the most general level, called Level I, there are six categories, Agriculture, Urban, Forest, Water, Wetlands, and Barren Land that apply to New Jersey. The classification system represents each of these categories by a numeric code. The Urban category is given a code of 1000, the Agriculture category 2000, and so on.
Each of these categories can be further divided into more specific types that allow a more detailed description of each land unit. And every specific type is represented by a different number within the general code class of the Level I category into which it fits. For example, a Residential area at Level I would be given a code of 1000, because it is part of the general category of Urban. At the next detailed level, Level II, it would be further identified with the code 1100, which represents all Residential land uses.
This Residential area could be assigned to a more detailed category at Level III, High Density Residential, which has a specific code of 1110. But all Residential areas will be in the 1100 series, at Level II and the 1000 series at Level I. Once coded, each land unit can then be investigated at the most detailed level identified, or at any of the less specific categories to which it belongs.
New Jersey is the third smallest state in the US with a total acreage of 4,986,204 million acres; but, at the same time, exhibits the highest population density. Although New Jersey has several large urban centers of its own, it also acts as bedroom communities to two of the largest cities in the US, New York and Philadelphia. There exists a constant demand for developable land to serve this portion of the northeast megalopolis.
The statistics for a Level 1 analysis of the LU/LC for New Jersey in 1986 and again in 1995/97 are shown in Table 1 and Figure 2. In 1986, New Jersey had over 1 million acres of tidal and freshwater wetlands, 1.6 million acres of upland forest, 1.2 million acres of urban land (includes residential), over 700,000 acres of agricultural land, and 285,000 acres of inland waters (includes enclosed tidal bays). Barren land comprised a modest 57,000 acres.
|
Land Use/Cover Type |
1986 |
1995 |
Net Change |
|
Agriculture |
744,382 |
659,017 |
-85,365 |
|
Barren Land |
57,223 |
57,971 |
748 |
|
Forest |
1,641,279 |
1,602,578 |
-38,701 |
|
Water |
285,498 |
290,643 |
5,143 |
|
Urban Land |
1,208,553 |
1,342,525 |
133,972 |
|
Wetlands |
1,049,269 |
1,033,471 |
-15,798 |
Over the nine years, the New Jersey landscape lost 9,485 acres per year of agriculture, 4,300 acres per year of upland forest, and 1,755 acres per year of wetlands. Net gains include 83 acres per year in barren land, 571 acres per year in inland water, and 14,855 acres per year in urban lands. Since New Jersey has an increase of 68,416 people per year (�90-�00), 0.22 acres of new urban land was required for each new person in New Jersey.
The wetland acreage losses were unexpected since coastal wetlands have been protected in New Jersey since 1972, and the freshwater wetlands since 1988. An examination of the pattern of loss, however, indicates that the regulations are in fact, working to greatly reduce wetland losses. Coastal wetland changes made up a small portion of the total loss, with much of the loss due to natural events. For freshwater wetlands, it appears that much of the wetlands lost through artificial processes were the results of land conversion projects that were initiated or approved after the 1986 photography was flown but before the wetland legislation went into effect several years later. This is supported by an examination of additional photography flown in 1991.
The net increase in inland water can be attributed in a large part to several new, large reservoirs in the state, and to erosion and inundation of shoreline areas, particularly along lower Delaware Bay. Barren land contains beaches and rock faces but also urban transitional areas that have been cleared and prepared for an as yet unknown activity. Acreage of barren l and remained very stable over the nine-year study, as transitional areas are constantly being both created, and converted to permanent uses.
The over-riding trend in the change in landscape in New Jersey over the nine-year period involved the conversion of agricultural land and upland forest to residential development. This finding, although not news to many environmental and planning professionals, can now be quantified through this dataset, and evaluated in a variety of ways, including the effect the changes have had in the increase in impervious surface amounts throughout the state.
The impervious surface estimates have attracted a large amount of attention as being both vanguard and of extreme value for modeling. The NJDEP is also considering using these estimates in regulations to preserve and protect water quality for future development.
Statistics for many different areas of interest, and for many different specific land use/land cover change patterns outside the scope of this summary document, are now being generated, and several lines of investigation utilizing the data are now being planned. One prominent example of the immediate use of these data has been in the environmental indicators program.
NJDEP has been a leader in developing, implementing, and evaluating an environmental results-based management system using indicators as the foundation for evaluating policy and adapting environmental management. This system emanates from a Sustainable State initiative, which outlines 11 goals and 41 indicators for New Jersey�s quality of life, linking society, environment and the economy.
NJDEP has six overarching Strategic Plan Goals: Clean Air; Clean and Plentiful Water; Safe and Healthy Communities; Healthy Ecosystems; Abundant Open Space; and Open and Effective Government. The six overarching goals are further refined through our National Environmental Performance Partnership System (NEPPS) Agreement with the U.S. Environmental Protection Agency (EPA) Region II. The NEPPS Agreement provides finer environmental media- and natural resource-specific goals and milestones, and includes reporting on over 100 indicators, as well as detailed strategies in each of these areas (Kaplan and McGeorge, 2001).
Digital aerial photo-interpreted LU/LC data has been instrumental in providing the detail required to evaluate both direct and indirect measures of stressor and condition indicators relative to a number of land and natural resources goals. Examples include status and trends of wetlands, agricultural lands, forested lands (Figure 3), and patterns in land development in relation to goals for ecosystem structural integrity, biotic integrity, and preservation goals.
The land use land cover data can provide indicator information for what classes of land cover have already been preserved by federal, state, and local governments. Such data can prove decisive in assisting these agencies determine what types of land cover need to be preserved by county, municipality, watershed, or any other area of interest. For instance, the LU/LC data unioned with state dedicated open space administrative boundaries can detail the acres of upland and wetland forest that have already been protected (Figure 4). Breaking these data down to finer categories by area of interest can assist in prioritizing data acquisition strategies by habitat type. Such decisions can have profound impact on species diversity and abundance.
In the future, the NJDEP is joining efforts with the State Mapping Advisory Committee and the Implementation Team (I-TEAM) initiative to capture high-resolution aerial photography (1:20000) in 2002. These photos will then be processed to digital images at a nominal 1-foot ground resolution. The NJDEP will use these baseline 2002 images to again update in detail the land use land cover of the state of New Jersey.
Funding for the project was provided by the NJDEP Division of Watershed Management and the NJDEP Division of Science, Research and Technology. The project coordination and management was provided by the Office of Information Resources Management, Irene Kropp, Director, and the GIS Unit, Lawrence Thornton, Manager. Open space data provided by NJDEP Green Acres Program. The authors thank the dedicated delineation staff at AIS, Inc.
Interested parties are encouraged to work with the full data sets for more detailed analysis, after having read the associated explanatory documents and metadata.
The land use land cover shapefiles by WMA, and the associated FGDC complaint metadata files, can be downloaded from:
http://www.state.nj.us/dep/gis/Level I statistics for each Watershed Management Area are available at:
http://www.state.nj.us/dep/gis/webstats.htmThe entire list of land use codes used in this mapping effort is given in:
http://www.state.nj.us/dep/gis/digidownload/metadata/lulc95/codelist.html .
A full description of the land use codes is given in:
http://www.state.nj.us/dep/gis/digidownload/metadata/lulc95/anderson.htmlA full description of the methodology used in this project is given in:
http://www.state.nj.us/dep/gis/digidownload/metadata/lulc95/update.htmlThe boundaries of the WMAs can be seen in the following graphic:
http://www.state.nj.us/dep/gis/wmaindexnew.htmlAnderson, J.R., E.E Hardy, J.T. Roach and R.E. Witmer. A Land Use and Land Cover Classification System for Use with Remote Sensor Data. Geological Survey Professional Paper 964; USGS Printing Office, Washington, D.C., 1976.
Kaplan, M.B. and L.J. McGeorge. 2001. The Utility of Environmental Indicators for Policymaking and Evaluation From a State Perspective: The New Jersey Experience. Risk Policy Report 8(5):39-41.
Lawrence L. Thornton, Manager GIS Unit, New Jersey Department of Environmental Protection, PO Box 428, 401 East State Street, Trenton, NJ, 08625-0428; (609) 633-8144 (V); (609) 292-7900 (F); lthornto@.dep.state.nj.us
John M. Tyrawski, Research Scientist, GIS Unit, New Jersey Department of Environmental Protection, PO Box 428, 401 East State Street, Trenton, NJ, 08625-0428; (609) 777-0151 (V); (609) 292-7900 (F); jtrawsk@.dep.state.nj.us
Marjorie B. Kaplan, Research Scientist, Division of Science, Research and Technology, New Jersey Department of Environmental Protection, PO Box 409, 401 East State Street, Trenton, NJ, 08625-0409; (609) 633-1313 (V); (609) 292-7430 (F); mkaplan2@dep.state.nj.us
Ernest P. Hahn, Chief, Office of Natural Resource Damages, New Jersey Department of Environmental Protection, PO Box 404, 501 East State Street, Trenton, NJ, 08625-0404; (609) 984-0844 (V), (609) 984-0836 (F); ehahn@dep.state.nj.us
Jeffrey P. Tash, GIS Specialist, Division of Fish and Wildlife, New Jersey Department of Environmental Protection, PO Box 400, 501 East State Street, Trenton, NJ, 08625-0400; (609) 292-3795 (V), (609) 984-1414 (F); jtash@dep.state.nj.us
Lisa K. Cotterman, Project Manager, Aerial Information Systems, 112 First Street, Redlands, CA, 92373; (909) 793-9493 (V), (909 798-4430 (F); ais@aisgis.com