Figure 1. The Architecture of the GeoBrowse System.
We describe the fusion of multispectral image data and GIS data in a powerful tool that integrates Esri's ArcSDE and ArcView with a statistical data mining engine (Insightful's S-PLUS). Our approach employs automatic feature extraction techniques to quantify useful information in satellite imagery and to store it in a format compatible with GIS vector data. Image-derived information then can be fused, or compared with, GIS data to build statistical models that explain the relationships between data variables, or to perform information retrieval experiments. We demonstrate statistical data mining tools for pattern discovery and model validation over very large areas.
Satellite technology supplies data at an enormous rate. Most database research on the analysis of remotely sensed images has concentrated on data retrieval, and on simple queries that involve spatial joins and spatial selections. For example, the Sequoia 2000 project [13] aimed at the retrieval of raster data, while the Sloan Digital Sky Survey [14] posed the need for creation of a multi-terabyte astronomy archive. Large scale system studies for the analysis of remotely sensed images have been specialized for the detection of particular features, such as volcanoes [2], or have proposed distributed and parallel data storage and query processing systems for handling geo-scientific data retrieval queries [11].
Insightful Corporation's GeoBrowse project aims to provide the infrastructure required for the analysis of satellite images. Most systems for analyzing remotely sensed images allow simple queries based on the date of image capture, and location. Such systems also allow only simple analyses of single images. When we deal with large collections of remotely sensed images, however, the current systems do not scale well. Therefore, new algorithms and new indexing methods are needed to enable the analysis of data provided by satellite systems.
In order to facilitate the analysis of large amounts of image data, we extract features of the images. Large images are partitioned into a number of smaller, more manageable, image tiles. In addition to providing faster extraction of segments, partitioning allows fetching of just the relevant tiles when retrieval of only part of the image is requested. Then those specific image tiles are processed to extract the feature vectors. The GeoBrowse architecture distinguishes between three types of feature vectors:
All image features, together with the original image, are stored in a database system, and they are indexed for fast retrieval. An Oracle database system provides the means for fast information retrieval and network accessibility. Region level features can be stored in an Esri Spatial Data Engine (SDE), and can then be displayed using ArcInfo or ArcView together with associated labels, features, or statistics. This storage functionality enables the fusion of GIS, optical, and DEM information for a variety of statistical analysis methods.
There are many similarities between data mining in a collection of photographic images and data mining in a collection of satellite images. In both cases, features such as texture or color histograms are used in the analysis. In the case of the remotely sensed images, however, additional information may be available, such as Digital Elevation Models (DEM), or maps stored in Geographic Information Systems. This information, when available, can be used to enhance the search capabilities and improve the quality of the classification and prediction process. The GeoBrowse system also enables construction of sophisticated statistical models using the S-PLUS system, which can access data directly from the database, or using the GeoBrowse Graphical User Interface.
In this paper, we give an overview of the GeoBrowse system, and illustrate its use by showing the results of similarity searches for different types of urban areas. For these experiments, we used the LANDSAT image of Western Washington State. This image contains about 500MB of raw pixel information in 6 bands (3 visible range and 3 near-infrared bands). The image was corrected for atmospheric and terrain distortions, and was georeferenced. The entire image then was divided into image tiles of size 512 x 512 pixels that are a reasonable size for application of the segmentation algorithm.
We elected to use a database system for storage of the images and their features, since that allowed us to overcome some limits on to the maximum size of files, and to benefit from indexing, query optimization, and partitioning features of the database. The image tiles and pixel level features are stored as BLOBs, with each band or feature stored in a separate column. The region and tile level features are stored in regular database tables that can be accessed easily for further processing, using GeoBrowse functions or other software [12].
Spatial information about region levels also can be stored in Esri's Spatial Data Engine (SDE), together with the relevant GIS information. SDE provides open data access across local and wide area networks, and the Internet, using the TCP/IP protocol. It can retrieve data and perform spatial and geometric analysis with 14 topological searches, buffering, overlays and intersections, dissolve and clip, and topological data cleaning. The image derived features can be used in conjunction with GIS data to build statistical models that explain the relationships between data objects, or can be used to perform information retrieval experiments. SDE supports spatial operations, such as the creation of spatial buffers for proximity operations, and spatial joins that can be used to create predicates describing spatial relationships between objects in the database. Data stored in SDE can be also accessed from other Esri products like ArcInfo, ArcView, and MapObjects. These provide alternative environments for the visualization of the query results. These products can be used for additional data analysis, thus enabling analyses of satellite and GIS data in the same software environment.
A mining process or a similarity search is initiated by submitting a query written in a language similar to an SQL-like data mining language, such as DMQL [5] or GMQL [8]. In a query, a user can specify the type of knowledge to be discovered, the set of data relevant to the mining process, and the thresholds to filter out uninteresting rules. Based on this query, an SQL statement is constructed to retrieve the relevant data. The data mining module processes the data and passes the information about the resulting tiles and regions to the GUI, which in turn directly retrieves the images from the database. The capabilities of the data mining engine are enriched through the Java connection to the S-PLUS statistical data analysis engine.
The graphical user interface enables browsing and manipulation of the satellite images and associated features, creation of data mining queries, and visualization of the results of the data analysis.
Figure 1. The Architecture of the GeoBrowse System.
The GeoBrowse Graphical User Interface (Figure 2) is written entirely in Java. It enables querying the database, browsing query results, analyzing images, and visualizing extracted information. When several images are displayed using the GUI, they can be linked together, and image transformations can be applied concurrently to them all. For example, 6 bands of a LANDSAT image can be enlarged and scrolled simultaneously.
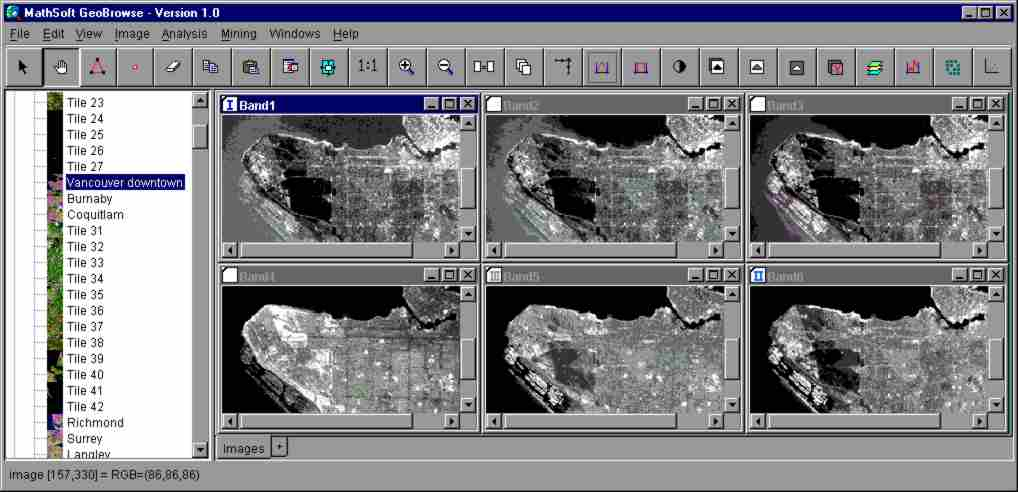
Figure 2. The GeoBrowse GUI.
The functionality of GeoBrowse includes a number of image processing tools, such as histogram equalization, spectral balancing, false colors, polarity switching, masking, overlays, multiband spectral mixing (Figure 3), etc. Also, the user can load images from the file system, or from the Internet.
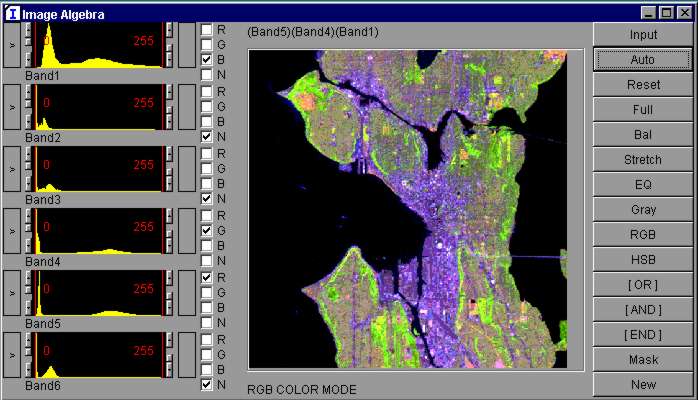
Figure 3. The Multiband Channel Mixer.
In addition to storage of multispectral images, additional information can be maintained, such as Digital Elevation Maps (DEM) (Figure 4). This information can be used in image processing, information retrieval, and data mining.
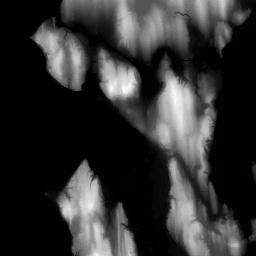
Figure 4. DEM Information.
The feature extraction process starts with the analysis of spectral and textural properties at the pixel level. The numerical pixel data can be clustered in order to find a small number of classes. At the same time, the tile level features may be extracted, thereby creating histograms of the pixel classes for each tile.
The extraction of region level features starts with a segmentation algorithm. The geometrical properties of regions, such as image moments, are extracted. Based of the pixel features, the system creates histograms, mean, and standard deviation features for each region.
Additional features are extracted using raster information, such as digital elevation maps. These features can be created at all three levels.
We extract pixel level texture features by using Gabor wavelets. In our comparison study
of texture based classification, the Gabor features were judged to provide superior performance
when compared to other texture analysis methods, such as edge attribute processing methods,
circular simultaneous autoregressive model methods, or hidden Markov model methods [3].
In GeoBrowse, for each pixel we extract eight texture features
 by using Gabor Filters with kernels rotated by
  . To obtain rotation invariant features, we find the values of the autocorrelation function [6]:
To minimize the range of the pixel index, we have chosen to compute values of the autocorrelation for n=0, 4. These values correspond to the 0° and 90° differences in the orientation of the Gabor kernels. This shift should allow detection of urban road networks, which usually are correlated within a 90° rotation of the wavelet kernels. The texture features are extracted using two different scales. Rotation invariance can be observed, and urban regions are judged to be similar, regardless of the orientation of street networks. For example, the suburban area of New Westminster, in the Greater Vancouver area, is judged to be similar to East Vancouver, despite the fact that the principal directions of the street networks differ by about 30° for these two regions. The extraction of other microfeatures, such as frequency and orientation, also is possible [6], and we plan to perform more experiments with these features in the future.
In addition to the extraction of Gabor texture features, the system provides for extraction of Haralick's coocurrence features [15] and Laws texture features [16]. But, in our information retrieval experiments, we found the Gabor textures to be superior in terms of recall and precision levels.
In order to build features that are used in the information retrieval and data mining functions, we perform unsupervised clustering using the CLARA algorithm [18]. The user chooses the number of classes, and each pixel is assigned to a single class. Figure 5 shows the assignment of pixels to 15 classes based on their spectral properties. Textural information may be processed in the same way to extract textural classes. For tile and region level features, histograms of pixel distributions between classes are created.
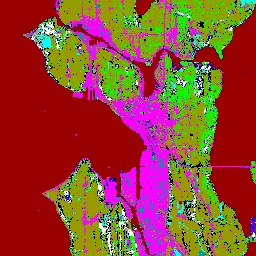
Figure 5. Spectral Classes.
Spectral Mixture Analysis (SMA) [1, 4] enables the analysis of remotely sensed images using spectral endmembers such as concrete, water, soil, trees, etc. The pixels usually cover the area with a mixture of different endmembers. For example, in the urban areas we may find a mixture of concrete, trees, soil, grass, etc. The result of SMA represents the percentage of the contents of the endmembers within the area of the pixel. In this way, we can distinguish areas with different mixtures of concrete, soil, water, and vegetation. The region and tile level features show the percentage of the area of a region or tile that is covered by particular endmembers. For example, Figure 6 shows the percentage of concrete cover in the Seattle area. The downtown and industrial parts of south Seattle, and Ballard, show dense concrete coverage; highways I-5 and I-90 are seen crossing the city and water; dark areas of water and city parks are visible, and a mix of concrete and other cover is seen in the residential areas of the city.
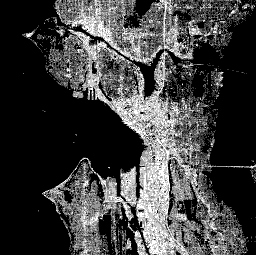
Figure 6. The Percentage of Concrete Cover Using Spectral Mixture Analysis (SMA).
The segmentation process uses a function based on the algorithm presented in [7]. This function segments an input image into non-overlapping regions by minimizing an energy functional that trades off the similarity of regions against the length of their shared boundary. It starts by breaking the image into many small regions. The algorithm then merges into a single region the two adjoining regions that are the most alike in terms of the specified polynomial model, given the length of the border between the two regions. Internally, the energy functional is evaluated using a Lagrangian parameter called lambda. The parameter often is called the scale parameter, since it controls the coarseness of the segmentation. A small value of lambda corresponds to a finer segmentation with more regions, while a large value of lambda corresponds to a coarse segmentation with fewer regions. Since the algorithm grows regions by merging similar regions, the value of lambda increases as the number of regions decreases. To achieve segmentation uniformity between the different tiles, the final value of lambda is set to be approximately the same for each image tile.
In the case of multi-band satellite images, the values of the pixels are often correlated. Therefore, a Principal Component Analysis is performed based on a large sample of pixels from all tiles, all tiles are rotated to the same axes and, for LANDSAT images, the first three components are used for the segmentation of each tile. In order to avoid oversegmentation of clouds, snow, glaciers and urban area, the values of pixels rotated to principal components are saturated to mean +- 2 x std.dev. An example of the image segmentation is presented in Figure 7.
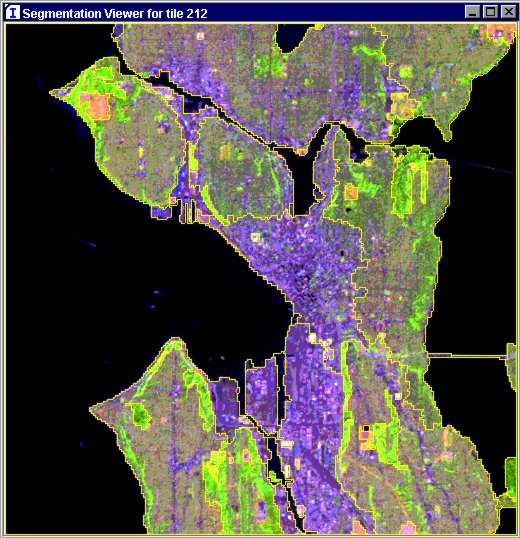
Figure 7. The Image Segmentation.
One of the distinct features of GeoBrowse is its ability to convert large quantities of multispectral satellite imagery into the GIS format. The results of image segmentation can be stored in the raster format in any database, and in vector format in Esri's Spatial Data Engine (SDE). In addition, information about the geometrical properties of the regions, such as area, eccentricity, orientation, and image moments is stored. This information can be combined with region level features such as texture, spectral properties, or DEM features.
Other Esri products, such as, ArcInfo, ArcView, and MapObjects can access the data stored in the SDE, together with additional map data. The SDE format allows a fusion of GIS, optical, and DEM information for a variety of visualization methods and data analysis functions. As an example, Figure 8 shows an Esri ArcView with the tiles corresponding to the area of Greater Vancouver, BC, Canada. The main endmembers for each regions are color coded.
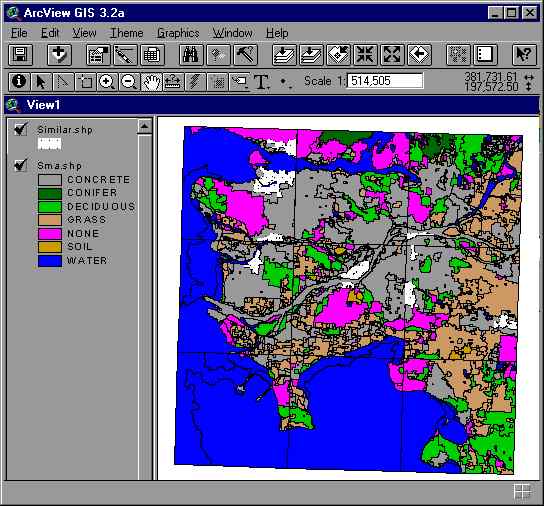
Figure 8. ArcView Presentation of Segmentation and SMA Features.
GeoBrowse uses an SQL-like query language that enables specification of the data mining task, the features that are to be used in the mining process, and any additional constraints. The system is capable of performing similarity searches based on any combination of features. A user can look for the most similar image tiles, or for the most similar regions based on a pattern tile or a pattern region. GeoBrowse allows arbitrary weighting of the features. The values of the features can be adjusted to have the range [0, 1], they can be multiplied by a specific value, or they can remain the same.
In our experimentation with region based searches we looked only for regions having areas larger than 3000 pixels. The feature values were scaled to the range [0,1]. We compared the results of similarity searches based on SMA features with searches based on texture features, or on a combination of the two features. When only a single feature vector was used, the results tended to have a high percentage of the areas that could be classified as false hits. The selectivity of the SMA features seems to be quite high for urban patterns, but some rocks and crops have spectral signatures similar to the spectral signature of concrete, and are classified as such. The selectivity of searches based on texture features is lower, but rotation invariance can be observed regardless of the orientation of the street networks. We have already noted the example of New Westminster and East Vancouver, which were seen as similar despite the orientation of the street networks differing by about 30°.
Figure 9 shows the tiles that are the most similar to the tile that contains Seattle downtown, which is the first tile shown. The second tile contains downtown Vancouver, the third tile shows South Seattle, the fourth tile shows North Seattle, while Victoria, BC is covered by the fifth tile.
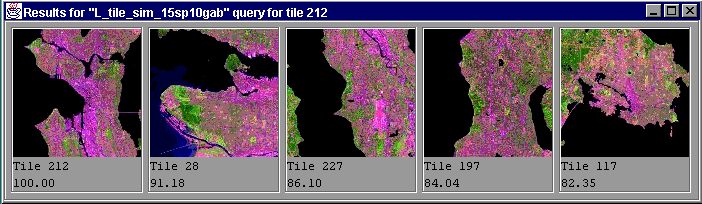
Figure 9. Tiles similar to Seattle Downtown tile.
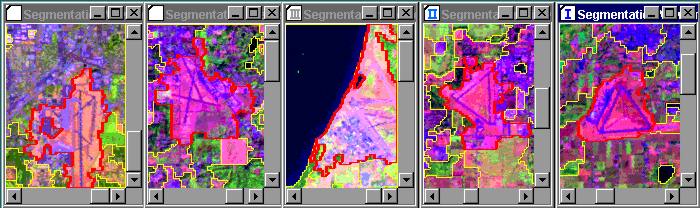
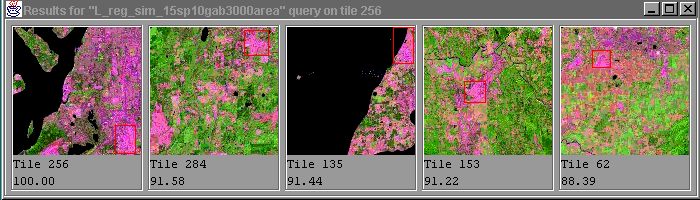
Figure 10 presents the result of a search for regions similar to McCord Air Force Base. Among the top 4 most similar regions are Olympia Municipal Airport, Whidbey Island Naval Air Station, Arlington Airport, and Abbotsford Airport.
We compared the results of the tile similarity search with the region similarity search for the case when the tile containing the pattern region is treated as the pattern tile. In this case, the returned tiles contain only a small fraction of the most similar regions that were returned by region based similarity function. The features of the smaller regions tend to be overwhelmed by the overall features of the tile.
|
|
Figure 10. Region Similarity Search for Airports.
In addition to the similarity search, the GeoBrowse system provides functionality for other types of analyses of remotely sensed data. This functionality includes the data clustering, building regression and classification models, prediction of land cover types, summarizing data, etc.
The user has an option to find clusters of image tiles based on any combination of tile level feature vectors. Figure 11 shows the centroids (i.e., the image tiles located most centrally in the feature space) for five clusters. The clusters were found based on the relative content of endmembers in an image tile. In this case we may see the image tiles that are the centroids of the discovered clusters. These medoids represent, respectively, areas with about 50% content of water cover (cluster 0), areas covered with conifer trees (cluster 1), areas with over 70% content of water cover (cluster 2), urban areas clustered with mountain regions (cluster 3), and areas covered with deciduous trees (cluster 4).
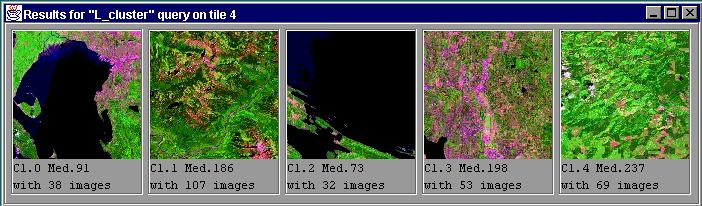
Figure 11. Clustering.
Regression trees provide an alternative to clustering. Figure 14 presents a regression tree that groups images according to their coverage by water. The opened highlighted leaf node contains 7 images represented by their thumbnails. The size and the water cover are shown for each node, and the bottom right panel presents detailed information about the highlighted nodes. Regression trees also may be applied on a region level to predict values of numerical attributes based on values of other attributes.
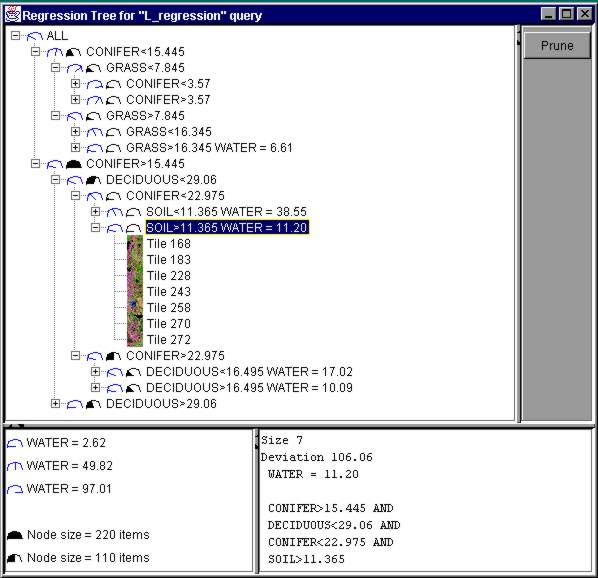
Figure 14. Regression Tree.
Classification is a data mining technique in which data in a database is analyzed to identify rules that describe the partition of the database into a given set of classes. Each object in the database (in relational databases, a tuple is treated as an object) is assumed to belong to a predefined class, as determined by one of the attributes called the class label attribute. The most common classification method uses decision trees. Such a method employs a top-down, divide-and-conquer strategy that partitions the set of given objects into smaller subsets where the leaf nodes are associated primarily with a single class. Decision tree methods can deal with both numerical and symbolic data. Figure 13 presents a decision tree that classifies regions according to their principal endmember. The distribution of principal endmembers for regions within each node of the decision tree is color coded and displayed, together with the conditions for node splits. A user can interactively explore parts of the tree, and can prune the tree.
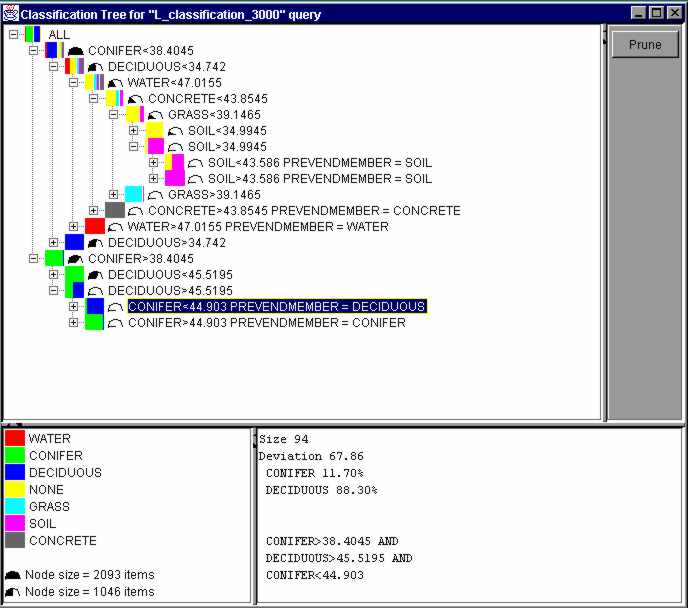
Figure 13. Classification Tree.
In many cases it is very difficult to describe analytically the features of the objects that a user is looking for. Therefore, improvement of the quality of the description may play an important role in image analysis. A method for interactive training of land cover labels using naďve Bayesian classifiers is described in [10]. In that approach, a user can interactively train a Bayesian model to define a number of land cover classes, which can be based on textural or spectral properties of images. The training is done based on pixel level features partitioned into a number of clusters. First, beginning with a single image tile, a user provides positive examples by selecting regions with pixels that belong to the same class, and the system then builds a model for use in identification of additional regions belonging to that class. He/she also has to provide negative examples, by selecting regions with pixels that belong to other classes. Based on this information, a model that estimates the posteriori probability of a pixel's class membership is built. The probability of pixels of the selected tile is shown on the screen. When a user judges the model to be good enough for pixels in the currently selected tile, he/she poses a query that finds either images with a high probability of belonging to the defined class, or images with a low probability (high separability from the class). Using these images, the user may choose to continue training based on other image tiles until the model is judged to be sufficiently good.
While the training is based on pixel level features, the retrieval is based on tile level features. Due to the nature of the naďve Bayesian classifier, which assumes conditional independence of the attributes, it is possible to find the average probabilities of the pixel class assignments in a tile based on the aggregated information about all pixels in the image tile. Despite the fact that the assumption of conditional independence is not always true, naďve Bayesian classifiers perform well in practice.
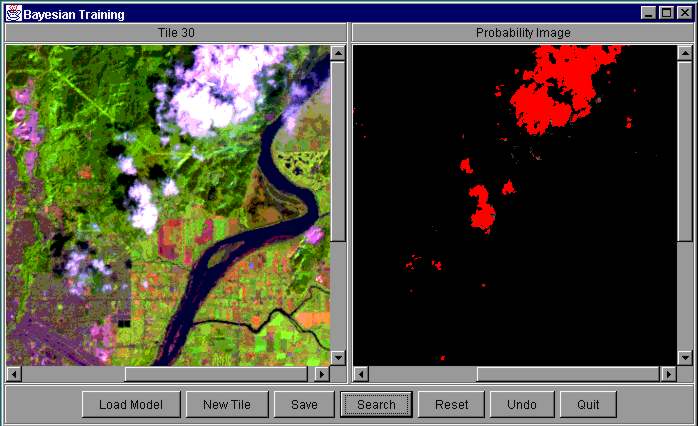
Figure 12. Bayesian Training of 'cloud' Label.
Another method for label training is based on decision tree models. Because the classification process on the pixel level would be extremely expensive to compute, the decision tree models are based on the region level features. In addition to spectral properties of the regions we can perform classification based on shape properties and areas of regions, as well as on auxiliary GIS information. For example, the spectral reflectance of concrete is very similar to spectral reflectance of different types of rocks. Additional information, such as Digital Elevation Models can be used to distinguish between these two types of land cover. In a way similar to Bayesian label training, a user provides the system with positive examples by pointing to regions that belong to the trained class, and negative examples by pointing to other regions.
One of the most important parts of the data mining process is formulation of the user query. We believe the success of relational databases should be credited in part to the creation of a standardized relational query language - SQL. Although many different graphical user interfaces exist for various database systems, the underling interface is based on SQL. Such a core language provides a foundation for information exchange, and promotes commercialization and wide acceptance of the technology.
Based on the above considerations, we constructed GMQL (Geo-Mining Query Language), a language for the formulation of input requests for the mining process. The language uses a unified syntax, which allows for a variety of data mining queries. GMQL is based on DMQL (Data Mining Query Language), which was developed for mining knowledge from large relational databases [5].
By using GMQL a user can specify four primitives for data mining tasks:
The mining query can be presented in an extended BNF grammar,
where "[ ]" represents 0 or one occurrence,
and words in BOLD font represent keywords, in the following way
   <task_type>
   [ FOR <dependent_attribute> ]
   [ WEIGHTED BY <weighting_attribute> ]
   IN RELEVANCE TO <attribute_list>
   FROM <relation(s)>
   [ WHERE <conditions> ]
The <task_type> clause specifies the type of
data mining task to be performed, and can also specify additional descriptions,
such as the name of the described class.
For example, by specifying TRAIN LABEL BASED ON SELECTED IMAGE
a user can choose the label training to be performed.
The next two clauses are used in the construction of regression and decision trees. These
include decision tree based label training.
The FOR <dependent_attribute> clause specifies the dependent attribute
for regression and classification, and WEIGHTED BY <weighting_attribute>
clause selects the weighting attribute.
The final three clauses define data relevant to the mining query.
They specify which attributes and tables should be selected from the database.
The IN RELEVANCE TO <attribute_list> clause selects a list of
attributes or attribute combinations relevant to the mining task.
This clause together with FROM <relation(s)> [WHERE <conditions>]
clauses are used to build an SQL query to retrieve the relevant set of data for the analysis.
The user should note that, just as in SQL functions, combinations of attributes may be used
to create different models.
In the example below we present a query for region similarity searches based on the content of six endmembers within a region. Only regions with an area larger than 1000 pixels will be retrieved and used in the search.
   FIND SIMILAR TO SELECTED REGION
   IN RELEVANCE TO A.IMAGETILEID,A.REGIONID,
   A.CONCRETE,A.CONIFER,A.SOIL,A.GRASS,A.DECIDUOUS,A.WATER
   FROM GEOBROWSE.LANDSAT_SMA_R A,GEOBROWSE.LANDSAT_SEGM_R B
   WHERE A.IMAGETILEID=B.IMAGETILEID AND
   A.REGIONID=B.REGIONID AND
   B.AREA > 1000
The GeoBrowse Query Composer (Figure 15) guides the user in the construction of a query. First, a user selects the data mining task he/she wants to perform. The query composer displays tables that might be used in the query and allows selection of relevant attributes and conditions. Finally, the user can edit the constructed GMQL query, save it to a file and execute the data mining task described by the newly created query.
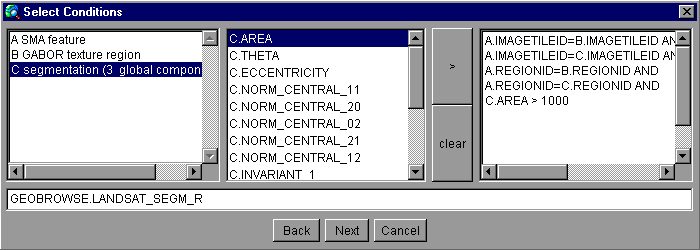
Figure 15. Query Composer.
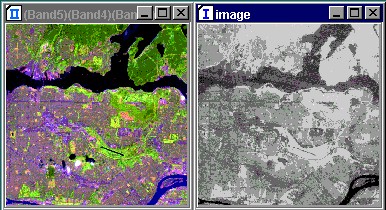
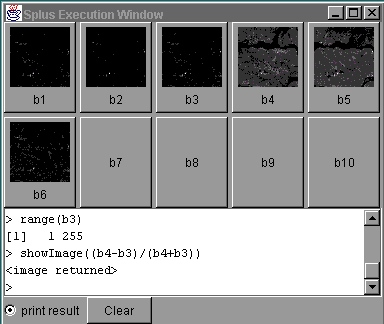
Insightful's S-PLUS [12] is an interactive computing environment for graphics, data analysis, statistics, and mathematical computing. It contains a super-set of the S object-oriented language and system originally developed at AT&T Bell Laboratories, and it provides an environment for high-interaction graphical analysis of multivariate data, modern statistical methods (e.g., robust and non-parametric methods), data clustering and classification, and mathematical computing. In total, S-PLUS contains over 3000 functions for scientific data analysis. GeoBrowse data can be accessed from within S-PLUS by using Java connectivity for images and ODBC connectivity for image and region data. In addition, GeoBrowse has the S-PLUS command tool (Figure 16), which provides for easy transfer of images to S-PLUS, and for data processing using the S-PLUS language. The S-PLUS images can be returned to GeoBrowse and displayed there. In the example presented in Figure 16, the NDVI index [17] is computed based on band 3 and band 4 of a LANDSAT image that covers Burnaby, BC. The NDVI index is displayed next to the color composite for that region.
 |
|
Figure 16. SPLUS Computation of NDVI.
The interface to S-PLUS also allows display of S-PLUS graphics. The graphics are shown in S-PLUS plot windows, and they can be created using functions typed into the execution window. Figure 17 shows a graph of the brightness and greenness indices for an agricultural part of British Columbia. The Kauth-Thomas tasseled cap for vegetation in the brightness-greenness plane [17] can be recognized, together with clusters of pixels that represent water and bare soil.
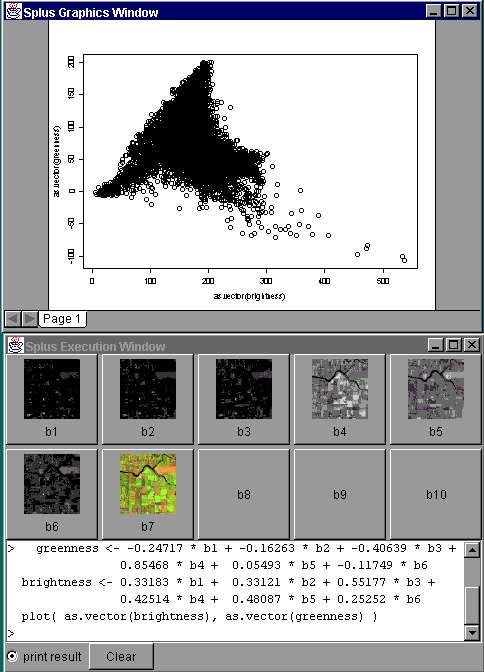
Figure 17. S-PLUS Computation of Kauth-Thomas Tasseled Cap of Vegetation Cycle.
The combination of S-PLUS and GeoBrowse features creates a unique environment for interactive exploration and analysis of remotely sensed data. The rich statistical functionality of S-PLUS, together with the GeoBrowse User Interface and the scalability of its data mining engine, allows for easy and powerful customization of the data analysis process.
The user can create new image types, and can extract image features using the GeoBrowse Data Manager. The data manager utility also enables loading of remote sensing and DEM data from a file system to the database, browsing of meta-data about image features, and editing of the feature descriptions. Intuitive dialogs guide the user through the specification of features necessary for their extraction, the creation of data types, and the loading of data.
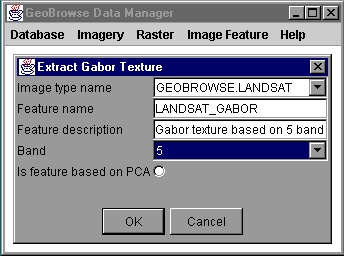
Figure 18. GeoBrowse Data Manager.
In order to increase the speed of similarity searches we are planning to incorporate VA-file indexing [19]. In the preliminary the use of VA-file index increased the speed of similarity searches up to 7 times in the comparison to the same searches without the index.
We plan to perform experiments using multiple level spatial transformation methods for progressive refinement using more level than tile, region, and pixel levels. Multiscale image coding techniques, such as wavelets, can also be used for the analysis of images on multiple levels. Such multilevel information can be combined with the auxiliary data in both vector and raster formats to enhance the data analysis capabilities of GeoBrowse. These auxiliary data can be used both during feature extraction process and during data mining process.
The quality of land cover classification can be improved using time series of data, which can better differentiate between different types of crops due to the seasonality of crop growth. We also plan to provide the functionality of multilevel presentation of the knowledge discovered. For example, the system should allow a user to see the generalized summary of the areas of particular crops by county, state, region, etc.
We have designed, and are in the process of implementing, the GeoBrowse system for data mining of remotely sensed images. Three levels of feature are extracted from image tiles and used in the data mining process. In addition to simple queries based on simple properties, such as geographic location or acquisition date, a user can submit queries based on feature vectors describing the images. Interactive training of the classification models that describe new types of objects can be easily performed. Scalability to the large databases is addressed through indexing of the feature vectors and by using scalable data mining algorithms in the query processing. Our region level indexing strategy enhances the data analysis and similarity search processes by allowing for the more refined classification of information derived from images. GeoBrowse can convert large quantities of multispectral satellite imagery into GIS format. The results of image segmentation are stored in the raster format in any database and in vector format in Esri's Spatial Data Engine (SDE). Other Esri products, such as, ArcInfo, ArcView, and MapObjects can access the data stored in SDE together with additional map data. The GIS, optical and DEM information can be combined together in order to be used in a variety of visualization methods and data analysis functions. The functionality of S-PLUS software can be interactively accessed from GeoBrowse and data can be transferred to and from S-PLUS system for further processing and visualization.
Funding for the prototype comes from NASA SBIR Phase II contract NAS5-98053. Data was provided by PRISM.
[1] Adams, J. B., M. O. Smith, and P. E. Johnson, Spectral Mixture Modeling: a New Analysis of Rock and Soil Types at Viking Lander 1. In J. Geophys. Res. 91:8113 - 8125, 1986.
[2] Fayyad, U. M., and P. Smyth. Image Database Exploration: Progress and Challenges. In Proc. 1993 Knowledge Discovery in Databases Workshop, Washington, DC, p. 14 - 27, 1993.
[3] Fountain, S. R., T. N. Tan, K. D. Baker. A Comparative Study of Rotation Invariant Classification and Retrieval of Texture Images. In On-Line Proceedings of the Ninth British Machine Vision Conference 1998. http://www.bmva.ac.uk/bmvc/1998/index.htm.
[4] Gillespie, A. R., M. O. Smith, J. B. Adams, and S. C. Willis, Spectral Mixture Analysis of Multispectral Thermal Infrared Images, In Proceedings of the 2nd Thermal IR Multispectral Scanner Workshop, JPL Publication 90-55:57 - 74, 1990.
[5] Han, J., Y. Fu, W. Wang, K. Koperski, and O. R. Zaďane. DMQL: A Data Mining Query Language for Relational Databases. In Proc. of the Workshop on Research Issues on Data Mining and Knowledge Discovery, Montreal, QB, pp. 27 - 34, 1996.
[6] Hayley, G. M., and B. M. Manjunath, Rotation Invariant Texture Classification using Modified Gabor Filters, In Proc. of IEEE ICIP95, pp. 262 - 265, 1994.
[7] Koepfler, G., C. Lopez and J. M. Morel, A Multiscale Algorithm for Image Segmentation by Variational Method, SIAM Journal of Numerical Analysis, vol. 31, pp. 282 - 299, 1994.
[8] Koperski, K. A Progressive Refinement Approach to Spatial Data Mining. Ph.D. Thesis. Simon Fraser University, 1999.
[9] Patel, J., et al. Building a Scalable Geo-Spatial DBMS: Technology, Implementation, and Evaluation. In Proc. ACM-SIGMOD International Conference on Management of Data, Tucson AZ, pp. 336 - 347, 1997.
[10] Schröder, M., H. Rehrauer, K. Seidel, and M. Datcu. Interactive Learning and Probabilistic Retrieval in Remote Sensing Image Archives. In IEEE Transactions on Geoscience and Remote Sensing, Sep. 2000, Volume 38, No. 5 pp. 2288 - 2298.
[11] Shek, E. C., R. R. Muntz, E. Mesrobian, and K. Ng. Scalable Exploratory Data Mining of Distributed GeoScientific Data. In Proc. of The Second International Conference on Knowledge Discovery & Data Mining, Aug. 2-4, Portland OR, pp. 32 - 37, 1996.
[12] S-PLUS 2000 Programmer's Guide, Data Analysis Products Division, MathSoft, Seattle, WA, 1999.
[13] Stonebraker, M., J. Frew, K. Gardels, and J. Meredith. The Sequoia 2000 Storage Benchmark. In Proc. ACM-SIGMOD International Conference on Management of Data, Washington, D.C., pp. 2 - 11, 1993.
[14] Szalay, A., P. Kunszt, A. Thakar, J.Gray, D. Slutz, and R. J. Brunner. Designing and Mining Multi-terabyte Astronomy Archives: The Sloan Digital Sky Survey. In Proc. ACM-SIGMOD International Conference on Management of Data, Dallas TX, pp. 451 - 462, 2000.
[15] Haralick, R. M., K. Shanmugam, and T. Dinstein. Textural features for image classification. In IEEE Transactions on Systems, Man, and Cybernetics, vol. SMC-3, no. 6, pp. 610-621, November 1973
[16] Laws, K. I. Rapid Texture Classification. In SPIE Image Processing for Missile Guidance, vol. 238, pp. 376-380, 1980
[17] Jensen, J. R. Introductory Digital Image Processing: a Remote Sensing Perspective.Prentice-Hall, 1996.
[18] Kaufman, L. and P. J. Rousseeuw. Finding Groups in Data: An Introduction to Cluster Analysis. Wiley, New York, 1990
Krzysztof Koperski
Insightful Corporation
1700 Westlake Ave. N, Suite 500,
Seattle, WA, 98109-3044 USA
(206) 283-8802 Ext. 243
krisk@insightful.com
Giovanni B. Marchisio
Insightful Corporation
1700 Westlake Ave. N, Suite 500,
Seattle, WA, 98109-3044 USA
(206) 283-8802 Ext. 280
giovanni@insightful.com
Karrie Meyer
Insightful Corporation
1700 Westlake Ave. N, Suite 500,
Seattle, WA, 98109-3044 USA
(206) 283-8802 Ext. 312
kmeyer@insightful.com