This paper presents the Geographic Information System (GIS) implemented for the Northeast Ohio Regional Sewer District’s Southerly CSO Phase II Facilities Planning Project in Cleveland, Ohio. The GIS software, including ArcInfo, ArcView, Spatial Analyst, 3-D Analyst and ArcSDE, was integrated with Oracle 8i to manage and use the project data. The sewer system network was created and maintained using ArcInfo and ArcView GIS linked to Oracle via ArcSDE. Parameter development for hydraulic and hydrologic modeling was automated using Spatial Analyst and 3-D Analyst. Data views in Oracle were established to create input files to the MOUSE hydraulic collection system model, and to link model output and modifications back to the GIS for visualization and analysis.
The Northeast Ohio Regional Sewer District (NEORSD) is completing the last of three major facilities plans to address combined sewer overflow (CSO). The NEORSD owns, operates and maintains three wastewater treatment plants with a combined average daily flow of about 235 million gallons (MG), and a combined wet-weather peak capacity of 1.5 billion gallons per day (BGD). The NEORSD is also responsible for the interceptor sewers, which are large diameter conveyance sewers, and CSO regulating structures. To comply with National Pollutant Discharge Elimination System (NPDES) permit requirements and the Environmental Protection Agency’s (EPA) CSO Control Policy, the NEORSD is required to prepare a Long-Term Control Plan (LTCP) to minimize pollution impacts from CSOs.
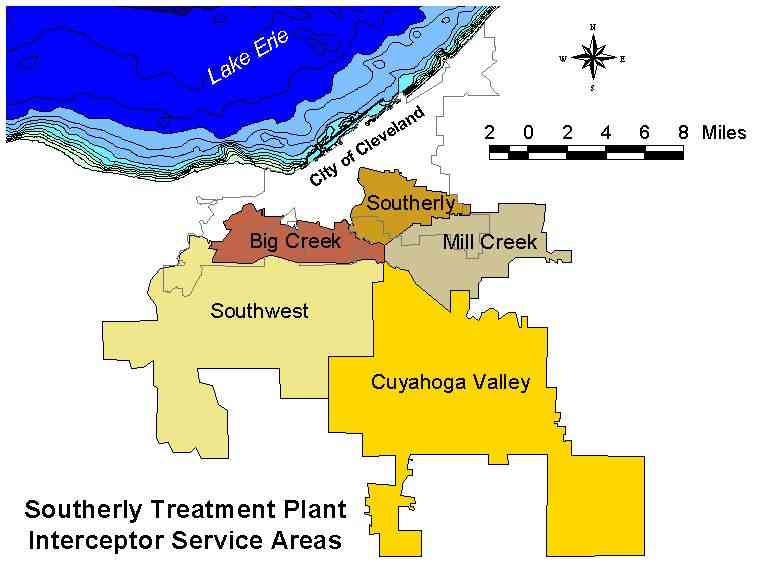
The Southerly District CSO Phase II Facilities Planning project addressed CSO problems in the NEORSD’s largest service area. The Southerly Wastewater Treatment Plant (WWTP) is fed by five interceptor systems, including: Big Creek, Southerly, Mill Creek, Cuyahoga Valley and Southwest. These interceptor systems serve approximately 600,000 people over a 170,000-acre service area. These systems are illustrated in Figure 1.
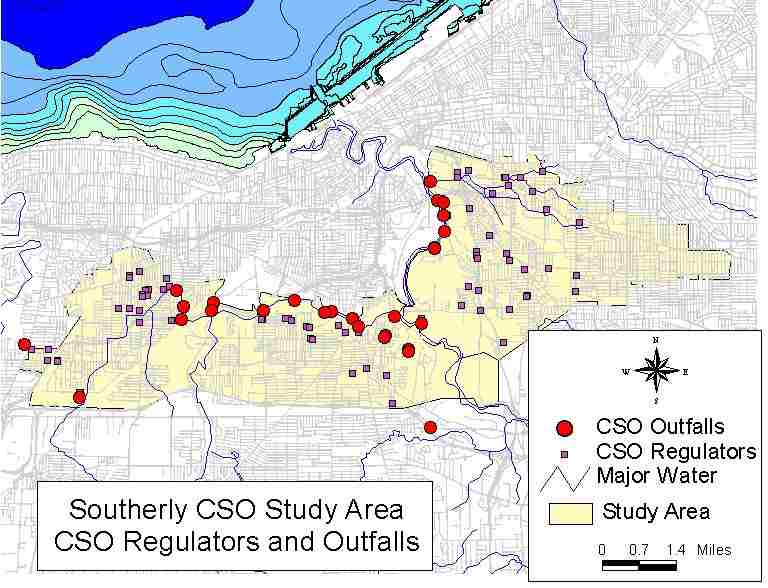
The Southerly District CSO Facilities Planning project focused on the Big Creek and Southerly interceptor systems. The Mill Creek system was addressed under a separate study, and the Southwest and Cuyahoga Valley systems are serviced entirely by separate sewers, thus having no CSOs. The Southerly CSO facilities planning area contains 26 permitted CSO outfalls fed by 86 CSO regulating structures, as illustrated in Figure 2.
The facilities planning process is divided into four major steps, consisting of:
This paper describes how the project team successfully leveraged GIS during the Southerly CSO Facilities Planning project. This is accomplished by describing the various components of the project’s GIS, how the GIS is integral to the planning process and the benefits that are realized by using a GIS.
The Southerly CSO Facilities Planning project GIS was designed with four primary goals:
These goals directed both the development of the GIS data requirements and hardware/software infrastructure.
CSO facilities planning requires detailed land base data, which was used to characterize the ground surface. Sub-surface sewer infrastructure data was necessary to provide a framework for capacity assessment and evaluation. Operational data, such as flow and rainfall data and physical conditions, served to unite the above and below ground data by helping define how the system responded during dry and wet weather using predictive models.
Realizing these distinct data needs, a hardware and software sub-system was assembled. The project GIS consisted of the following:
The physical design of the project GIS is illustrated in Figure 3.
The server also functioned as the primary file server and Intranet server (Microsoft IIS 4.0) for the facilities planning team’s project office. Therefore, bandwidth and memory are higher to accommodate the extra network traffic.
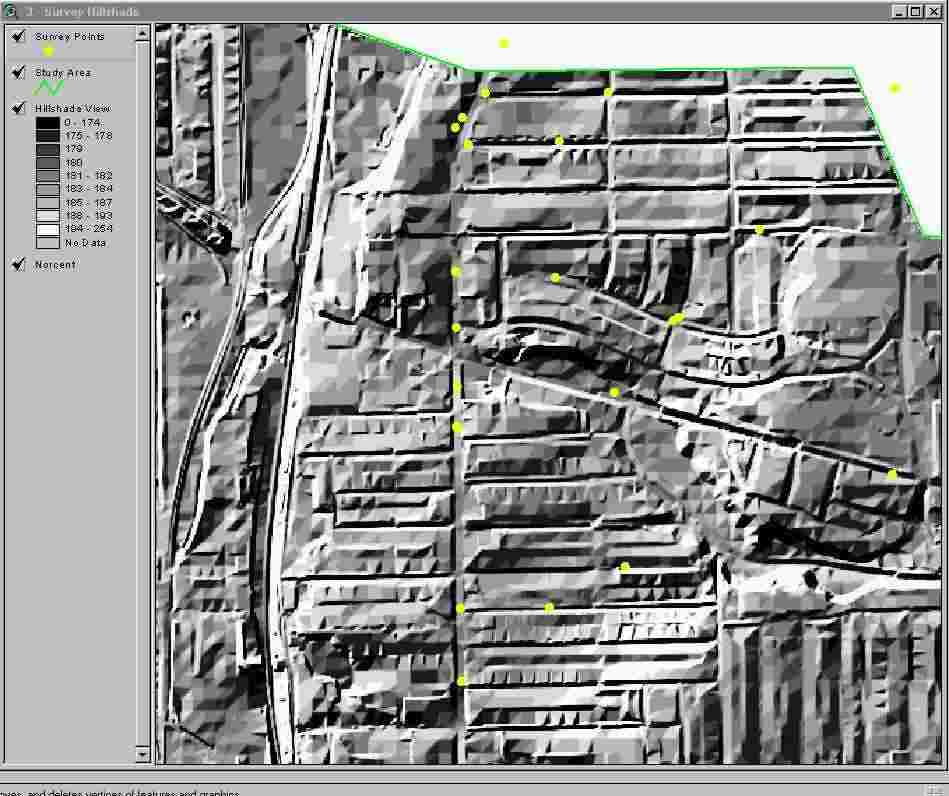
The NEORSD is fortunate to have significant basemap data available for the study area. The project area is situated completely within Cuyahoga County, Ohio. The Cuyahoga County Engineer’s office coordinated the production of 1:200 scale orthophotos of the entire County, and subsequently produced planimetric base mapping and a digital terrain model (DTM) using ground survey control in 1993, as shown in Figure 4.
Parcel boundaries, owners, land use and value were obtained from the County Auditor. The locations of specific sites that might impact facility recommendations, such as historical sites, regulated sites and industrial discharge locations were obtained from State, Federal and local agencies. Once the available data was obtained, reviewed, documented and determined reasonable, it was loaded into ArcSDE and made available for project use.
The NEORSD has taken extensive efforts to survey, inspect and assess the internal condition of the sewers under their ownership. Using this data, the NEORSD was able to develop the layout and connectivity of the interceptor system. To complement the interceptor data, the local sewers that connect to the NEORSD’s facilities were digitized to serve as preliminary data source, prior to beginning the project.
The Southerly CSO planning area consists of over 12,000 manholes and nearly 550 miles of sewer within a 19,000-acre area. Characterizing the sewer infrastructure is very costly. Physical inspection and global positioning system (GPS) survey were performed in areas where information was inconsistent, conflicting or missing. This information was combined with the NEORSD facilities data to produce a topologically correct representation of the entire collection system.
A subset of the collection system, consisting of NEORSD interceptors, facilities downstream of regulating structures, larger diameter local sewers and problem areas, were selected for evaluation in the hydraulic model (approximately 4,500 out of the 12,000 manholes). This subset, representing almost one-third of the sewers in the study area, required a similar level of data as was available for the NEORSD facilities. Detailed manhole and pipe characteristic data was available for the NEORSD facilities (approximately 1,500 out of the 4,500 manholes to be included in the computer model). This left the project team requiring data for approximately 3,000 of the 4,500 modeled manholes and pipes.
Since it was not cost-effective to inspect every structure, record drawings were obtained for the required information. The project GIS was used to facilitate data entry, verify elevation data and document record drawing sources. To expedite data entry, custom dialog boxes were created, as illustrated in Figure 5.
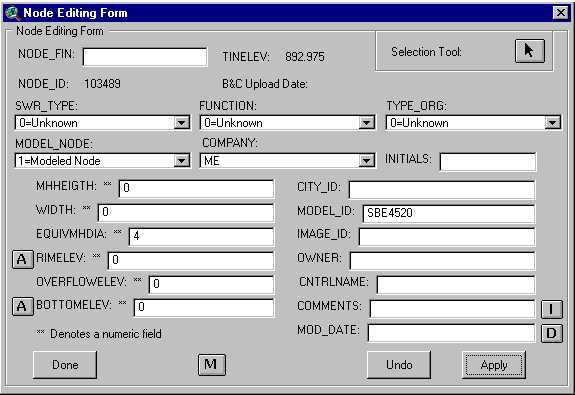
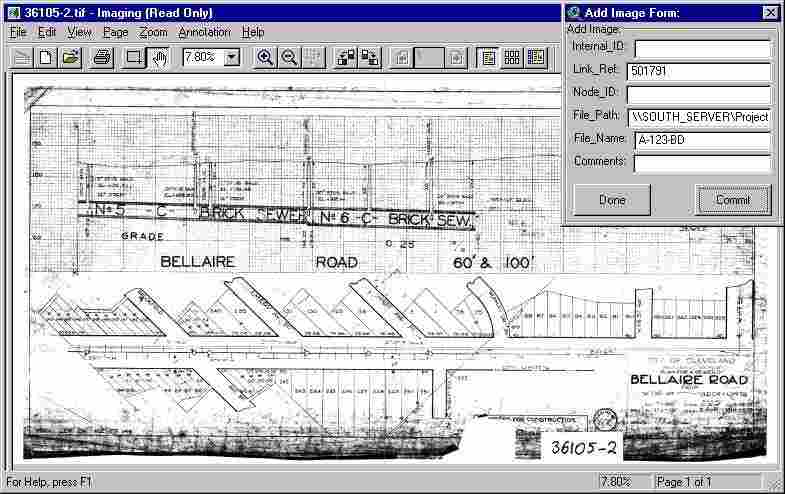
These dialog boxes not only made data attribution more efficient, but also helped maintain data quality through predefined combo box selections that adhered to the NEORSD standards. The attribute editing forms were also provided with the ability to document the name of the record drawing from which the data was obtained. The result of this provided documentation of the model development that could be accessed during subsequent planning and design, as shown in Figure 6.
Sewer hydraulics are more sensitive to elevation changes than horizontal variations. Therefore, when survey data, and in some circumstances, record drawing elevations were unavailable, manhole rim elevations were obtained from the GIS. This was accomplished using the available TIN data and ArcView 3-D analyst. Manhole locations were placed over the DTM surface, and the vertical elevation was transferred to the nodes. Approximately 500 manholes were field surveyed to 0.2 feet vertical accuracy using GPS methods. A comparison of these elevations to the interpolated DTM elevations for the manholes indicated a median difference of less than 0.5 feet, increasing the confidence in the DTM data.
Modeling of the collection system was performed using MOUSE for pipe hydraulic simulation and SWMM RUNOFF for simulation and calibration of hydrologic conditions. SWMM RUNOFF requires initial values for several factors for each of the 430 defined basins. Initial values were obtained using the GIS. The percentage of directly connected impervious area (percent DCIA) is required for each storm water basin for RUNOFF to estimate the volume of runoff.
Parcel data was used to estimate a percent DCIA for each basin. Each parcel carried a land use code corresponding to one of hundreds of planning use names. These land use codes were grouped into similar hydrologic land use classifications and merged according to classification. A percent DCIA value for these hydrologic land use classifications was estimated. This final land use coverage was intersected with the final basin delineations to create area-weighted percent DCIA values for SWMM RUNOFF for each basin.
An alternative method of calculating percent DCIA was also employed using the GIS. Merging transportation features (roads, bridges and highways) with building footprints created an impervious area coverage. These features typically contribute the highest amounts of direct storm water runoff to a combined sewer system. Once the features were merged into a polygon coverage, the percentage of each basin’s area represented by this coverage was calculated and defined as percent DCIA. In most cases, the differences between both methods were within five percent. In the instances where the differences were more substantial, the impervious area calculation typically proved more indicative of the final calibrated values.
An average overland flow path slope is required for each basin within SWMM RUNOFF. This value was automatically determined through an intersection of basin areas with Cuyahoga County DTM data. This was accomplished by taking the DTM data and creating an elevation grid. The elevation grid was intersected with the basins and the slope of each grid cell within the basin was calculated. Using the number of cells within each basin, the average basin slope was calculated. To verify this procedure, basin slope was manually obtained for some of the basins using available ground contour elevations following SWMM guidelines. The results proved to be very similar, with the automated GIS procedure being repeatable.
Additional parameters required by SWMM RUNOFF included basin width, soil infiltration and depression storage. Automated GIS procedures for the calculation of basin width were evaluated, but due to the irregular shape of urban sewer basins, results were somewhat erratic. Therefore, basin width was calculated manually during this project. However, an automated process would be ideally suited to areas with more uniformly shaped basins. Standard infiltration parameters must also be applied, along with a single value for depression storage expressed as a function of the basin area.
The MOUSE model requires very specific input data formats that differed from the NEORSD attribute standards. To accomodate this, several cross-reference tables were created in Oracle and used to produce dynamic views of the SDE feature data that could be loaded directly into the MOUSE model. This direct and dynamically updated method was preferred over loading point and line shape fields through the MOUSE GIS module, which would have required a separate ArcView SQL-connect to the Oracle views. Once the hydrologic and hydraulic models were loaded, they were calibrated using monitoring data, which will not be discussed in this paper.
The adjustment of hydrologic and hydraulic model parameters is necessary for calibration of the models to simulate actual conditions. To keep the source GIS data consistent with the models, it was necessary to update the Oracle tables. The model data was used to create new tables in Oracle. Update queries were written to update the SDE tables to the final calibrated values.
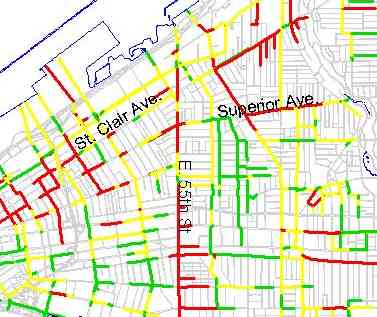
The GIS also facilitated the analysis of system capacity issues using the MOUSE GIS module. This module allowed the evaluation of system performance for both pipe surcharge analysis and flooding potential. Combined sewers in the NEORSD service area were assessed to determine their conveyance capacity. For example, the five-year storm event was evaluated to assess whether surcharging or flooding of the sewers occurred. To visually assess the sewer performance during a five-year storm simulation, model results were displayed and colored according to flow depths as a percentage of the pipe diameter. Less than 50 percent indicated available capacity in the sewer, while 50 to 100% indicated that the sewer was at or near capacity. Sewers exceeding 100% are surcharged and prone to structural deterioration. These sewers were flagged for relief sewer evaluation, as shown in Figure 7.
A similar process was used for evaluation of basement/surface flooding. The peak hydraulic grade elevations at each manhole were subtracted from the manhole rim elevations. Differences greater than ten feet were not considered to have flooding potential. Elevations within 10 feet and above ground surface are prone to cause basement and surface flooding respectively. To validate the flooding analysis, complaint records for basement flooding were obtained for a large storm event and geocoded in ArcView. Areas of high complaint density typically coincided with probable flooding areas.
The GIS was used to support new facility siting and route analysis. Using the parcel data obtained from the county Auditor’s office, publicly owned open land was identified for possible construction access locations. In cases where public land was not available, property values were used to evaluate potential easement purchase costs. Finally, selected routes were evaluated for proximity to areas of concern, such as EPA-regulated sites and historical places.
The use of the GIS during the Southerly CSO Facilities Planning project provided the NEORSD with several benefits, which include: