Alan M. Smith, MPH, PhD (C); Leslie Upledger Ray, MA, MPPA; Dale L. Cooper; Patti Akers, MA; Patricia A. Murrin, RN, MPH
Increased border enforcement efforts close to populated areas of San Diego County have led to concern about a possible increase in deaths and injuries related to environmental exposure in the region's eastern mountains and deserts. This paper examines the geographic distribution of exposure-related illness over time and demonstrates how GIS may be used for emergency medical response planning and applied to injury prevention efforts in rural areas. Emphasis will be given to the interactions of the international border, climate, and proximity to populated areas.
The county of San Diego is home to a diverse range of climates, from beaches and wetlands to deserts to mountains. While the area is known for the mild weather close to the beaches, the deserts and mountains farther inland have seasonal temperature variations from below freezing in the winter to over 110 degrees in the summer. Elevation ranges from sea level to above 6,000 feet, equivalent to the elevation of Denver, Colorado.
The area is also home to the busiest international border in the world. The introduction of Operation Gatekeeper in 1994 increased border enforcement efforts closer to populated areas. In 1998, the San Diego region had 16 percent of the nation's illegal border crossing apprehensions, down from 45% prior to Operation Gatekeeper. This has raised concern that migration patterns would simply shift to the less populated inland region, with a consequent increase in injuries and deaths to immigrants attempting to cross the desert.
From 1996 through 1999, paramedics responded to 197 patients who were suffering from environmental exposure throughout the county. During the same time period, 79 people died from the effects of exposure. Especially high risk for exposure exists for immigrants traveling on foot from Mexico, recreational hikers, and people working in high-risk occupations such as fire fighting or construction.
We examined the geographic distribution of deaths and ambulance responses due to environmental exposure in San Diego County from 1996 through 1999. We also looked at the relationship between victim activity and time of year as well as type of exposure (hypo- vs. hyperthermia) and the likelihood of survival.
Fatal cases of exposure were examined using data from the County of San Diego Medical Examiner's office. Paramedic responses to exposure victims came from the San Diego County Prehospital database. Although some cases may have appeared in both data sets, paramedics in San Diego County are not required to respond if a patient is obviously dead. Patients with exposure to water were excluded from this analysis.
Mapping was performed using ArcView 3.2. For chloropleth maps showing number of victims for distinct areas of the county, a dBase file was created in which the number for each area was assigned to the corresponding geographic code. This database file was then incorporated into the ArcView program and linked by area type (e.g., zipcode or subregional area) to the shapefile (layer) for that area type using the "join" command. Numbers were grouped into categories representing equal value intervals, and the category for each area was plotted with a representative color scheme. Dot maps of deaths were produced by manually geocoding each location from medical examiner records.
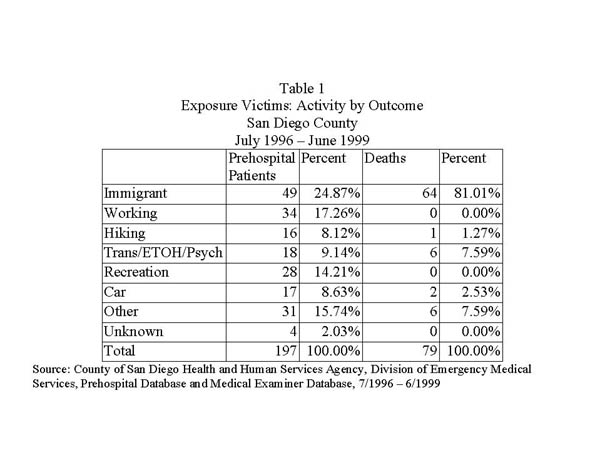
Table 1 shows the patient activity by outcome to environmental exposure. Out of 79 exposure deaths investigated by the San Diego County Medical Examiner from July 1996 through June 1999, 64 (81%) died while travelling into the United States from Mexico. During the same time period, county paramedics saw 197 patients for exposure. Again, immigrants were the largest single group, comprising 25% of these patients. Other activities that placed people at risk for exposure-related illness included firefighting (8%), hiking (8%), or other strenuous recreation such as running (9%). Nine percent of patients had contributing factors such as homelessness, influence of alcohol or other drugs, or psychiatric episodes.
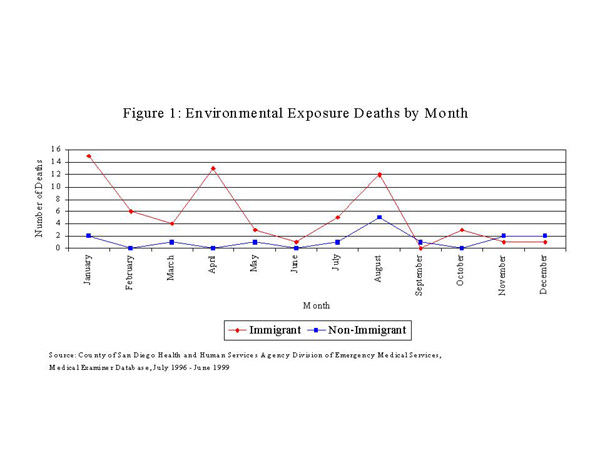
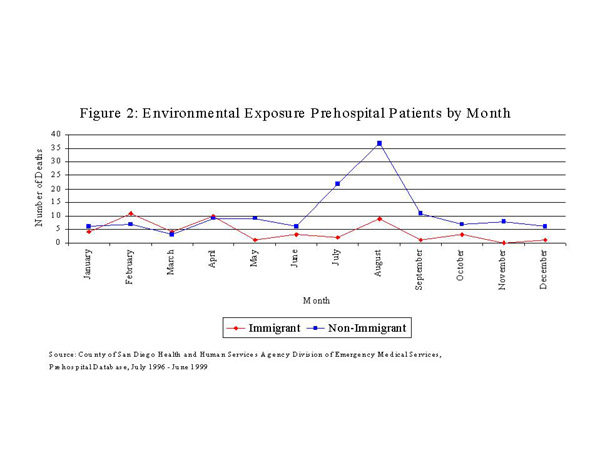
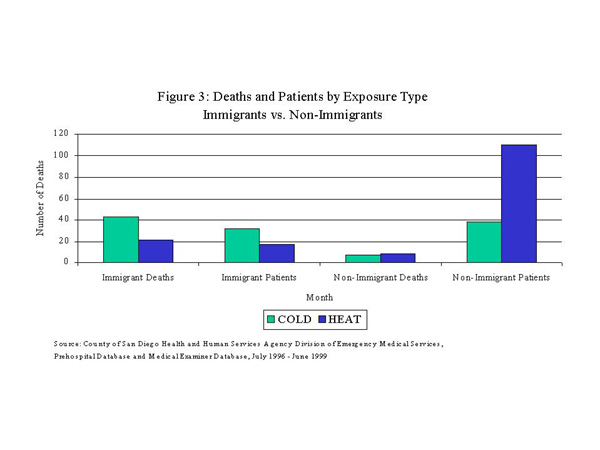
Figure 1 compares the number of exposure deaths by month for immigrants and non-immigrant victims. In contrast with residents, who tend to suffer more during the summer months, 59% of immigrant exposure deaths occurred between January and April. The same distribution was seen among prehospital patients, with 59% of immigrant patients seen during the first four months of the year versus only 19% of U.S. residents (figure 2). As a result, immigrants were more likely to suffer from cold exposure (67%) (figure 3), while the majority of deaths involving U.S. residents were caused by exposure to hot conditions (cold to hot risk ratio among immigrants vs. non-immigrants: deaths = 2.34, patients=5.45).
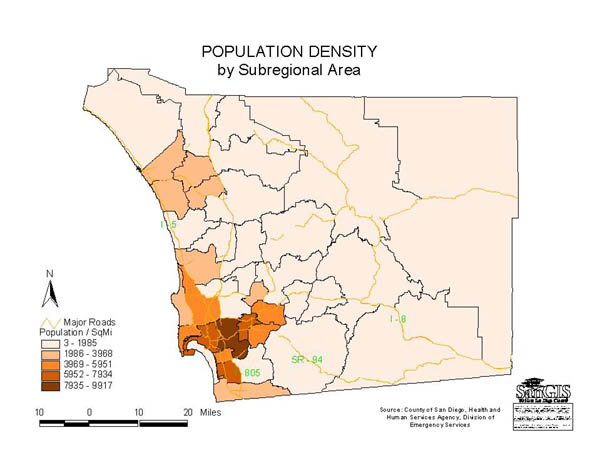
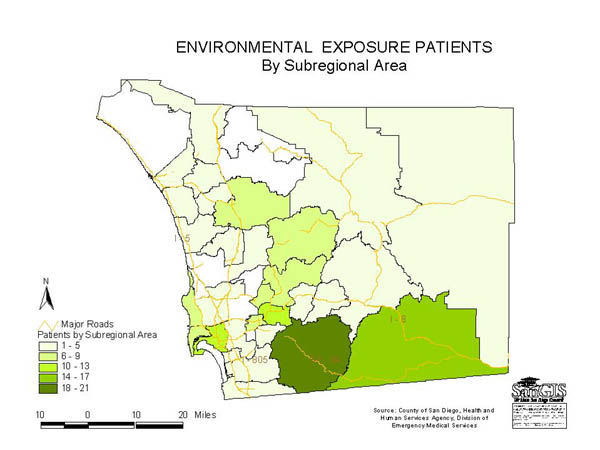
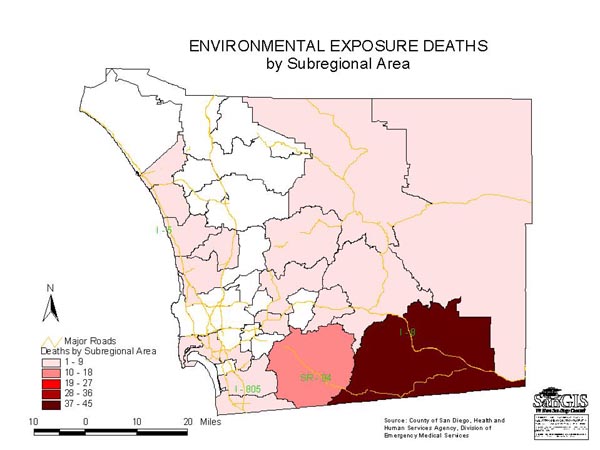
The map in figure 4 illustrates the distribution of exposure deaths (dots) against a gradient that represents population density. The Mountain Empire region, which has a population density of only 14 residents per square mile, had the most exposure deaths. Ambulances, meanwhile, responded most often to patients in the area of Jamul, which is adjacent to Mountain Empire, but is much more populated, with 56 residents per square mile. The ratio of deaths to patients was highest in the Mountain Empire region in the southeast area of the county, with nearly four deaths for every patient. This excessive danger can be explained by the fact that this is a much larger, more rural area, which encompasses a large national forest region. The isolation of this region and distance from medical care is exacerbated by the fact that most of the victims avoid contact with authorities, so are not found until it is too late. Exposure among residents was most likely to occur in the inland suburban areas that experience wide temperature ranges, but are relatively close to populated areas and medical assistance.
The data presented here was a preliminary effort to characterize the distribution of exposure illness and death in San Diego County, and to illustrate how GIS may be used in conjunction with climatological data to try to reach exposure victims in time to save them.
Based on this data, immigrants traveling across the US-Mexico border are at greatest risk for environmental exposure problems. This is attributable to the fact that they travel long distances over harsh terrain with minimal supplies while trying to avoid contact with border enforcement authorities in the United States, resulting in a high risk of a severe outcome. U.S. residents, on the other hand, experience exposure-related illness most often while participating in recreational activities or while working. Exposure among residents occurs in situations where help is fairly readily available, and is much less likely to result in a threat to life.
Efforts to protect immigrants have included water stations placed at strategic locations in the desert, and the distribution of survival kits to immigrants by the Mexican government. These interventions are useful mostly to prevent heat-related problems. Our data, however, show that more immigrants succumb to difficulties with cold weather, so prevention efforts with this group should involve the provision of warm clothing and education on cold-weather survival.
Alan Smith, Epidemiologist, email asmit1he@co.san-diego.ca.us
County of San Diego, Health and Human Services Agency, Division of Emergency Medical Services, 6255 Mission Gorge Rd, San Diego, CA 92120, phone: 619.285.6429, fax: 619.285.6531