Abstract. Enrollment forecasts are important to school districts for planning, resource allocation, and gathering support for bond issues. The Population Research Center at Portland State University produces enrollment forecasts for many school districts. These forecasts make extensive and varied use of GIS tools. The use of GIS in different models and contexts will be illustrated, using case studies for two Oregon School Districts. The districts are: Portland, a large metropolitan school district suffering declining enrollments, and Bend-LaPine a medium sized district in one of the most rapidly growing areas in Oregon. Using GIS and the right model results in better forecasts.
The main goals of this paper are to provide a brief introduction to the techniques of school enrollment forecasting, to show how GIS tools are used in this effort, and to show how the varying geographic context argues for different approaches. To attempt all of this in a short paper is a major undertaking. Consequently the forecasting methodology will be shown in a bare bones way and the emphasis will be on the contribution of GIS to the forecasts and the need for varied approaches.
The Population Research Center (PRC) at Portland State University provides a variety of demographic services. One of these is the development of enrollment forecasts for school districts. These studies are done under contract to school districts, or in some cases to consulting firms providing planning, engineering, and architectural services to the district.
Two recent studies by PRC provide the basis for this paper. One study was carried out for David Evans and Associates who were providing planning services to the Bend-LaPine School District. This District is located in one of the most rapidly growing areas of Oregon. The amenities of the region are attracting individuals and firms from elsewhere in Oregon and throughout the West to its high desert climate, skiing, and other outdoor amenities. The other study was for Portland Public Schools, Oregon's largest school district with over 200 schools and special programs. Enrollment in Portland Public Schools has been declining for the past 15 years as its urban neighborhoods house fewer families. This contract involves an ongoing relationship with the District for the provision of demographic services. Both districts are struggling, one with growth, the other with decline, but both provide quality educational services. Neither District looses a large proportion of its students to private schools. In the paragraphs that follow I will refer to the two districts as "Portland" and "Bend".
Several different types of models can be utilized to produce school enrollment forecasts. The Portland and Bend studies use elements of the five models listed below. However the various models are given different emphasis and are used in different ways in the two case studies. The models are listed below in simple outline form but will be explained in somewhat more detail in a following paragraph. The length and purpose of this paper do not allow a full explanation of each model.
There are a number of considerations that affect how an enrollment forecasting model is designed. The size of the school district, the problems that the district faces, and the overall level of sophistication of planning in the community are important factors. Two factors that require some clarification for the purposes of this paper are described below. One issue involves the spatial and temporal scale of the forecasting effort and the other involves whether forecasts initally are made by where the students attend school or by the students' place of residence.
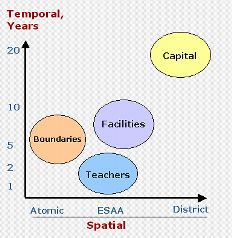
The time horizons for enrollment forecasts can extend from a year for a purpose such as teacher assignments up to 20 years for facilities planning.
Portland One year forecasts were required for the purposes of teacher assignments. Ten-year forecasts were required for the evaluation of schools and programs for possible closing and consolidation. These forecasts were required at the level of the individual school including the 80 plus elementary schools. In the case of school closings and program consolidations forecasts of tendencies were developed at the block level to assist with the redrawing of school boundaries.
Figure 1. The diagram below illustrates the range of spatial and temporal scales that need to be considered in a school forecasting model
Bend The forecast horizon extended from about five years to twenty years into the future. The shorter time horizon was intended to forecast crowding in existing schools. The longer term was mainly important in terms of land acquisition for new schools. Between five and twenty years the forecasts were important in terms of the phasing of new school construction. Forecasts were developed at the level of existing school boundaries and on a finer scale using a grid map. However, the growth in the Bend District is so rapid and the quantity of buildable land so large that the location specific aspects of the forecasts needed to be qualified.
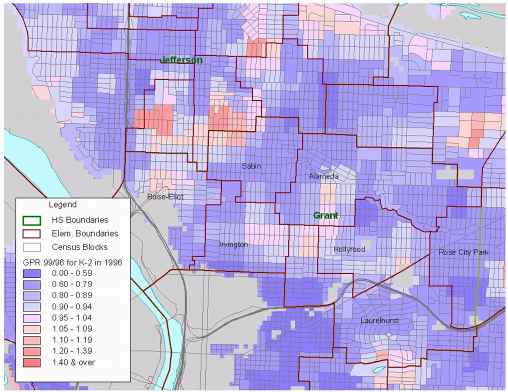
Figure 2. The maps below illustrate the range of geographical scales for which forecasts can be made, ranging from the entire school district, to school attendance areas, to blocks, to tendencies for individual households

Forecasts were initially developed based on the residential locations of students. Then the students by residence were allocated to the school that they were likely to attend, using an allocation table based on what school students attend and where they reside. There are two main advantages to this approach.
To back up a bit, a simpler way to do produce enrollment forecasts is to use attendance at particular schools as a basis for the forecast, basing the forecasts based on where the students attend school. This simpler approach works reasonably well if the schools fit into a neat hierarchy of elementary schools feeding into middle schools, and middle schools feeding into high schools with simple many to one relationships. It works best where students are required to attend their home school and few attend schools outside of their attendance area boundaries.
Bend. Boundaries for the elementary, middle, and high schools did not match, having been adjusted on numerous occasions to balance the attendance at various schools. In addition due to the rapid rate of growth it can be expected that the existing boundaries will change a number of times during the next ten years.
Portland. Attendance area boundaries are quite porous with many students attending schools outside of their home school attendance area. In some cases this may be a matter of parental choice where for a variety of reasons they prefer their child to attend some school other than the home school. If there is room in the school and if the parents can get the child to school, such a transfer is usually possible. In addition Portland has over 100 formally designated magnet, alternative, and special programs that draw students from all over the District.
In the remainder of the paper we will walk through the several forecasting models mentioned above and discuss some of the differences between the Portland and Bend case studies and how GIS tools were used. Most of the emphasis will be on the "grade progression" and "housing based" models since they are most useful for small area, sub school district, level projects and they best illustrate the application of GIS tools.
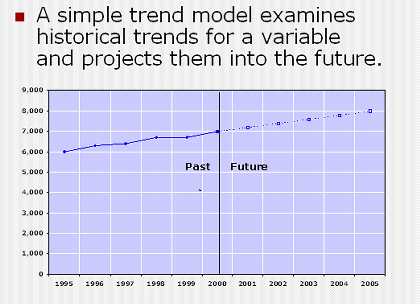
The simple enrollment growth trends for Portland and Bend catch the eye of the casual observer. Bend is growing rapidly. Portland is slowly but steadily shrinking. By and large a simple straight-line trend would have adequately predicted short term changes over the past decade. However such a model would not have sufficed to forecast the changes in grade level mix or shifts in special program enrollments, which are determined in part by changes in school programs. More could be said about simple trend models but not in the context of this paper.
Figure 3. Simple Trend Model
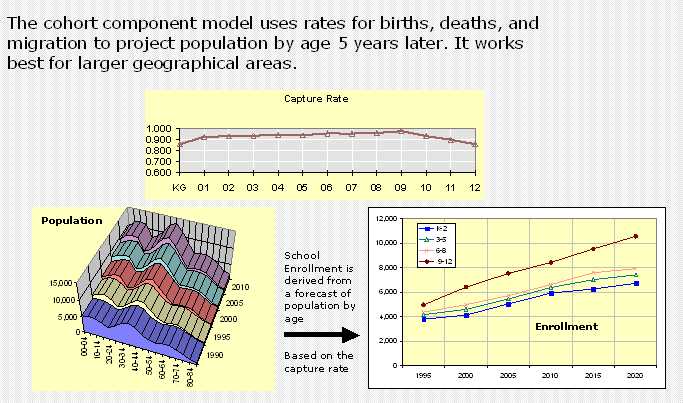
The cohort component model is based on the premise that the numbers of births, deaths, and migrants can explain the change in a region's population. The model is formulated on an age specific basis and steps the progress of age cohorts (often 5 year age groups) through time, adding births to the first cohort, adding or subtracting migrants, and as the cohort ages subtracting more deaths. Fertility rates and the numbers of women in the 15-44 year age groups determine numbers births in the model. Age specific net migration is determined indirectly from census data and by validating the model by testing a forecast for a recent past period, say from 1990 to 2000. School enrollment is calculated as a share of the school age population using a "capture rate". Many school enrollment forecasts begin by developing a district-wide forecast based on a cohort-component model. Finding the supporting data for smaller areas is difficult.
The final results of the cohort-component model are fed back through a "grade progression model", explained more fully below. The reason for this is to closely link the first years of the forecast by grade level to the last year of known enrollment data. If his is not done, the first years of the forecast often have some small "hiccups" which are soon discovered.
Figure 4. Population is forecast intially by the cohort model and then converted to enrollment by the "capture rate".
The use of GIS tools for this model mainly involved creating the forecasting data base consisting of age/sex data from the census, births for the forecast area, and students geo-coded to their place of residence. Most of the GIS work was "pick and shovel" but needed to be done accurately and completely, especially the geo-coding.
Bend. The Bend enrollment forecast began with a cohort-component model for Deschutes County, of which the Bend District comprises about 70 percent. The overall rate of growth for the District was a matter of some local controversy. The local reaction to the high rate of population growth has been mixed with many in the local business community strongly advocating growth but many residents hoping that not one more person would move to Bend. An important first step in the enrollment forecasting process was to determine some range of growth rates that bracketed likely outcomes and exercised the concerns of the District over long term commitments to bond issues, construction, and land acquisition. The cohort-component model was helpful in that it linked enrollment growth to broader growth issues in the community. It also directly addressed the issue of the age structure of migrants to Bend. It appeared that many of the households moving to Bend were in their early 30's rather than in their 20's, bringing older children and having fewer children and thus having a diminished effect on school enrollments.
Portland. The Portland District is about five times the size of Bend. It has nine regular high schools and one large magnet high school. The cohort-component model was applied at two levels for Portland: (1) district-wide and (2) for the nine high school attendance areas. The district-wide model was important in informing most of a year's consideration by the School Board regarding whether they really did need to consider closing schools and consolidating programs. The high school level forecasts were used to capture some of the dynamics of racial and ethnic changes and the impact on births. It also allowed the model to show the effects of changing households, particularly the impact of one-person households and large numbers of young single persons concentrated in certain parts of the city. Age specific birth rates were not known for the high school attendance areas but could be inferred by testing assumed birth rates in the model against actual numbers of births occurring in the area. These analyses rested upon the geographically detailed database constructed through the use of GIS tools.
The grade progression model is a relatively simple model based on enrollment trends. It sometimes is called the "cohort progression" model and is the approach to enrollment forecasting most commonly taught to school administrators. Whereas the "cohort-component" model was based on the progression of age cohorts of the population, the "grade progression" model is based on the progression of grade level cohorts. For example, it considers the changes in the numbers of students in grade 5 compared to the number in grade 4 the previous year. If there are more students in grade 1, then there must be a gain from in-migration or a net gain from private schools. The ratio between the current and prior year cohorts is known as the "grade progression ratio". The average of these ratios for the past few years can be used to progress the current student population to the next year, the year after than, and so forth.
Figure 5. The tables and graphs below show an example of a district-wide grade progression model.
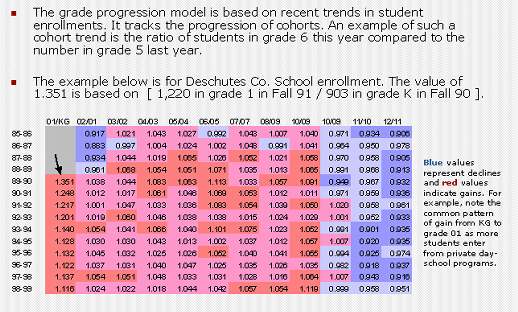
Figure 6. The graph below illustrates an application of the grade progression model for the Bend School District. The grade level trends below and to the left of the yellow line are forecast foreward.
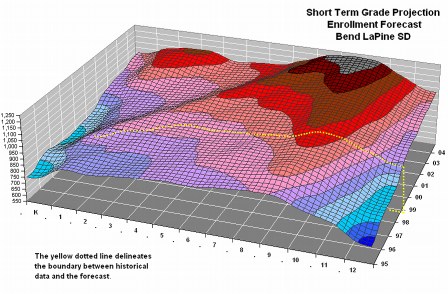
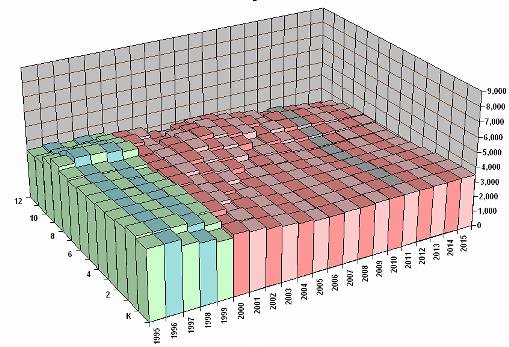
Figure 7. By contrast to Bend the forecast for Portland shows declining enrollments at all grade levels.
The grade progression model also can be applied to smaller geographical areas, such as school attendance areas or even smaller planning areas. This brings us back to the issue previously described as "by residing" and "by attending" forecasts. If the District has a strict policy of requiring home school attendance, there are few students in magnet, special, and alternative schools, and the attendance areas nest neatly a "by attending" forecast may be possible. If the circumstances are more complex, then an initial "by residing" forecast is preferred. The "by residing" forecast requires the construction of a geo-spatial database and considerable effort in geo-coding of the students.
The grade progression model can be applied to very small areas through the use of "grid cell" techniques that are used to generalize trends for the geo-coded point data. In ArcView Spatial Analyst these are created using the density function to create a grid theme. Due to the uneven spatial distribution of the students the averages created by Spatial Analyst were somewhat unstable. Therefore a different approach was used to create the grid maps. The CrimeStat software package, developed by the U.S. Department of Justice for crime analysis contains a gridding routine with an "adaptive bandwidth". Rather than searching to a fixed radius, say a mile, it searches until it encircles a threshold of points, say 200 students. Using CrimeStat's adaptive bandwidth provided more consistent gridding results across the range of dense urban, suburban, and rural densities. The results from CrimeStat were saved in an ASCI format and imported into ArcView. The main disadvantage of CrimeStat is that it's computations are laborious and that a dense grid and many points can result in very long computation times.
Figure 8. The map below shows an implementation of the grade progression model for Bend for grid cell areas using the CrimeStat software. The map shows the change over two years in the cohort that was in grades K-3 in 1997. The areas in red represent increases, those in blue declines.
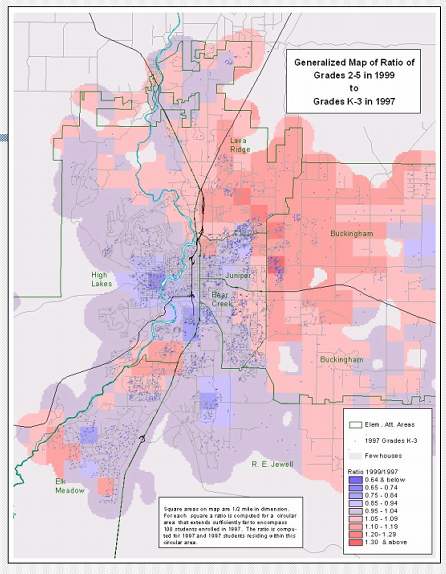
Bend. The grade progression model was used for district-wide and grid level enrollment forecasts. At the district level, the grade progression forecast fell near a cohort-component forecast illustrating the continuation of current growth. The grid level maps were based on geocoded student data for 1997 and 1999, showing short term growth tends by grade level. These maps were effective in differentiating the areas of growth for different grade cohorts. Rapidly growing suburban areas with modest priced housing showed growth for the lower grades. Areas with new but expensive housing tended to show more growth at the upper grade levels. However, what the maps tended to show was where recent growth occurred, not where growth would occur next year or in the next five years.
Portland. The grade progression model was used for elementary school attendance areas and grid level enrollment forecasts. The use of the model in Portland was different from how it was used in Bend. In Portland significant levels of housing construction occurred in only a few areas of the District. There were a few areas of steep land with concentrations of new homes. There was a significant amount of in-fill, redevelopment, and conversion types of housing but the localized impacts of this were only significant in a few areas. The main factors influencing enrollment changes were the changing types of households in existing housing. Increasing numbers of one person, single parent, elderly, and non-family households resulted in fewer households with school age children. Conversely, in some areas of the District increasing minority populations with younger households were producing more children. These trends are not easily observable and not recorded in the tax-lot database or other easily accessible administrative records. In contrast to the moving wave nature of housing on the suburban fringe of Bend, changes in households generally progress more slowly with trends that continue over a number of years. Therefore, the grade progression trends for Portland were used more directly in forecasts than in Bend.
Figure 9. The map below shows a map for Portland created in a similar way to the map for Bend above. It shows the change in the 1996 grades K-2 to 1999. The areas of growth are in red and the areas of decline are in blue. By contrast to Bend, most of the Portland area shows declines. There are, however, a few areas where increases have taken place mainly due to housing turnover and change in ethnic or racial composition. The grid cell calculations on this map have been transfered to the nearest block.
At the time of the study, data from the 2000 census were not available, but data from the American Community Survey were (to the block group level). The geo-coded student data by grade, age, and race provided some of the best information about possible factors causing shifts in enrollment. The release of the 2000 Census will be a big help in understanding demographic changes, but as the years pass the student record data will again become more important.
Forecasting school enrollment based on housing growth has a simple appeal. A special tabulation of the 1990 Census (the School District Data Book) provides some insights into the relationships between housing types and numbers of school children. One of the tables in this tabulation shows the relationships between housing type and tenure and the numbers of students.
Figure 10. Example of table from School District Data Book source showing cross tabulation of housing types and school age children.
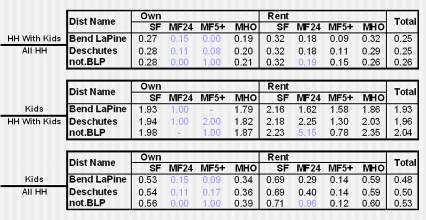
The top part of the table shown above shows the proportion of housing units of various types with school age children for the Bend-LaPine School District and the remainder of Deschutes County. The numbers in light blue are based on a small number of housing units. Note that the highest proportion of children is found in rental single-family housing and the lowest in larger apartment developments. The middle table shows the average number of children for units that house children. This number does not vary much and averages about two. The bottom table shows the product of the two tables above. It shows that on the average about occupied housing units in the District and the County contained an average of 0.5 school age children. One can use these numbers as a basis for a forecast linking school enrollment to the numbers of housing units of various types. There are a couple of problems with this approach. First, we don't usually have year-by-year histories of housing units that include this kind of detail about housing types and tenure, much less housing forecasts with this type of detail. Second, having attempted to apply this model in simple form it does not track well will know changes in enrollment.
Another approach to the use of housing trends relies on the use of GIS to develop relationships between school enrollment and housing. This approach assumes that a tax-lot database is available in GIS format and contains basic information on type of housing, year built, and housing values. The geocoded student record data are linked by proximity to the tax-lots. If the student data have been geocoded totally or in part to tax-lot addresses the accuracy of the match is improved. The table below shows an example of this type of relationship for an attendance area fragment for the Bend School District. It provides information about the grade level mix of students residing in recently built and older housing. The ratios for the most recently build housing suggest the numbers of students that might occupy newly built housing in this area. The numbers in the older housing alert one to anticipate shifts in the household composition of these older units as this may affect school enrollment.
Figure 11. Cross tabulation of housing type and enrollment by grade for Bend School District from student enrollment and tax-lot data.
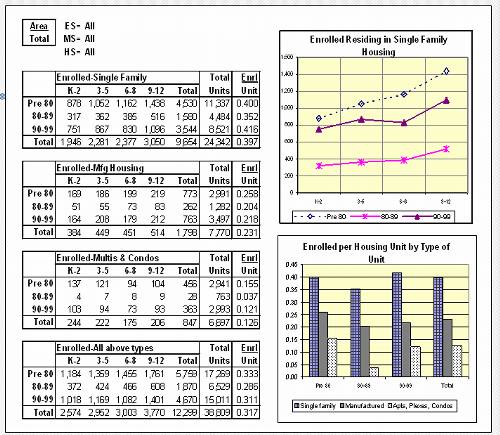
Bend. The type of data shown in the table above was presented visually for each of 23 "attendance area fragments" for the District. Enrollment forecasts were made for the numbers of grade K-12 students residing in each of these areas. The data in the table above along with other types of information were evaluated in making the "by residing" enrollment forecast for each area. Some of the other information included numbers of vacant lots in existing subdivisions, other vacant lots, vacant acreage, and zoning of parcels. This information was integrated with the data in the table above in a judgmental way to produce the enrollment forecasts. Likely housing development trends along with student-housing relationships were the main factors that informed the forecast.
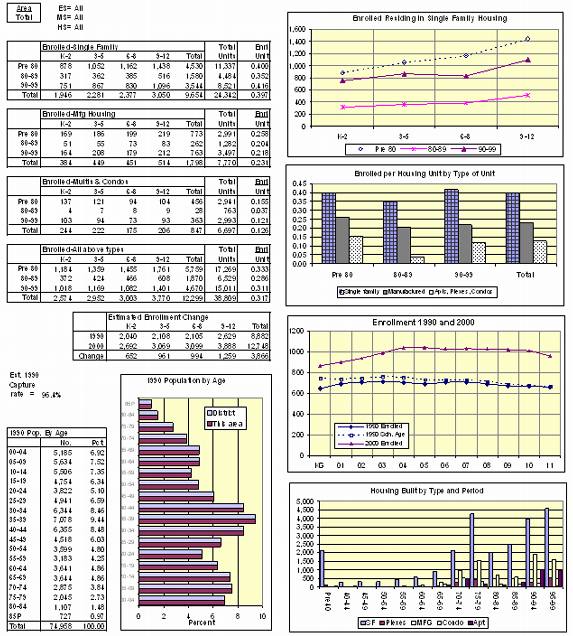
Figure 12. The table below is an example of the summary data tables that was developed for each attendance area fragment in the Bend School District. The data in this table were consulted when making the forecasts.
Portland. A similar data summary page to that above for Bend was developed for each of the 83 elementary school attendance areas in Portland Public Schools. However, the detailed tabulation of students to housing was not done for this study at the time the forecasts were made. Forecasts for grades K-12 for Portland were made using a grade progression model at the elementary school attendance area level with the numbers adjusted to sum and to be consistent to the cohort-component forecasts at the high school attendance area level. The model presented an opportunity for manual adjustments to the grade progression ratios, based on judgments based on data in the statistical summary and other factors, but due to the large number of forecasts the forecasts generally resulted from the runs of the models with no intervention.
Since the development of the first set of forecasts for Portland the District has contracted with our Center for ongoing demographic services. As a result of this, we are developing a more detailed and accurate database to support forecasting and queries. Some of the key features of this database are:
Improving the quality of our forecasts and reducing the costs of this effort are the main reasons for designing and constructing this database. However, when it is constructed it may be helpful in answering some broader questions about the relationships between housing and student enrollments such as:
CrimeStat was developed under the direction of Dr. Ned Levine of Ned Levine & Associates, Annandale, VA ,with a grant from the Office of Research and Evaluation, National Institute of Justice
The School District Data Book: 1990 Census School District Special Tabulation was developed by the National Center for Educational Statistics.