Surveys are prized in market research because they provide primary data on potential customers and statistically valid findings. Yet, GIS gets little use in survey research, perhaps because surveys rely on small statistical samples, posing challenges for data-hungry GIS applications. Nevertheless, GIS can add value to several stages of survey research, including research design, data analysis, and reporting. We'll illustrate how with several examples from surveys of the market for higher education. Examples will be general enough to apply to other contexts and will be insightful both for clients and practitioners of survey research.
The current era of declining governmental support and changing demographics is forcing many public colleges and universities to abandon the "if we build it, they will come" mentality. Instead, public institutions of higher education are beginning systematically to think about and understand their markets - something private and for-profit colleges, not to mention businesses, have been doing for some time.
The University of Wisconsin System has taken on this task through the creation of the Market Research Unit, which serves the 13 four-year universities and the 13 two-year colleges in the UW System. The unit works as an internal consultancy for admissions offices and individual academic departments and also coordinates system-wide market research projects. The five full-time staff members - of whom the author is one - provide services ranging from focus groups to analysis of nationally-collected educational and occupational statistics. A major portion of the unit's activities, however, is survey research projects.
This paper discusses some of the ways our office has used GIS in survey research. GIS has many applications in business geography: geodemographics and market area analysis are two. It's our impression, though, that GIS is not widely used in survey research, even though, in our experience, GIS can be used to:
After a brief review of the survey research process, this paper will discuss these four contributions of GIS to survey research. Although the contributions are illustrated with examples from market research in higher education, they have relevance for market research in any industry context.
[Return to Contents]As with all research, survey research begins with identifying a problem and posing it as a research question. In higher education, a typical problem might be "Freshman enrollments are down." The research question might be "What do college-bound high school students think of us?"
Once a research question has been established, the appropriate research tool must be chosen. The advantage of survey research based on random sampling methods is that survey results are more representative of the population being surveyed, allowing us to generalize our findings beyond the group of people who responded. In contrast, focus groups or informal surveys based on "convenience" samples (e.g., visitors to a web site) cannot be considered statistically representative. Although random-sample surveys can be time-consuming to design and field and/or costly to implement, survey research is the best tool for acquiring reliable information to guide strategic decision-making.
The survey research process includes the design of a survey, the acquisition of a sample, the fielding of the survey, and analysis and presentation of results.
Survey design involves writing the questions for the survey. These questions are designed to collect information on the attitudes and characteristics of respondents. Often, a key objective is to compare attitudes or characteristics among different groups of respondents, such as the attitudes of males vs. females, or the demographic characteristics of "satisfied" respondents vs. "not satisfied" respondents. In addition, survey design takes into account characteristics of the population being surveyed and the method of fielding the survey - traditional mail, telephone, email/Web, or some combination.
Generating a survey sample involves acquiring a sampling frame of the population. The population is the group of people that we want to make generalizations about: for example, college-bound high-school students. The sampling frame is, in theory, a list of the entire population. A practical sampling frame for the population of college-bound high school students might be a list of students who have taken a standardized college admission test like the SAT or the ACT. Often, it can be very difficult to get a sampling frame that adequately captures the population you wish to survey, and the quality of the sampling frame can have a big effect on the success of a research project. From the sampling frame, a sample, or a subset of people, is chosen through either a simple random sample or a more elaborate sampling method. The sample is the group of people who will be surveyed.
Once the survey is designed and the sample is acquired, the survey is fielded through one of the methods mentioned above. While the survey is in the field, several contacts or reminders are typically used to increase the response to the survey. After an adequate response is collected, the data are compiled, analyzed and reported.
GIS contributes to several stages of this process. In the survey design phase, GIS aids in the understanding of the population being surveyed. GIS also can be used before and after the survey is fielded to make the survey more representative of the population. [1] In the analysis phase, GIS assists in examining regional differences and spatial behavior among respondents. And in the reporting phase, GIS helps communicate findings.
The remainder of this paper illustrates these contributions with examples from several different research projects. To protect client confidentiality, all identifying information has been omitted. Details of some examples have been simplified for greater clarity. And, in a few cases, examples are composites of more than one study.
[Return to Contents]A common, but unfortunate, mishap in survey research is to ask the wrong questions of the wrong people. This pitfall is easy to stumble into when the sampling frame does not adequately capture the intended population, or when the population is not well understood.
A way to avoid this mishap is to inspect the sampling frame during the survey design phase, assessing its quality and making sure any assumptions about the population are borne out in the sampling frame. GIS is a convenient way to examine the geography of the sampling frame, and by extension, the population. Doing so can prevent mistakes like the following:
A four-year college that mostly serves Wisconsin residents wants to assess their image among college-bound high school students. But the mailing list, bought from an academic testing service, included a substantial number of out-of-state students, from as far away as Georgia and California. The response rate from the out-of-state students - most of whom, presumably, had never even heard of the college - was too low to be usable.If the list had been examined carefully before the mailing began, a correct sample focusing on in-state students could have been requested, and the resources wasted surveying the wrong people could have been put to better use.
Sometimes, the sampling frame captures the right population, but the population isn't properly understood:
A university in a small-town in Wisconsin is developing a professional Master's degree for health care professionals. The university surveys members of a professional organization who work in Minnesota and Wisconsin. But these health care professionals are all located in major cities, and express little interest in commuting several hours to attend classes in a small town, when competing institutions in their cities already have comparable programs.In this situation, understanding the geography of the population ahead of time might have influenced the design of the survey. These health care professionals could have been asked about interest in distance education (e.g. via the Internet) or about their perceptions of competing degree programs closer to home.
GIS isn't absolutely necessary to examine the geography of a survey population. But mapping the sampling frame can make some errors - like the presence of out-of-state students - immediately obvious. It also can encourage creative thinking about who your population is and how they might respond to your survey.
[Return to Contents]Surveys are conducted to gather information about a population. If the responses to the survey can't be generalized to the population, the results are no better than anecdotes - worse, perhaps, because they may imply statistical reliability that isn't there. GIS can be used with one method of increasing the generalizability of surveys, post-hoc sample balancing.
The main obstacle to generalizability is non-response bias. In other words, people who respond to the survey may have different characteristics and attitudes from those who do not respond. In our traditional mail surveys, we've found that females typically respond at higher rates than males. When this happens, survey results run the risk of being more representative of females' opinions than males'.
The simplest way to minimize non-response bias is to increase the response rate. If everyone is surveyed, there is no non-response bias! However, a census is much more expensive than a survey, and the ethical issues of repeatedly contacting people who prefer not to answer a survey must be considered as well.
Another way to minimize non-response bias is to re-survey a subset of the non-respondents and compare their responses to those of the initial respondents. This approach is subject to the same drawbacks as surveying everyone, albeit to a lesser degree.
The most cost-effective way to alleviate non-response bias is post-hoc sample balancing, or weighting the survey's respondents to reflect their true proportions in the population (or, in practice, the sampling frame). For example, to adjust for an under-response among males, each male respondent would be weighted slightly more than each female respondent. [2]
Just as survey respondents can be weighted by gender or race, they can be weighted by geographic region, ensuring that the survey results are geographically representative of the population. Having a survey that is geographically representative can be important in any study assessing the awareness of a place or institution. Consider this example:
A campus in western Wisconsin enrolls a large number of students from Minnesota and is interested in its image in both states. The campus surveys prospective students from the region. Happily, respondents report a high awareness of the campus. But response rates from Minnesota are noticeably lower than from Wisconsin, and it turns out awareness of the campus in Minnesota is low as well.Should the campus ignore the geographical differences in response rates and conclude that they enjoy quite a high degree of recognition in their region? Doing so would be misleading, because the overall awareness would be more representative of Wisconsinites than Minnesotans - and Minnesotans are an important part of the population the campus wants to understand.
Should the campus expend additional time and money to re-survey prospective students in Minnesota? This would be the best option if resources are available and the same group of prospective students can still be reached. Usually, though, it's hard to meet even one of these criteria, much less all of them. Money may not be available for another survey, or enough time may have passed that the prospective students have already enrolled at a college or university.
The most practical option in this situation is to weight the respondents to match the population that was surveyed. Weighting respondents by region accounts for the awareness among prospective students from Minnesota, but does not require the resources and ethical dilemmas of re-surveying non-respondents.
In our research, we routinely weight our survey respondents. Among the characteristics we use for weighting is geographic region. To weight by geographic region, we use GIS to map the sampling frame, examine its geographic distribution, and then delineate regions that make conceptual sense and have roughly equal numbers of sampling units. Once the survey data is collected, we compare the proportions of respondents in each region to the original proportions in the sampling frame, and weight the respondents to match the frame.
GIS can also be used to create regions for stratifying a survey. A key objective in most survey research is to compare attitudes and characteristics among different groups in a population. For example, it may be important to see if the attitudes of males differ from females, or if the perceptions held by whites differ from those of other races.
Making comparisons requires sufficient numbers of respondents from each group. If a group represents only a small fraction of the population, then a simple random sample may not produce enough responses. A simple random sample of Wisconsin high school students, for example, would probably not include enough Native American students to compare them statistically to Caucasian students.
A solution is to generate a stratified random sample by drawing a simple random sample from each group. This way, a greater number of people in the smaller groups can be surveyed, ensuring an adequate number of respondents in each group for comparative analysis. The drawback of a stratified sample is that it increases the cost of the survey.
A sampling frame can be stratified by geography as well as by demographic characteristics. If a university wanted to compare the perceptions of its in-state students to its out-of-state students, it might choose to stratify the sample to make sure enough out-of-state students were surveyed. A GIS would not be necessary to do this, but it could be useful for stratifying a sample based on more complex geographic criterion. For example, if an urban commuter school wanted to understand the experiences of students who travel an hour each way versus those who live nearby, a GIS might be the easiest way to divide the sampling frame into the two groups.
[Return to Contents]GIS is eminently useful as a data visualization tool, but its capabilities also make it useful in data analysis. Thus far, we have found GIS to be useful in the analysis of statistical differences among regions and in the analysis of spatial behavior of respondents.
[Return to Contents]As mentioned in the previous section, it's often desirable in survey research to test for statistical differences in attitudes or perceptions among groups of respondents. These groups might be chosen by demographics: When choosing a college, do males say "campus life" is more important than females? Or, these groups might be based on attitudes or preferences: Do students who say they are "not satisfied" with course scheduling options work more hours a week then students who are "satisfied"?
GIS can be used to test for differences among groups based on location. A simple approach is to group respondents into regions that make conceptual sense, such as metropolitan areas. As long as each region has a sufficient number of respondents, regional differences in attitudes or characteristics can be tested.
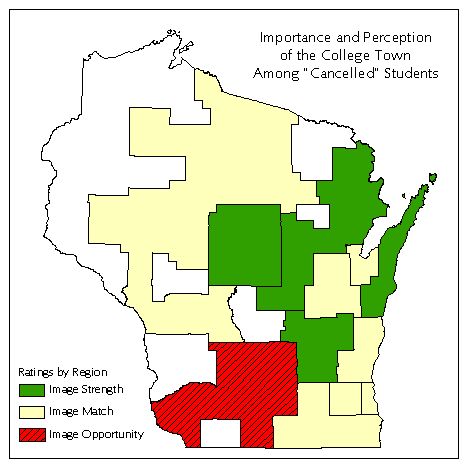
A college suspects that New Freshmen who "cancelled" their admission and decided not to attend did so because they didn't want to live in the town where the campus is located. A phone survey of these "cancelled" students revealed that, overall, students' perception of the town was on par with its importance to them. In other words, on average they were satisfied. Good news for the college! A closer look, though, revealed that "cancelled" students from one part of the state did in fact have a poorer image of the town, while students in other parts of the state felt more positively. Still good news overall - but now the college has additional insight about its image across the state.The map below illustrates these findings.
Quite often, variations in attitudes and preferences are better explained by demographics than by location. Although demographics and location are often correlated when looking at small areas like neighborhoods, surveys typically don't have enough respondents in a neighborhood to test for statistical differences. As a result, attitudinal differences that are tied to demographics won't necessarily show up as regional differences.
Attitudes that do differ from region to region tend to be inherently influenced by location.
One example is the awareness of a place or an institution. Not surprisingly, awareness tends to be higher in the immediate vicinity of an institution and lower among people farther away. An example of this situation is the case discussed earlier where a Wisconsin school had lower awareness among prospective students in Minnesota than among in-state prospects.
A second example is the perception of a place or an institution. Even if awareness is high in all locations, images or impressions may differ from region to region, as in the example of the perception of the college town described above.
Third, attitudes about the spatial relationship between the respondent and the place or institution may differ from region to region. As intuition would suggest, high school students that say a college is "too close to home" tend to live closer to the college than those who say the college is "too far away" - although there are plenty of individual exceptions!
[Return to Contents]The contributions of GIS to survey research discussed so far have not involved much higher-level GIS functionality or spatial analysis. Mapping a mailing list and delineating regions might be quicker and easier in a GIS, but a GIS isn't the only way to get the job done. Where survey research can take full advantage of the capabilities of GIS is in the analysis of spatial behavior.
We have used GIS to get a sense of the spatial behavior of potential nontraditional students - students who work full time, live off campus, may have family obligations, and may be older than typical undergraduates or graduate students. Specifically, we have combined survey research and GIS to give us information about the spatial market areas for new degree programs developed for these nontraditional students.
Market area analysis and survey research need not go hand in hand. A business' current market area can be analyzed from a list of current customers. After the customer list is geocoded and mapped, the current market area might be defined as all zip codes with a certain density of customers, or by a fixed radius around the business that includes the majority of the customers. Then, the potential market might be defined as residents within the current market area that have similar demographics as the current customers. The locations of competitors might be added to this picture, and the assumption made that potential customers will prefer the closest option, all else being equal.
Basic approaches like the one above are practical for businesses in industries such as retail, where establishments serve relatively small areas, products have relatively low cost and are purchased with high frequency, and consumer behavior is fairly well understood. In higher education, however, products such as new degree programs can be highly specialized, relatively expensive, and once-in-a-lifetime purchases. Moreover, for many public higher education institutions, consumer behavior - especially among nontraditional students - is not yet well understood, creating a need for survey research.
What follows is an example of a market research project for a new degree program serving nontraditional students. A main goal of the research was information about the potential market for the new program. Combining survey research with geographic analysis provided a more complete picture of the spatial nature of the market than either survey research or geographic analysis alone. Here is the example:
A consortium of universities in the upper Midwest plans to offer a highly specialized graduate degree program for working professionals. Most of the coursework for the degree will be delivered through distance education, but some face-to-face instruction is an essential and necessary part of the program and will take place at the participating universities. The consortium surveys members of a professional organization who are living and working in the upper Midwest.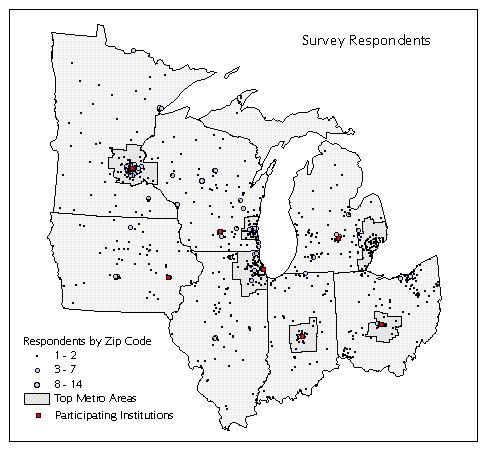
The survey describes the potential program and asks about overall level of interest, preferences about content, scheduling, and delivery, perceived need for such a program, and so on. The survey asks for some basic demographics, including the respondent's zip code. And, to ascertain commuting preferences, the survey asks, "How far would you be willing to drive to attend classes in the proposed program?"
The commuting question gives us information about the potential spatial behavior of each respondent. In a GIS, we start with the location of each respondent, as approximated by the centroid of the respondent's zip code. Then, we use the respondent's preferred commuting distance ("How far would you drive?") to define a commuting area around the respondent's residence. To account for differences between rural and urban areas, we measure the driving distance through the road network. We repeat this process, creating a unique commuting area for each respondent based on his or her location and stated preferences about driving to attend the proposed program.
For example, in the accompanying figure, respondent R1 from Chillicothe, Illinois indicated a willingness to drive 150 miles to attend monthly face-to-face classes in the proposed program. This respondent's potential commuting area extends over much of northern and central Illinois. Respondent R2 from the Springfield area is only willing to drive 50 miles, while respondent R3 from Champaign is willing to drive 60 miles.
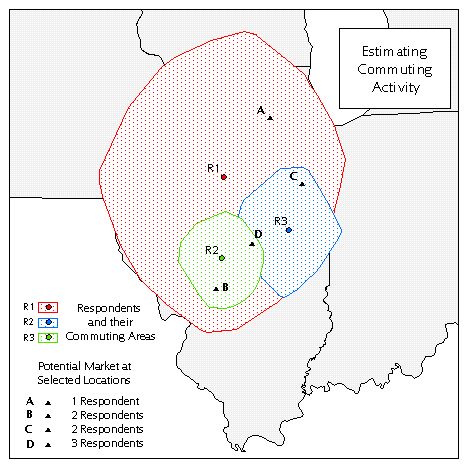
Once the commuting area for each respondent has been defined, the commuting areas are converted into grid (raster) form, overlayed, and summed together. The resulting grid reflects the potential commuting activity in the study area. The value of each grid cell represents the number of respondents who would be willing to commute to a degree program located in that area. Put more precisely, the value of each cell reflects the number of respondents who have that location in their commuting areas.
For example, a grid cell at point A in the accompanying figure is only within the commuting area of respondent R1. Point B would be in reach of respondents R1 and R2. R1 and R3 would commute to point C, while point D is in the commuting areas of all three respondents.
The map generated by this method for the proposed degree program shows areas of high and low potential commuting activity. Potential commuting activity is highest in the cities of Minneapolis-St. Paul, Milwaukee, Chicago, and Detroit - areas where there are lots of respondents.
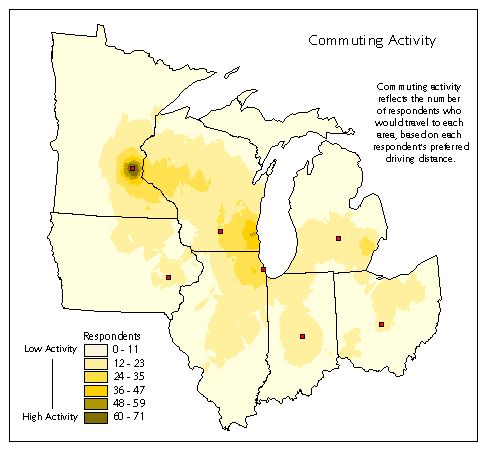
The map of commuting activity tells us something about the potential market areas for the proposed degree program. The Minnesota institution, for example, is located in an area that is within many respondents' driving distance, while the Iowa institution is not. Furthermore, the Detroit area in southeastern Michigan is a greater potential market area for this program than the area around the Michigan institution.
Studying potential market areas with a combination of survey research and GIS provides several benefits.
First, the combined method tells us more about the spatial pattern of demand for the program than the survey alone. The survey question "How far would you drive...?" only tells us that, on average, respondents would be willing to drive 50 miles to attend classes. While this statistic is helpful, it reveals little about who would travel to the institutions offering the new degree program, or where respondents would prefer classes be held. Using GIS to estimate commuting activity adds information about respondents' potential spatial behavior, allowing us to understand which locations would be more accessible or appealing to potential students.
Second, survey research improves a traditional market area analysis because it provides more reliable information about the commuting preferences of respondents. A survey provides information about spatial behavior that is generalizable to the relevant population of interest. Respondents may be willing to travel farther (or less far) to attend classes in a degree program than for other goods or services. Asking respondents directly provides an estimate of the travel distance for attending classes.
A survey also may reveal location-sensitive variations in spatial behavior. Respondents in urban areas may prefer shorter travel distances than those in rural areas. Respondents who live near a competing institution also may indicate a short travel distance, preferring not to travel to an institution farther away. Without survey research to uncover distinctions like these, a market area analysis risks incorrect assumptions about commuting preferences.
In the above example of the new degree program, survey research helped confirm the likely assumption that the best potential markets are located in the urban areas where there are lots of respondents.
Survey research does more than provide better estimates of overall commuting preferences. Adding survey data to traditional market area analysis also provides a better sense of the sizes of potential market areas. By overlaying the commuting areas of multiple respondents, we create a surface on which - at least in theory - the market at each point can be compared to the market at every other point. This estimate is an improvement over eyeballing a concentration of potential customers, picking a location, and drawing a ring to see how many customers fall inside.
For example, if we had only looked at the map of respondents for the degree program, we might not have realized that a broad swath of western Wisconsin is potentially appealing for 24 to 35 commuters. Even if we considered the Interstate highway running through this region, we might have underestimated the potential market in this area.
Although combining survey research and market area analysis has benefits, some limitations remain with the approach taken here. From the survey standpoint, we have gained only a limited amount of information about commuting preferences. We do not know how potential students feel about traveling to specific locations or along specific routes. We do not know whether potential students will commute from home or from work. We do not know whether they would be willing to travel farther to attend a competing program that they value more highly. These limitations can be addressed by writing survey questions to ask for this information, if it is important to the research project.
Some limitations also remain from the standpoint of geographic analysis. We do not know the exact location of respondents (only the zip code centroid), and we do not know the commuting routes they would take. We do not know how accurate a respondent's preferred travel distance really is: If someone says 40 miles, might they really mean only 30 miles, or maybe as many as 50? We also do not know the precision or generalizability of potential commuting activity at any given location. Our overall survey may have an acceptable level of precision and may be geographically representative of the population, but the commuting activity at many locations is based on only a few respondents. Statistics for calculating location-based confidence intervals would be a valuable addition to this analysis.
Despite these limitations, combining survey research and market area analysis produces a richer analysis of potential spatial behavior than either approach alone. In the analysis of spatial behavior, GIS offers survey research its full range of capabilities.
[Return to Contents]The contribution of GIS to survey research requiring the least explanation is its use to communicate findings. This paper has included a few examples of the types of survey results we've found it useful to map:
Caution must be taken in when using maps in reports and presentations, though, because cartographic literacy is not always at the same level as graphic literacy. Typically, people who receive our findings are more used to reading and interpreting charts, graphs, and tables than maps. To account for this lack of familiarity, we try to only include maps in reports and presentations when the map illustrates a point that has significance to the overall study, and the point being made is best illustrated with a map, rather than a chart, graph, table, or text.
These common sense principles apply equally well to charts and graphs. But in addition, we try to make maps that only convey one point or idea. People who are used to comparing two different variables on a chart or graph often have trouble drawing similar comparisons on a map. Even when a comparison between variables can be displayed on a single map following well-established cartographic conventions, two or more separate maps are often more easily understood by an audience.
[Return to Contents]GIS is more than making maps, just as survey research is more than asking questions. Although GIS does not appear to be widely used in survey research, this paper has shown the wide range of positive contributions it can make to the survey research process, from survey design through analysis and reporting.
In the survey design phase, GIS can be used to:
In the analysis phase, GIS can be used for:
And, in the reporting phase, GIS is an effective way of communicating spatial distributions and relationships, especially when each map illustrates a single point of overall importance to the research.
These contributions represent a beginning for the use of GIS in survey research. As GIS increases its inter-operability with statistical and database software, and as market research devotes more attention to geography, additional applications of GIS in survey research will arise.
[Return to Contents][1] During the fielding and data collection phases, we have not found a way to apply GIS - but who knows what possibilities may be there?
[Return to Text][2] Sample balancing is somewhat controversial because it is remediation after the fact. Under no condition is it a solution to severe under- or over-response. However, if each group is adequately represented in the sampling frame, and response from each group is sufficient to ensure a reliable study, then post-hoc sample balancing gives each respondent a slight "nudge" to bring the overall proportions of respondents in line with the population. Applied wisely, post-hoc sample balancing is a practical method of reducing the effect of non-response bias when limited resources preclude more intensive approaches.
[Return to Text]Many thanks to the director and staff members of the University of Wisconsin System Market Research Unit, who supported this research and who reviewed and commented on an earlier draft of this paper. All content, of course, remains the sole responsibility of the author.
[Return to Contents]