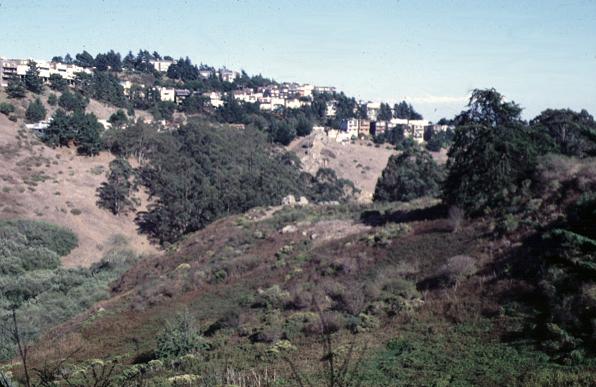
Glen Canyon Park. Photo courtesy of Lisa Wayne, CCSF Recreation & Parks Natural Areas Program
Jerry Davis and Debra Dwyer
Analysis of vegetation patterns and related features in San Francisco City Parks presented
several challenges. For management purposes, polygon samples were interpreted from aerial
photography and field observation for dominant species cover. Field personnel used a
systematic grid of point samples to collect quantitative species counts in plots. In order
to make a complex dataset requiring multiple linked databases accessible for analysis by
conservation biologists, we developed a suite of Avenue scripts and dialog boxes. Analysis
of native and non-native species richness will be used to prioritize restoration projects.
Urbanization presents many challenges for native ecosystems, and we tend to expect that cities are not the place to find healthy native vegetation communities. Urban parks are primarily focused on recreation or possibly open-space values, with little attention to preservation of remnant natural areas. Yet even these degraded ecosystems can yield significant patches of important species, especially in areas of high native diversity and endemism.
The peninsular Franciscan Landscape of San Francisco, California, is a noted hot spot for species diversity (Vasey 2001). Before European settlement, the landscape was a mosaic of coastal scrub, perennial grasses, maritime chaparral, riparian wetlands, with live oak and laurel forests on the rocky uplands and a coastal dune ecosystem covering the lowlands at the northern tip of the peninsula (Vasey 2001). Many endemic species exist in these areas, and we're only starting to understand the effects of population fragmentation (Holzman 2000).
Glen Canyon Park. Photo courtesy of Lisa Wayne, CCSF Recreation & Parks Natural
Areas Program
The San Francisco Recreation and Parks Department has implemented a Natural Areas Program (SFNAP) to restore and enhance the survival of these natural areas. Members of this department hope to minimize the effects of fragmentation by removing invasive, non-native species, and planting vegetation propagated in nurseries from seeds collected in significant natural resource areas (SNRAs) back into SNRAs. Additionally, they enlist volunteers from the local neighborhoods to assist with their mission. They promote and support community-based stewardship to preserve and protect the natural areas.
Significant Natural Areas within the City of San Francisco. Not shown but included
in the data is Sharp Park, to the south in Pacifica. Cartography by Debra Dwyer.
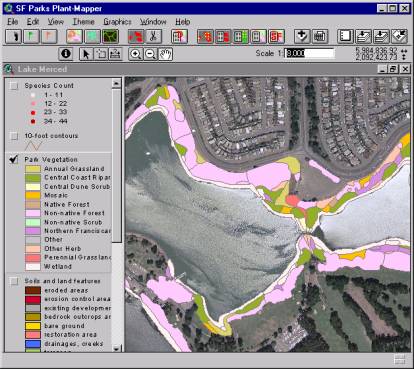
This paper describes the GIS tools being applied to this project. The following sections consider sampling methods, the nature and structure of data layers, and the design of an ArcView 3.2/Avenue interface called SF PlantMapper to be used to help biologists and other park land managers evaluate the current status of the remnant natural areas in the San Francisco municipal parks system.
Development of the data layers utilized by SF Plant Mapper required the coordination of the several organizations. Vegetation field sampling teams were led by Mike Vasey (San Francisco State University Biology), Randy Zebell (EIP Associates), and Lisa Wayne (SFNAP). EIP collected the data regarding soil and land features while the landscape architects of Merrill and Befu Associates collected the data regarding trail alignment and trail conditions. Geotopo, Inc., a surveying firm, digitized the vegetation, the soil and land features, and trails layers, and also generated 10-foot index contours from breakline data provided by the City and County of San Francisco. Finally, Jerry Davis and Debra Dwyer of the SFSU Geography Department and GIS Laboratory coordinated and verified the GIS data, and developed the ArcView/Avenue interface described below.
The initial focus for development of the data layers was to provide the data necessary to formulate individual park management plans that outlined strategies for the protection and restoration of significant natural areas within the city park system. Subsequently, we realized that storing the relevant data in a GIS interface would provide the Natural Areas Program personnel with a valuable tool for monitoring the natural areas and their program’s restoration efforts.
The field sampling/mapping team recorded vegetation characteristics in three ways (1) delineating relatively discrete polygons according to major structural characteristics such as herbaceous, scrub, and forest; (2) recording the cover of dominant species for each polygon, and (3) circular plot sampling for presence/absence and cover data (personal communication with R. Zebell 2001). Polygons were delineated in the field with the assistance of a 2-foot-pixel, true-color orthophotographic base map. These polygons were converted from AutoCad format to an ArcView shapefile by Geotopo Inc.
Circular plots on a random grid of points were sampled in order to assess the distribution characteristics of each species (personal communication with R. Zebell, 2001), using orthophotographic maps overprinted (by Geotopo, Inc.) with a 30-m grid system to determine sampling locations. For each plot, field personnel recorded ocular estimates of cover class, using a system established by the California Native Plant Society (Zebell 2001; CNPS 1998), and listed in table 1. Field teams led by Vasey (SFSU Biology), Wayne (SFNAP) and Zebell (EIP) included students from SFSU Geography and SFSU Biology, and ultimately sampled a 650 circular plots: 1-meter diameter in grassland, and 3-meter diameter in scrub and forest areas.
| Table 1. Cover Class | |
| 1 | less than 1 percent |
| 2 | 1 to 5 percent |
| 3 | 6 to 25 percent |
| 4 | 26 to 50 percent |
| 5 | 51 to 75 percent |
| 6 | greater than 75 percent. |
Not all polygons were able to be point-sampled due to time and budget constraints. In order to record baseline vegetation data in all areas, Vasey (SFSU Biology), Zebell (EIP), and Wayne (SFNAP) also conducted a walk-through of all parks included in the NAP. For each one they identified dominant plant species and ocularly estimated absolute plant cover following categories.
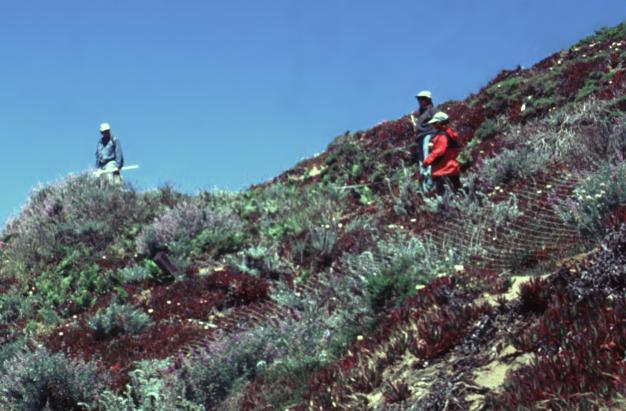
Sampling team. Photo courtesy of Lisa Wayne.
Attributing of Vegetation.shp included assigning vegetation series information -- vegetation series, subformation and formation -- to its attribute table. According to R. Zebell (personal communication 2001), "formations are based on the life form of the dominant species (herbaceous - dominated by herbs; scrub - dominated by shrubs; mosaic - a mix of herbs and shrubs; and forest - dominated by trees), series are based on the identity of the dominant species, and subformations are groups of series that share similar ecological requirements and/or land management histories." Polygons were classified to the series level using the dominant species data from the vegetation polygon walk-through (R. Zebell 2001). Here the subformation classification corresponds to the series used by Sawyer and Keeler-Wolf (1995) and natural community level of Holland (1986). The series classifications are similar to the associations used by Sawyer and Keller-Wolf (1995).
| Table 2. San Francisco Natural Area Subformations |
| Annual Grassland |
| Central Coast Riparian Scrub |
| Coastal Dune Scrub |
| Mosaic |
| Native Forest |
| Non-native Forest |
| Non-native Scrub |
| Northern Franciscan Coastal Scrub |
| Other |
| Other Herb |
| Perennial Grassland |
| Wetland |
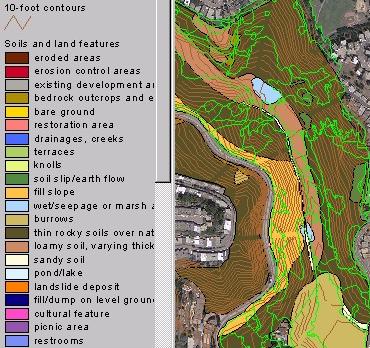
To develop the soil and land features data George Burwasser (EIP) and Sheila Ryan (EIP) conducted walk-throughs of each park included in the SFNAP. The soil and land feature information was drawn onto tracing paper placed over the orthophotographic base map. These data were then digitized by Geotopo, Inc into a CAD file and merged to form one data layer for the entire SFNAP. This CAD file was then converted into an ArcView shapefile called geology.shp. As with Vegetation.shp, there were technical issues regarding the conversion process due to overlapping polygons. The conversion was repeated using ArcINFO and the method described above to create a new geology.shp. An additional attribute table containing geology types and associated verbal descriptions was created and joined to geology.shp. A similar process was used to develop a trails data layer, but relied on Merrill & Befu (landscape architect) personnel for field data collection and interpretation of conditions and features; a remaining challenge is coding into discrete feature records the broad-brush attributes and recommendations characterizing these maps.
A quality assurance team composed of Debra Dwyer (SFSU GIS Lab) and Christopher Campbell (SFNAP) used ArcInfo Workstation to correct the myriad of errors created in the field mapping and (especially the) CAD-based digitizing process: (1) overlapping polygons; (2) double-digitized lines; (3) miscoded polygons; and (4) inaccurately placed boundaries. This process is complete for the vegetation mapping, and currently underway for soil/land feature and trails layers.
The nature of vegetation sample data presents challenges for the interpreter, especially those with limited GIS and database experience. In either a polygon or a sampling plot, multiple species are recorded. That alone means that the spatial attribute table will have a one-to-many relationship with the species data table, forcing the use of links rather than joins. Inexperienced users who try to join to the data table may end up looking at only a small part of their species data.
The purpose of the San Francisco Parks Plant Mapper is to aid Parks personnel in identifying areas for vegetation management and restoration. In this project, spatial point and polygon shapefiles are linked with point-based and polygon-based data tables. These data tables are also joined with additional floristic databases identifying information such as species taxonomy and native vs. non-native status.
The interface provides the following tools:
Importance tables provide a means of testing the validity of polygon classfications,
identifying parks that differ from others in their characteristics, or evaluating the
sampling method . As can be seen in the table above, while Nassella pulchra (purple
needlegrass) is the most abundant species in plots measured for this series in McLaren
Park, this species doesn't show up at all in samples of this series' polygons from Bayview
Park (only 10 species are shown in the figure, but purple needlegrass is also not listed
in the complete table.) Moreover, since the Purple Needlegrass series is part of the
Perennial Grassland subformation, it is surprising that the first perennial grass seen in
the list -- Bromus carinatus -- covers less than 10% of the area. The first
two species in abundance are Vulpia bromoides (six-weeks fescue) and Avena
barbata (slender wild oat), both of which are annual grasses. One possible
interpretation for this is that the polygon is misclassified, yet data for both polygons
of this series in Bayview Park indicate that Nassella pulchra was observed with a
cover class of 4 (26-50%) among the dominants observed in the polygon walk-through.
Barring a field observation error, the most likely explanation is that the gridded point
samples did not capture any areas of Nassella pulchra. This is not
surprising since the nine point samples measured in this polygon cover a total area of
7.07 m2, which represents but 0.04% of the 17,716 m2 polygon area.
This sampling effect can also can be seen at the subformation level, as well as in
comparing individual parks with the whole dataset. In McLaren Park, an importance
table created for the Perennial Grassland subformation identifies Nassella pulchra,
a perennial grass, as the most abundant species with Avena barbata (slender wild
oat) as second in abundance. For all parks, Avena barbata appears as the
most abundand, though not by a large margin. The limited sampling density described
above is probably part of the cause, but this also illustrates the effect of dilution of
individual species data. Avena barbata is a common grass in many areas, and in
perennial grassland areas is commonly the second grass in abundance. Combining all
of these areas dilutes the effect of specific perennial grasses in favor of the common
second.
Another factor that helps to explain the relatively low importance values (being a measure
of overall coverage percentage) for native perennial grasses in polygons classified as
perennial grass is an intended bias for identifying areas of remnant native species.
A major purpose for the Natural Areas program is to manage park lands to increase
areas of native species, so areas where even a degraded coverage of native species gets
greater attention.
The GIS methods developed during this project are only now being used by Natural Areas Program personnel, and it remains to be seen how successful this approach may be. We expect that the initial use will focus on identifying further data and interpretation problems. Initial analysis clearly indicates problems in data density: the 0.04% sampling density described above is for a comparatively well-sampled polygon. Most polygons have no plot samples; many others have only one. Clearly many important minor species are missed in this approach.
The biggest challenge is time and cost for field sampling. As time-consuming as the plot sampling was, the dataset represents a diminishingly small areal proportion of the natural areas -- the total plot sampling density was 0.03% of the area. Time constraints forced the field team to shift their analysis to polygon characterization. From a management perspective, the polygons are the unit of study since restoration personnel can be directed to areas. One doesn't restore a plot -- it is but a sample point used with other sample points to quantify the characteristics of the larger area. On the other hand, only the plot samples provides the means of quantifying the species characteristics, and thus of evaluating the validity of the polygons.
California Native Plant Society. 1998. Relevé Protocol, Draft #2, November 20, 1998. Accessed online at http://www.cnps.org/archives/forms/releve.pdf.
Zebell, R., 2001. Personal communications, June 14-22.
Holland, R.F., 1986. Preliminary descriptions of the terrestrial natural communities of California. State of California, The Resources Agency, Nongame Heritage Program, Dept. Fish & Game, Sacramento, Calif. 156 pp.
Holzman, B. 2001. Isolation of natural areas due to urban development: San Francisco. San Francisco State University Department of Geography & Human Environmental Studies Poster Series, Spring 2001.
Sawyer, J. O., and T. Keeler-Wolf, 1995. A manual of California vegetation. California Native Plant Society. Sacramento, CA, and Federal Geographic Data Committee, 1997. National Vegetation Classification Standard. FGDC-STD-005.
Vasey, M., 2001. "Saving all the pieces: a framework for managing urban natural areas" (draft). 3 p.
Jerry Davis
Dept. of Geography and Human Environmental Studies
Debra Dwyer
GIS Specialty Center
San Francisco State University
1600 Holloway Ave.
San Francisco, CA 94132