Optimizing Fire and Rescue Services Using GIS
Abstract
We explore the many functions of Fire and Rescue, and how GIS is used to improve each in Prince William County Virginia. The combined system has 1,100 career, volunteer, and civilian workers; a service area of 348 square miles, and a population of almost 300,000 and growing. Requests for E911 services are on the rise. GIS is a vital part of daily operations. This paper showcases applications used today, details of our Unit Travel Time Model, and an ArcView demonstration. Some areas covered are Incident Mapping, On-Scene Incident Command, Hazmat (risk assessment), Emergency Operations Center (EOC), Epidemiology (Health and Safety), analysis and modeling of station locations, service boundaries, and responding orders for dispatching of E911 units during emergencies.
Introduction
Prince William County is located in northern Virginia. It is approximately 35 miles southwest of Washington, DC. According to the Census Bureau, Census 2000 Redistricting Data, as of April 1 2000, the County total population was 280,813. The total population of the two jurisdictions that are totally surrounded by the county, City of Manassas and City of Manassas Park, was 35,135, and 10,290 respectively. Washington Council of Governments (COG) estimates the population in the County to exceed 384,000 by the year 2020 according to COG 6.2 Data. It is a fact historically that when the population increases, the number of emergency incidents increase. This in turn creates a higher demand for fire and rescue services. With the use of GIS, we have the necessary tools, and are better postured to meet those growing demands for emergency services.
Background
The Prince William County Fire and Rescue Service is a combination system. There are a total of 12 independent Volunteer Departments, and one Career Department. In total there are currently 17 fire and rescue stations. The System exists within a consolidated management concept. It is governed by a Fire and Rescue Association, and is chaired by the career Fire Chief. The system is funded by fire and rescue levies assessed on real property, the general fund of the County�s budget, and donations to the volunteer departments. An in-depth comprehensive fire and rescue station site study is currently underway in-house which takes many factors into consideration. Once completed, a procedure will be in place that will identify station needs and prioritize them in accordance with the demand for services. And yes, the GIS is definitely an invaluable tool in getting this accomplished, and will continue to be far beyond the completion of the study.
GIS was initially introduced to Prince William County in 1987. Initial installation consisted of 12 basic data layers being accessed from only a few terminals via hard wire. Now after 14 years of development, more than 60 data layers are in existence, accessed via network, and are being updated regularly. ArcInfo and versions or ArcView are being used on various platforms throughout the many individual County Departments. Some Departments today now have their very own GIS position assigned. This gives the individual departments the ability to develop their own specialized applications was the case with the Department of Fire and Rescue.
Fire and Rescue GIS
In 1996, GIS use increased dramatically and as a result of County reorganizations, a GIS Administrator was assigned to the Department. After the introduction of GIS as a decision making tool for providing more efficient Fire and Rescue Services, some have ventured to say with wonder "What were some of the decision making tools in the past?" Once the union of GIS and the Fire and Rescue service was consummated, the tasks of teaching GIS technology and learning the business of emergency services took place. A task group was then formed, made up of personnel of many ranks, and from all areas within the Fire and Rescue Service. The responsibility of the group was to collectively define short, medium, and long-range goals and objectives for the Department to be accomplished using GIS. By establishing Performance Measures, we could then document, monitor and track accomplishments, as well as collect statistical data for analysis in the future. Now after three years of GIS within the Department, we have developed over 20 Fire and Rescue specific data layers to include fire hydrants, landing zones, service area boundaries (existing and proposed), and a unit travel time model to name a few. The installation of ArcView at each station was finished within those three years. In-house training of designated emergency personnel has been completed as well. As each year went by, more and more emergency personnel were realizing the benefits of having our very own GIS, and more and more requests for maps and analyses were being made. To give you an idea of the use of GIS today, here are some statistics from collected data for FY 2000:
FY 2000 Statistic
325 GIS requests (There were 106 in FY 98)
482 maps were produced
20 Boundaries were reviewed
364 GIS analyses were conducted
25 Data layers updated
97 Hours of ArcView training conducted
Realizing the many benefits and value, and experiencing the increasing number of requests for GIS services has prompted us to include the request for additional GIS personnel in the Department�s Five Year budget plan.
Incident Mapping
Having GIS in the Department has allowed us the ability to use current technology to make improvements in many areas of providing emergency services. By downloading our CAD (Computer Aided Dispatch) data, and importing it into ArcInfo, we are able to review call volume, density, and workload distribution. By going through a geocoding process, matching addresses in the CAD system, with address ranges in our street network, we can analyze call types, unit responses, and workload by time of day. Using the results of these analyses, we can for example, determine whether we have the proper units staffed at the times and locations in which they need to be in order to optimize response time. An actual decision that was made recently based in part on this application, was where to locate an additional EMS unit. The GIS was also very instrumental in showing that we needed an additional unit, and in getting the necessary funding approved for that unit from the County�s budget.
Hazardous Materials
In the area of Hazardous Materials (HAZMAT), improvements have been made on almost every front, from developing preplans to on-the-scene mapping. Prince William County currently has two Hazmat Officers with emergency response vehicles. Each is equipped with a laptop, ArcView installed, an emergency management CD containing shape files of all necessary data, digital color aerial photography of the County, a 4 in 1 printer, scanner, fax, copier, a digital camera, and air cards for wireless transmission of data. Preplans and emergency plans have been prepared containing Extremely Hazardous Substance (EHS) facilities and their vulnerability zones based on the chemicals in use at each. By buffering the facilities, and the major transportation networks (Transportation Risk Assessment), and using this data with the GIS, our Hazmat Team arrives on the scene armed and ready for almost any call for hazardous incident.
(Photographs taken by John Medici, Hazmat Officer)
On Scene Incident Command
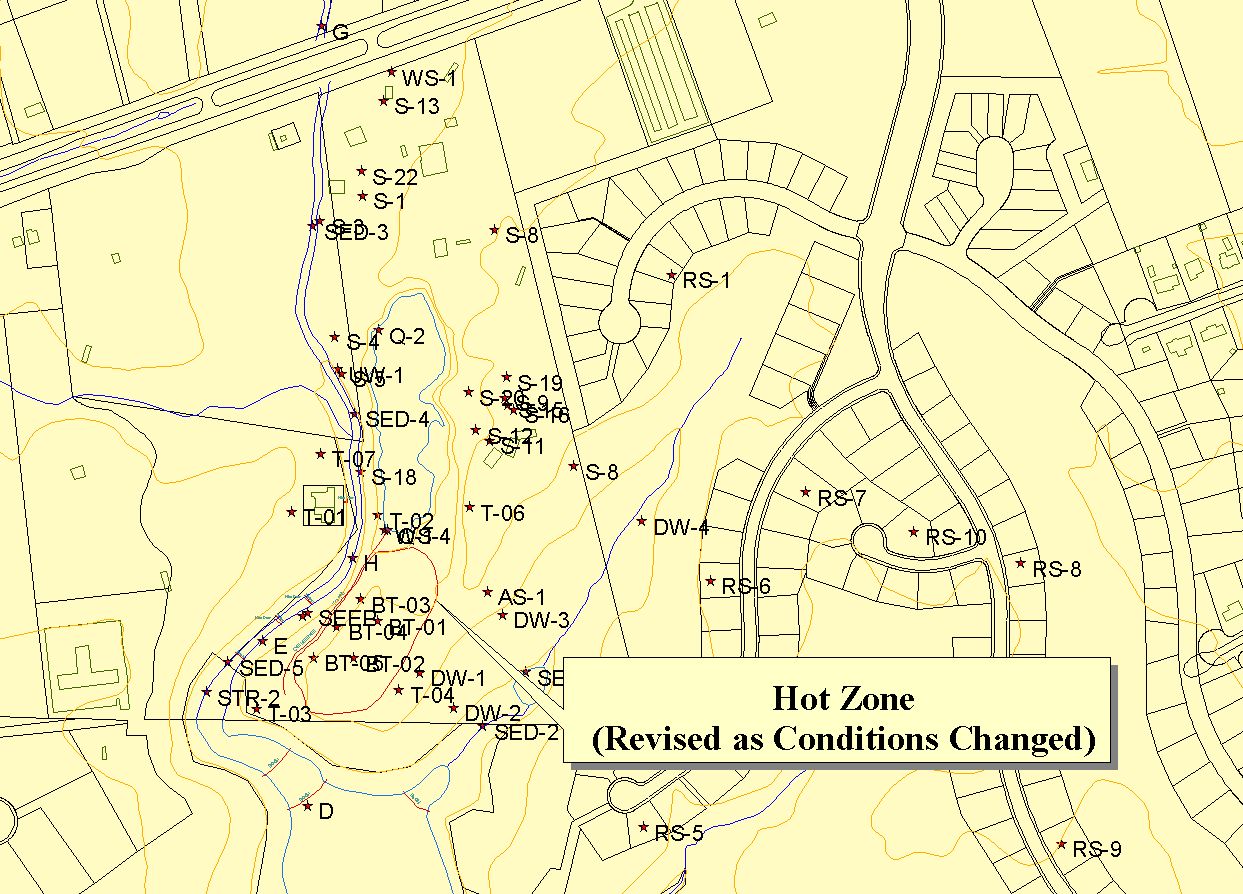
Setting up an On-Scene Incident Command is necessary from time to time depending on the type of incident. When set up was warranted, as with our Hazmat Team, we were mobile with the GIS on laptop loaded with data. In 1999 there was a junkyard fire that burned for 10 days. There was also the possibility of an environmental impact. A lake, (Lake Manassas), which is the source of drinking water for the nearby city was potentially in danger of being contaminated. Emergency personnel were needed around the clock for the duration of that time. Our GIS was quickly set up in the Command Bus, and had printing, faxing and network capabilities as well. Using ArcView, we were able to map the hot zones of the fire, identify where the booms needed to be placed, and continuously provided updates to personnel in the field. We were also able to send a digital map product created in ArcView via e-mail, back to the Board of County Supervisors in the administration building who at one time were in session, and wanted an update of the situation. During this particular incident, the Ffire and Rescue Service worked jointly with the Environmental Protection Agency (EPA) and the Virginia Department of Environmental Quality. (DEQ). Working together using GPS, we were able to collect way points of soil and water samples taken, and later uploaded the data into GIS and mapped.
 (Photo take by Richard Cayer)
Speaking of joint operations when it comes to On Scene Incident Command, in the spring of 2000, GIS again came to the rescue when the County worked side by side with the ATF. There was an incident in a moderately populated residential neighborhood where loud explosions were heard. Soon after the loud explosions, a single family home had burst into flames. After fire fighters started to extinguish the fire, additional explosions occurred. The ATF was called in and eventually it was discovered that pipe bombs and other explosive devised were found. We assisted the ATF on the scene as they gathered information and mapped the location of evidence. The format used during the collection of data was such that it could not be plotted or printed on the equipment available. By using the GIS to transform and import the data into ArcInfo and ArcView, we were able to convert it into a usable format, and produce map products for concerned citizens, County Officials, and the media.
Emergency Operations Center
One of the short-range goals and objectives identified by the task group early on was to improve the functionality in the County�s Emergency Operations Center (EOC). The EOC is activated and operational in cases of County emergencies such as natural disasters. All of the maps stored for use in the EOC were very old and out of date. Some of the mapping data was as much as 17 years old. How efficient could you be during emergencies with old street map information, when streets are being built or improved almost daily. We immediately went to work using the GIS to produce hard copy and digital preplans and maps of flood prone areas, pipelines, utilities, and emergency shelter locations. We also established procedures to be implemented upon activation of the EOC, which involved setting up laptops loaded with all available digital data and photography. ArcView would be used and projected on the big screen within the intelligence group area. As calls came into the EOC during an emergency identifying locations of various incidents, they were mapped using Arcview. Flood locations, downed trees, and closed roads, would be interactively mapped for all groups to see at any given moment. Periodically status maps of the current situation would be printed out for dissemination, or e-mailed to emergency personnel in the field, state and federal agencies, or anyone who needed to know the status at any given time. These procedures were put to the test and carried out very successfully in September of 1999 when Hurricane Floyd came through our area. Governor Gilmore declared a state of emergency for the entire Commonwealth of Virginia during that incident. We were also successful during a Regional Y2K Exercise in 1999, and on the actual eave of the year 2000.
Fire Marshal�s Office
The Fire Marshall�s office was another area where the use of GIS has help to improve operations. Arson fires are not always easy to investigate. Many hours are spent in gathering data and evidence from many different sources. By using GIS, we are able to use incident data to isolate specific types of fires, and identify geographic areas where these fires initiated. With the use of this tool, investigators can easily come up with a pattern of suspected arsonists, and target specific areas for investigation. While conducting the other functions of the Fire Marshall�s office such as plan review and routine inspections, the GIS database is again a great source of property, address, and ownership information.
Health and Safety
From time to time a situation will arise that will have cause for us to focus on a special project, and work jointly with multiple agencies within the County. In joining with the Prince William Health District, we had such an occasion with the introduction of GIS and Epidemiology to the medical field. Mapping and analysis of the spread and control of diseases and outbreaks was a very exciting venture especially in the health and medical professions. This joining of GIS and Medicine is still in the early stages, and there are tremendous benefits to gain from it as well. We took a sample of data from a measles case experienced in the County back in 1988. After bringing the data into ArcInfo and geocoding the locations, we were able to spatially identify each case in relationship to the others. Once the data was spatially located and identified, we were then able to group illnesses, and their severity with people, places, and activities. If this capability existed in 1988 for us when the measles outbreak was actually experienced, we would have been able to target the outbreak, map the spread, and took preventive measures at strategic points, and stopped the spread far sooner than we did without the GIS technology. Having this capability now, and documenting suspicious illnesses, helps us in planning for the potential threat of the West Nile Virus and Human Encephalitis. This capability will also help us prepare for other potential bio-terrorist or accidental threat that involves the introduction of an agent that could be contagious and possibly spread throughout the community.
Planning and Analysis
The area in which we have dramatically optimized Fire and Rescue Services by far has been in Planning and Analysis. The mission of the Department of Fire and Rescue is to "Provide Quality Fire, Medical, Emergency, Environmental and Support Services for the Community". The work accomplished within the Planning and Analysis Division, in the Office of the Chief, affects and supports all other functional divisions within the Fire and Rescue Service, to include the Volunteer elements. All of which contributes toward accomplishing that mission. Travel time and distance analyses are two of the most important elements. Those elements and the ability to quickly put on your personal protective equipment (PPE) and go, all affect response time to the scene of an incident. Defining response area boundaries and updating those boundaries when conditions change are important elements as well. People at incidents that require emergency assistance should be serviced and responded to by the closest station and units. And of course, the responding order in which units are dispatched during emergencies, will affect the timeliness in getting the proper units and back up units on the scene on second, third, and subsequent alarms. With these key elements in mind, and using GIS, efficiency in providing emergency services are sure to improve almost immediately, and satisfies the current situation. But not only is GIS the answer to our current situation. In using the travel time model created with GIS, we also have the invaluable tool to model proposed station sites, with overlays of projected estimates in population increases to consider for the future.
Unit Travel Time Model
The Unit Travel Time Model has become widely used in the Department for many situations, and it�s recommendations now part of some Fire and Rescue Association policy. The map product created from the model, "Unit Travel Time Zones", has been published in the 1998 Esri Map Book, and The Guide to GIS Analysis, published in 1999. The model was initially created using ArcInfo 7.2, and the Network extension running on a Unix Workstation. It�s base is the countywide center line coverage. Basic street address items are present in the data set to include street number, name, type, and address ranges. Additional items and attributes are then added such as speed limit, time, and accumulative items for time and distance. The accumulative items "Station_Number_Time" and "Station_Number_Distance" store the accumulative travel time in minutes and distance in miles respectively. The values are base on the speed limit for a particular street segment, the length of that street segment, and a factor for calculating each speed. There are a series of five amls that run in succession from start to finish and completes the model.
The first aml runs through and drops all unnecessary items, and kills all coverages that might not have been deleted when the model was previously created. The second aml works on the attributes by assigning the calculation factor to each street segment based on the speed limit. The third aml runs the "Allocate" program in arcplot. A list is read that contains all of the stations to include in the model, then points (node-id on the street network coverage) are created. Travel time is calculated and stored in the "Station_Number_Time" item. The fourth aml is basically the same as the third aml, running the "Allocate" program, with the exception of travel distance being stored in the "Station_Number_Distance" item. The fifth and last aml deletes any files or coverages created during the run process that are no longer needed.
Once the model is complete, it can be used in ArcView and converted to a shapefile. By clicking on any street segment, you can view the travel time (in minutes), and the travel distance (in miles), from all stations to that specific point. Additionally, the attributes associated with the file such as street name and address are viewable. And as new streets are built, road alignments change, or speed limits are revised in some areas of the county, new arcs can be easily digitized and added to the street network coverage. The attributes can then be updated and the amls re-run. In fact, the model is run numerous times as it is updated to represent many different "What If?" scenarios. The model was validated initially upon completion, and portions revalidated from time to time when conditions have changed (New roads added, speed limits reduced, traffic calming devices installed, etc.). Validation is accomplished by making actual runs in emergency vehicles (without lights and sirens).
Conclusion
Having GIS and the ability to build travel time models, truly helps us in optimizing Fire and Rescue Services in Prince William County, Virginia. We now have invaluable tools in GIS, which contributes greatly to the accomplishments of our many emergency services operations. We can conduct the business of protecting life and property using this technology to help improve efficiency by using time saving applications. From the mobilization of GIS data for on the scene incidents, coordinating data in the EOC, to responding to HAZMAT incidents anywhere, and updating unit responding orders into the CAD system for dispatch, it�s all toward optimizing services. GIS use as a tool in the Fire and Rescue Service has given us capabilities far beyond what we could have ever imagined, and some of which we have yet started to take advantage of.
References
1. U.S. Census, Census 2000 Redistricting Data
2. Metropolitan Washington Council of Governments, Round 6.2 Data
3. Prince William County Health District, Jared Florance, MD
David J. Simms, Technical Program Analyst
Prince William Co. Dept. of Fire and Rescue
1 County Complex Court
Prince William, VA 22192
Office: (703)792-7013
Fax: (703)792-7691
Email: dsimms@pwcgov.org