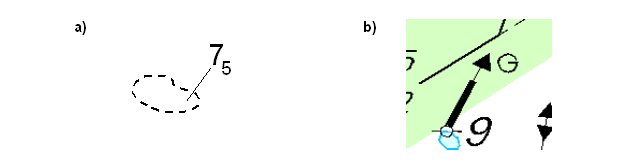
Figure 1.1. Examples of features, which need cartographic editing. a) Displacement of depth figure b) Inclination of spar buoy.
| Henri Saijos Novo Meridian Ltd. |
Tiina Tuurnala Finnish Maritime Administration |
The nSector chart production system is based on ArcInfo 8 technology. It will incorporate all the functions and features for producing the required products from the input data as a cartographically edited chart product with layout. Intelligent cartographic editing tools together with a geodatabase object model and highly specialized drawing methods will offer a state-of-the-art navigational chart production environment. One key issue with the system will be integration with the production of data for Electronic Navigational Chart (ENC). This is essential in order to ensure that the data for chart products is derived from a single source that is centrally updated.
The nautical chart is a mandatory tool of mariner. Together with other navigation equipment, it provides reliable pre-requisites for safe navigation. Because of this, there are specific requirements for nautical chart production compared to topographic map production. During the production process, from beginning to end, it must be noted that the correctness of the data affects directly to the safety of navigation. For the mariner, it is also very important that the chart is at all times up-to-date. For example, the Finnish Maritime Administration (FMA) publishes a new edition of coastal chart once or twice a year. In addition to that, in order to provide a real-time updating service, a booklet including all important updates (instructions to make required chart corrections) is published every ninth day. The booklet is called Notices to Mariners (NtM). One specific aspect of nautical chart, concerning the correctness of the data, is that for the official fairway areas, the producer of the chart has a legal responsibility for the correctness of the chart information.
Previously, the main use of nautical chart databases was in the production of paper charts. Advances in navigation technology have set new demands on accuracy, reliability and the format of nautical charts. The positional accuracy of the chart should meet the increased accuracy of the positioning systems. To fully benefit from the dynamics of the modern positioning methods, digital chart products should be available in parallel to the traditional printed charts. This would allow real time tracking of a ship’s own position on an electronic chart display and also the development of more and more advanced integrated navigation systems. An international standard for digital hydrographic data has been developed by the International Hydrographic Organization (IHO). The valid version of the standard, S-57 edition 3.1, was adopted as the official IHO standard in November 2000 and is also specified in the International Maritime Organization (IMO) Performance Standards for Electronic Chart Display and Information Systems (ECDIS). S-57 describes the standard to be used for the exchange of digital hydrographic data between national Hydrographic Offices and for the distribution of digital data and products to manufacturers, mariners, and other data users. The most significant digital product being delivered in the S-57 format is the electronic navigational chart (ENC). [IHO 2000] The rapidly increased need for electronic navigational charts (ENC) has led to a situation for many hydrographic offices where there are two separate production lines for the two products, ENC cells and paper charts. It is essential for the safety of navigation that the products are not in conflict with one another. The existing modus operandi means that the same updates are done twice in two different databases. Research and development in many Hydrographic Offices is now focused on the challenge of how to combine electronic and paper chart production efficiently and economically.
The same users often use two chart products, Printed Nautical Chart and Electronic Navigational Chart (ENC), but the use method differs remarkably. “Traditional” printed charts are used as a printed paper document when ENC is a part of integrated navigation system on the bridge of vessel. This paragraph describes the differences between these two products by comparing the characteristics of the products and by introducing some examples of the preparation work of the data to be published on the chart. Printed charts present all important information such as chart features with appropriate symbology and descriptive cartographic information texts and symbols. The volume of information is limited due to the size of the chart as well as the readability aspects of it. One of the most important aspects of the preparation work of the data to be published on the printed chart is cartographic generalization and cartographic editing of the data. These include e.g. displacement, aggregation, selection, rotation and text width, font and placement [Jatkola, M. & T. Tuurnala, 1998]. Examples of features, which need cartographic editing, are shown in figures 1.1a and 1.1b.
Figure 1.1. Examples of features, which need cartographic editing. a) Displacement of depth figure b) Inclination of spar buoy.
In addition to informative text on the chart (e.g. light character of a navigational aid) there is a need to give some extra information about the chart to the user. This kind of information is for example mean sea level, buoyage system, projection and horizontal datum. This mandatory information is placed on the legend of the chart. ENC data is presented on the display of the ECDIS and the symbology of the chart features is determined by the object class and its attribute values as well as very dedicated conditional symbology rules, which take into consideration the current navigational situation and the nature of the surrounding data. It is easy to add and remove information on the ECDIS display, the user can select which object classes he/she wants to be visualized on the display (except ‘display base’ object classes, see: IMO, 1996). The level of the presentation detail in ENC information is not limited by the size of the display and its readability aspects in the same manner as in paper charts since the user can select which information is presented at each moment. Together with ability to zoom in and out of the data, the possibility to select information presented on the screen means that there is no need for cartographic editing of the data A good example of differences between ENC and printed chart is the displacement of depth figure (Figure 1.1a). On ENC the depth figure has to be exactly in the correct position, but sometimes this is not possible on paper chart because of limited space.
Research and development in many Hydrographic Offices is now focused on the challenge of how to combine electronic and paper chart production efficiently and economically. The Finnish Maritime Administration (FMA) has developed a new data management and chart production system to meet these new challenges. The first phase of this development project is called the Hydrographic Information System (HIS) Project. The HIS system is based on the Oracle/SDE database and very much tailored ArcView clients. The HIS system is used to enter new data to the database, edit and maintain data quality and for ENC production. Currently there are two separate production lines for the two products, printed chart and ENC. The goal is to replace the existing printed chart production line with a new chart production system - nSector. At the beginning of next year FMA will have one common chart data management and production system for both products and data maintained only once in one common database.
To meet the challenges presented earlier in this paper, FMA and Novo Meridian Ltd. are developing a new paper chart production system called nSector. The nSector extension is based on the Esri's ArcInfo8 technology and it will add cartographic editing tools and chart production functionalities on top of the ArcMap software. As a whole, the extension contains tools for the entire production line: product definition, layout design, high quality output and workflow control. The next chapter introduces perhaps the most revolutionary part of the system - the cartographic editing and visualization subsystem.
One of the key issues with nSector will be integration with the production of Electronic Navigational Charts in FMA. This will be accomplished by integrating the nSector system and its database to the existing HIS system database. The same database will be the data source for both systems (HIS Client to produce ENC Cells and nSector Client to produce printed charts).
While the source data for both products will be the same, the cartographic appearance for paper charts cannot be achieved using traditional methods by editing the geometry of the data. Instead, the entire cartographic appearance of the features is stored to pre-defined cartographic attributes. All cartographic editing is in fact editing of these attributes. Editing the feature geometry is disabled and restricted. This approach ensures that actual data content and geometry are maintained and there is no possibility for discrepancy between different products.
The question is then focused to the solution. If the cartographic appearance is stored to attributes and not to the geometry, how to visualize these features? The answer lies in class extensions and custom behavior classes. All nSector drawing is done using customized draw methods, which manage how the feature geometry will be drawn according to their cartographic attributes and spatial relationships to other classes.
For example light sector is a common feature we can see in nautical charts. In the nSector database this feature is stored to standard point class feature with point geometry. The custom draw method associated with this class will control how this feature is visualized in the view. The visualization method can be for example: visualize with one drop symbol with angle (Figure 3.4) or visualize as sector using attribute combination, such as starting angle, closing angle, light sector range and border lines length (Figure 3.1). Similarly, in the editing phase, the tool will find out the visualization method. If visualized with drop symbol, tool will only allow user to rotate the symbol. If visualized with sectors, the tool will allow user to edit sector range and border lines. Either way, the points geometry remains untouched, while the attributes will be edited. This can be done interactively on the screen by using a mouse or entering actual attribute values to a specially designed feature property page. While the attributes are changed, the custom COM object executes a view invalidation method and the user can see the changing cartographic appearance on the fly.
Figure 3.1. Light Sectors and partly rotated navaids custom features
Another example is a navigation line, which has the ability to draw itself using for example navigation line depth value, direction arrow and bearing text, all within the line (Figure 3.2). These additional text and symbol elements are not actual features, so they do not have any geometry in the database. The cartographic attributes of the navigation line will store information about the content and locations of these elements. Since the element location is stored to navigation line cartographic attribute, the user can freely edit these values and add, remove and displace these elements. Additionally, the text element will automatically mask as invisible the line under the element extent. In a similar way the nSector depth contours can be drawn using depth value from the attribute, which will transparently mask the contour, but not the areas above.
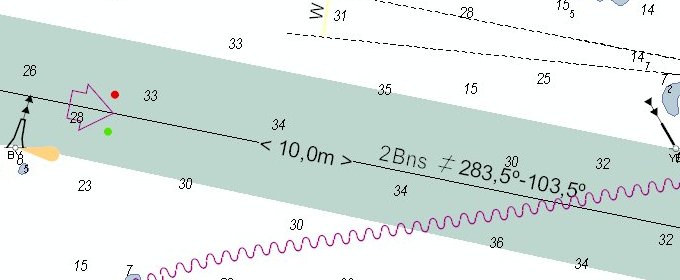
Figure 3.2. Navigation line custom feature with additional text and symbol elements.
Perhaps the most common requirement for cartographically editing a chart product is the ability to rotate and displace point class feature symbols. In many cases the cartographic symbol (or for example depth value in sounding point) is too big to be represented in the actual location of the feature. This functionality is supported by one of the nSector custom package classes. This class supports symbol rotation and displacement plus several options. For example sounding, when displaced, will automatically change the used text symbol and will draw the leader line from actual location to displaced (symbol) location (Figure 3.3). The feature geometry remains untouched and only the cartographic attributes change.
In some cases only a part of the symbol needs to be rotated. This can be also managed by the custom draw method. The most common example is perhaps navaid spar buoys, where only top mark needs to be rotated (Figure 3.4).
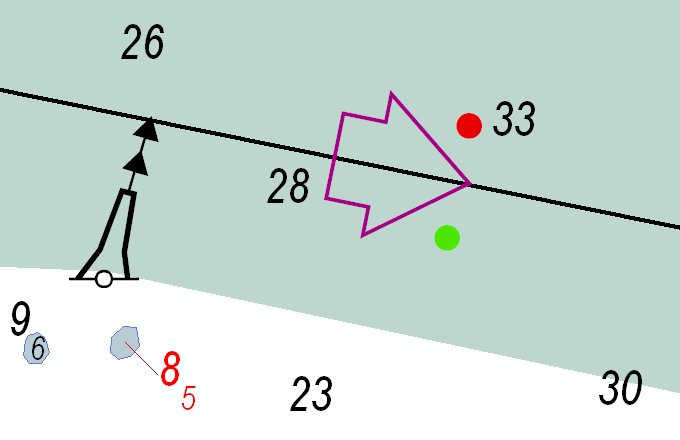
Figure 3.3. Displaced sounding (The displacement is visualized with red font).
All texts in the chart are also customized features. Text feature belongs always to one master feature with composite relationship in database. This ensures that no orphan text elements cannot exist in the final product. If master feature gets deleted during update procedure the related text elements will be deleted automatically from database. The symbol for text element can be freely defined using style library. The symbol can be for example boxed or it can contain leader line to the master feature (Figure 3.4).
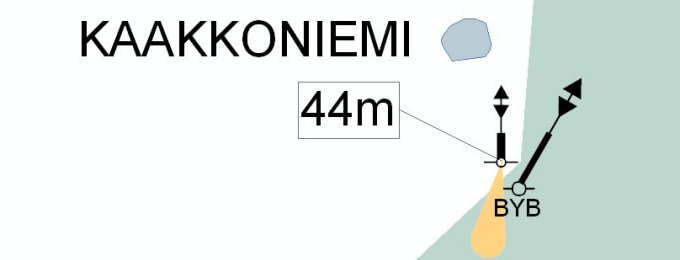
Figure 3.4. Two text elements are associated to edge mark navaid. The other is
displayed by using boxed text symbol with leader line to master feature. Spar
buoy is partly rotated to achieve cartographically aesthetic result.
One approach to managing custom drawing would be the use of spatial relationships, for example different kinds of limit lines, which may overlap. Using standard symbolization the result will be mostly a mess. Using the custom draw method, the features can also be displayed according to spatial relationships to other features or feature classes. For example in nSector limit class overlapping line geometry of two different types of lines will be automatically symbolized by using a combination of both line symbols (Figure 3.5).
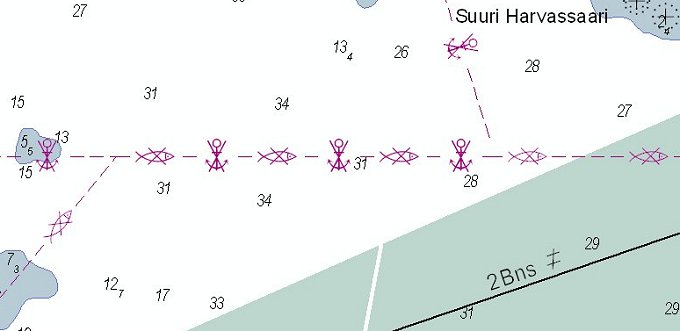
Figure 3.5. Anchoring prohibited and fishing prohibited lines are overlapping. The overlapping piece of line is visualised automatically
by using combination of the both line symbols.
Furthermore, there are no limits concerning complexity of the draw methods. For example, nSector Compass Rose will construct itself by using point coordinates and three attributes, grade, annual change and year (Figure 3.6). Subsequently, this approach offers even more specialized drawing opportunities and for example selective transparent masking option for all line features. For the end user it means finally 100% WYSIWYG support for high quality chart production and it will also simplify the prepress process for the chart production as a whole.
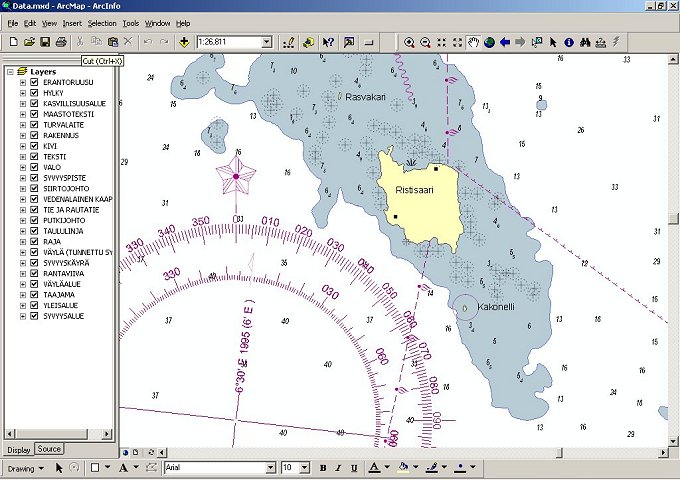
Figure 3.6. Compass rose custom feature.
Most of the customized behavior is implemented at the class (feature) level. However, some of the customized behavior and functionality that is shared (for example retrieving used symbols) are managed at class extension level. When geodatabase feature class is added to the view, the class will check the referenced class extension's CLSID value and the associated class extension will create an instance of this COM object. Similarly the CLSID value for this geodatabase class will store reference to object, which manages the custom drawing of the features. All the special drawing methods are implemented by using the package custom classes. Each package class will implement and support a certain cartographic appearance and editing. For individual feature class the custom behavior can be accessed by inheriting the properties and attributes from this custom abstract class (Figure 3.5).
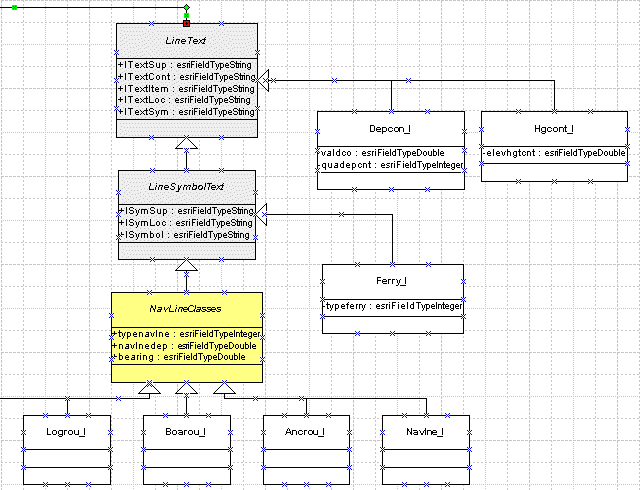
Figure 3.5. Example of package classes in nSector UML model.
Each package class works hand in hand with a corresponding edit tool. The tools themselves have intelligence to help the operator with the editing process. Tools, for example, recognizes the features and feature elements automatically from the screen and acts as defined to this particular feature or feature element. For example, the light sector tool will recognize from the mouse cursor whether the user is going to edit sector range or border lines length. Furthermore there is no need to make feature selections. The tools will automatically select the features from the classes they support.
Finally, one important aspect of nSector class behavior implementations needs to be emphasized. The symbology used for these custom features and additional elements can be freely defined by using standard ArcMap Symbol Editor and specially defined naming convention. The custom behavior of the feature class extensions used includes the ability to retrieve all used symbols from the specified style library. This offers end users an effective, fast and easy way to modify all used symbols without the need for recoding of the COM objects.
The production of Electronic Navigational Charts has dramatically impacted the production processes of Hydrographic Offices. However, the existing production process, where ENC and printed charts are produced separately, is not a good solution in the long term. An integrated production system for both products has been the aim of FMA for several years and the research has focused around this challenge. Finally, although we can now report that the technical solution has been established, the next real challenge, taking the system into practical use, training the users, changing the production processes and changing the mindset of traditional thinking must be pursued.
Authors Note: Readers interested in more detailed information about nSector Chart Production System are welcome to visit nSector Web pages: http://www.meridian.fi
Jatkola, M. and T. Tuurnala, 1998. Multiscale Data Management as a Part of New Chart Production Process. Master’s Thesis, Department of Surveying, Helsinki University of Technology, 106 p. (in Finnish)
IMO 1996. Resolution A.817(19), MSC.64(67) and MSC.86 (70): Performance Standards for Electronic Chart Display and Information System (ECDIS). International Maritime Organization (IMO). 15 Dec. 1996
IHO 2000. IHO Transfer Standard for Digital Hydrographic Data (S-57). Edition 3.1 November 2000. International Hydrographic Organization, Monaco
| Henri Saijos Project Manager, M.Sc (Geography) Novo Meridian Ltd. P.O.Box 54 FIN-02201 ESPOO, Finland Phone: +358 0205 66 5157 Fax: +358 0205 66 5110 e-mail: henri.saijos@novogroup.com |
Tiina Tuurnala Manager, M.Sc. (Tech) Electronic Charts and System Development Finnish Maritime Administration P.O.Box 171 00181 Helsinki, Finland Phone: +358 204 48 4426 Fax: +358 204 48 4670 e-mail: tiina.tuurnala@fma.fi |